


to investigate the pulmonary response to exercise of non-morbidly obese adolescents, considering the gender.
Methodsa prospective cross-sectional study was conducted with 92 adolescents (47 obese and 45 eutrophic), divided in four groups according to obesity and gender. Anthropometric parameters, pulmonary function (spirometry and oxygen saturation [SatO2]), heart rate (HR), blood pressure (BP), respiratory rate (RR), and respiratory muscle strength were measured. Pulmonary function parameters were measured before, during, and after the exercise test.
ResultsBP and HR were higher in obese individuals during the exercise test (p = 0.0001). SatO2 values decreased during exercise in obese adolescents (p = 0.0001). Obese males had higher levels of maximum inspiratory and expiratory pressures (p = 0.0002) when compared to obese and eutrophic females. Obese males showed lower values of maximum voluntary ventilation, forced vital capacity, and forced expiratory volume in the first second when compared to eutrophic males, before and after exercise (p = 0.0005). Obese females had greater inspiratory capacity compared to eutrophic females (p = 0.0001). Expiratory reserve volume was lower in obese subjects when compared to controls (p ≤ 0,05).
Conclusionobese adolescents presented changes in pulmonary function at rest and these changes remained present during exercise. The spirometric and cardiorespiratory values were different in the four study groups. The present data demonstrated that, in spite of differences in lung growth, the model of fat distribution alters pulmonary function differently in obese female and male adolescents.
verificar a resposta da função pulmonar ao exercício em adolescentes obesos, não mórbidos, nos diferentes gêneros.
Métodosestudo transversal com 92 adolescentes (47 obesos e 45 eutróficos), divididos em quatro grupos de acordo com obesidade e gênero, submetidos à avaliação de parâmetros antropométricos, função pulmonar [espirometria e saturação de oxigênio (SatO2)], frequência cardíaca (FC), pressão arterial (PA), frequência respiratória (FR) e força dos músculos respiratórios. A função pulmonar foi avaliada antes, durante e após teste de esforço.
Resultadosa PA e a FC foram maiores nos dois grupos de obesos, durante teste de esforço (p = 0,0001) enquanto os valores de SatO2 diminuíram durante o exercício (p = 0,0001) nestes grupos. Meninos obesos apresentaram maiores valores de pressão inspiratória e expiratória máxima (p = 0,0002), quando comparados com as meninas obesas e eutróficas. A ventilação voluntária máxima, capacidade vital forçada e o volume expiratório forçado no primeiro segundo apresentaram menores valores em meninos obesos, quando comparados com meninos não obesos, antes e após exercício (p = 0,0005). Os valores de capacidade inspiratória foram maiores em meninas obesas quando comparado com as eutróficas (p = 0,0001). Os valores de volume de reserva expiratória foram menores em todos os obesos comparados com os controles (p < 0,05).
Conclusãoadolescentes obesos apresentam alterações da função pulmonar no repouso e que não se alteram com o exercício. Os valores das variáveis espirométricas e cardiorrespiratórias foram diferentes nos quatro grupos estudados. Os resultados mostram; que além de diferenças no crescimento pulmonar o modelo de distribuição de gordura pode alterar a função pulmonar diferentemente em meninas e meninos obesos.
Obesity and pulmonary function have a historical association. Unlike investigations conducted in adults, studies of physical activity and cardiorespiratory fitness in obese adolescents are still scarce and inconclusive.1
Obesity is currently one of the most severe public health problems worldwide, and has attracted the attention of many researchers around the world.2 Obese children and adolescents may have physical and metabolic disorders, psychosocial stress, and changes in respiratory function.3–5
Among the different systems affected by obesity, the respiratory system deserves special attention, as obesity can cause changes in respiratory function, exercise tolerance, pulmonary gas exchange, respiratory pattern, and strength and endurance of the respiratory muscles.6
It is known that obesity is an inflammatory disease, with cytokine expression that alters pulmonary function and results in a greater risk for cardiovascular disease and mortality.3,6 There is enough evidence that obesity represents an important burden on the respiratory system, causing alterations in pulmonary volumes, pattern of breathing, and airway smooth muscle.6
The most frequent pulmonary function alteration in obese children is the reduction in functional residual capacity and diffusion capacity. One of the mechanisms of alteration in respiratory mechanics caused by obesity is the accumulation of fat in the chest, diaphragm, and abdomen.7 The accumulation of fat can compress the chest wall, diaphragm, and lungs, reducing lung volumes and flow.8 Fat distribution in children and adolescents differs from that in adults, and it is little studied between genders;7,8 therefore, obesity may alter the lung function of children and adolescents differently from that of adults.
Changes in pulmonary function due to complications of obesity are well described in adults, and reductions in lung volumes and expiratory flow are often reported. In contrast, there have been few studies that correlate the effects of obesity with pulmonary function, cardiorespiratory alterations, and physical activity in children and adolescents.7,9,10 Most studies retrieved in the literature associating lung function with obesity and exercise were performed in children and adolescents with asthma.11,12
Considering the high and increasing prevalence of obesity in Brazil, this study aimed to investigate the pulmonary response to exercise in non-morbidly obese adolescents of both genders, with no respiratory diseases.
MethodsA cross-sectional study was performed with 92 adolescents aged 10 to 17 years divided into four groups according to body mass index (BMI) and gender: (G1) 23 obese males; (G2) 24 obese females; (G3) 21 eutrophic males; and (G4) 24 eutrophic females, recruited from the Pediatric Obesity Clinic of the Hospital Universitário da Universidade Estadual de Campinas (Unicamp), Campinas, Brazil.
The study was approved by the Research Ethics Committee of the Faculdade de Medicina da Unicamp, and the adolescents and their parents signed an informed consent before study enrollment. Obesity was defined as BMI > 95th percentile of the World Health Organization reference curve. Body composition was assessed by bioelectrical impedance analysis.13
All obese adolescents with more than one year of follow-up, with no other diseases and with periodic clinical and laboratory examinations, were invited to participate in the study. After selection, all patients answered a questionnaire on family and personal history of respiratory and chronic diseases. Those with a history of acute or chronic respiratory disease, chest or skeletal deformities, and heart and congenital diseases were excluded from the study.
Weight was measured with a calibrated platform scale (BL-150 model, Filizola®), with measurement error < 0.01g. Individuals remained with clothes worn for physical activity. Height was measured with an error < 1mm using a stadiometer (Crymych Dyfed Holtain Limited®), and the BMI was then calculated.
Skinfolds were measured three times on the left side of the body with a measurement error < 0.1mm using a caliper (Lange Skinfold Caliper®). Waist circumference was defined as the abdominal circumference located between the last rib and the iliac crest.
Respiratory muscle strength was determined by the maximum pressure generated at the mouth level using a manometer to determine negative and positive pressure (Gerar®). The examination was performed with the subjects in the sitting position, using a nose clip; at least five measurements were obtained. For technically acceptable maneuvers, the highest pressure obtained after the first second of each maneuver was noted. To attain at least two reproducible, acceptable maneuvers, it was required that they differ from each other by no more than 10% of the highest value. The small nozzle orifice enables discreet air flow to maintain an open glottis, without changing the volume of air in the lungs.14 This test was performed before and after the exercise test.
Spirometry was used to determine: forced vital capacity (FVC), forced expiratory volume in the first second (FEV1), forced expiratory flow between 25% and 75% of FVC (FEF25-75%), vital capacity (VC), inspiratory capacity (IC), expiratory reserve volume (ERV), and maximum voluntary ventilation (MVV).
Spirometry was performed before the exercise test (baseline) and at one, ten, 20, 30, and 60minutes after the stress test, and followed the guidelines of the European Respiratory Society and the American Thoracic Society.15 A spirometer model CPFS/ D (Medical Graphics Corporation - St. Paul, MN, USA) was used.
The exercise test was performed on a treadmill in a room with temperature of 22°C to 24°C, with relative humidity of 40%, between 8 and 11 am. Patients were asked to refrain from strenuous exercise 48hours before the test and to not eat for 4hours before the test. After receiving the instructions, the adolescents began the test on a treadmill (Pro Form 725®), starting with a velocity of 1 m/h and 0° ramp slope, which increased by 1.5km/h with a slope of 2° every 30seconds for 2minutes, until it reached the variable velocity according to height (V = [1.16 + 0.02 x height in cm]/1.6) and a total of 10°. After reaching submaximal heart rate ([210 – age] × 0.75), the adolescents continued for six minutes with the same workload.16,17 The test was interrupted if they had dyspnea, cyanosis, or chest pain. Heart rate (HR), blood pressure (BP), pulse oximetry (SpO2), Borg scale, and respiratory rate (RR) were measured before, at three and six minutes during the exercise test, and after its completion.
The G* Power 3.1.6 software program was used to calculate sample size, having as parameters: statistical test (analysis of variance - ANOVA), α = 0.05, β = 0.80 (power of the sample), number of groups analyzed (four = G1, G2, G3, and G4), and the effect of sample size (0.40 - considering obesity with high frequency in the population, and high impact on the test of pulmonary function and cardiorespiratory variables as reported in previous studies).1,2,5,13 According to the calculations, a total of 76 subjects would be required for the study.
The data were processed using the Statistical Package for Social Sciences (SPSS) v.21.0 (IBM-Corp. Released 2012; IBM SPSS Statistics for Windows, release 21.0 - Armonk, NY, United States.). Frequency tables were used for categorical variables, and descriptive statistics for continuous variables. To explain the variability in the measurements, due to the factors “group” and “time”, analysis of variance (ANOVA) was used with repeated measures with RANK transformation. Due to the significance of each effect in relation to the measurements, there are differences between groups or between times. Tukey's comparison was used, with time fixation, to compare the groups. The contrast test was used to compare times. The level of significance for all tests was set at 0.05.
ResultsAll obese adolescents had 30 < BMI < 40. The anthropometric characteristics of obese and normal weight adolescents are shown in Table 1.
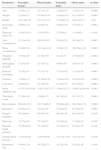
Distribution of body composition values, ethnicity, and cardiorespiratory variables in obese (n = 47) and eutrophic (n = 45) adolescents.
| Parameters | Eutrophic females | Obese females | Eutrophic males | Obese males | p-value |
|---|---|---|---|---|---|
| Age | 15.29±1.23 | 13.77±1.85 | 15.48±0.75 | 14.43±1.44 | 0.0003 |
| Weight | 51.95±8.27 | 85.49±18.79 | 59.68±10.61 | 93.73±16.51 | 0.0001 |
| Height | 161.19±6.79 | 161.27±7.37 | 172.69±6.10 | 168.43±8.37 | 0.08 |
| Body mass index | 19.90±2.29 | 32.64±5.41 | 19.89±2.50 | 33.03±5.11 | 0.0001 |
| Ethnicity – white (%) | 23 (95.83%) | 21 (95.55%) | 21 (100%) | 23 (100%) | > 0.05 |
| Arm circumference | 25.31±4.36 | 48.07±59.83 | 25.85±2.54 | 36.21±4.28 | 0.0001 |
| Waist circumference | 71.68±5.56 | 101.18±13.83 | 74.88±7.10 | 108.78±12.19 | 0.0001 |
| Tricipital skinfold | 15.54±4.05 | 29.74±7.59 | 9.14±4.37 | 27.58±6.09 | 0.0001 |
| Subscapular skinfold | 11.83±3.85 | 26.74±7.22 | 9.00±3.00 | 29.61±7.10 | 0.0001 |
| Body fat percentage | 25.19±2.47 | 37.57±4.35 | 13.28±4.82 | 33.53±5.83 | 0.0001 |
| Fat mass | 13.08±2.73 | 32.76±10.29 | 13.98±18.10 | 32.37±10.61 | 0.0001 |
| Lean mass | 38.68±6.01 | 52.73±8.94 | 51.44±7.41 | 61.87±9.67 | 0.0001 |
| Basal metabolic rate | 1,175.25±181.90 | 1,603.23±271.77 | 1,564±225.71 | 1,869.22±296.48 | 0.0001 |
| Total body water | 27.34±3.44 | 35.69±5.37 | 36.73±5.45 | 45.17±7.23 | 0.0001 |
| Bio-resistance | 664.92±132.1 | 567.73±60.45 | 526.86±108.4 | 500.22±62.79 | 0.0001 |
| Reactance | 84.29±9.29 | 70.91±7.85 | 73.29±5.41 | 63.74±9.03 | 0.0001 |
| Oxygen saturation | 98.13±0.81 | 98.23±1.19 | 98.19±1.08 | 98.71±0.95 | ≤ 0.05 |
| Heart rate | 74.57±9.38 | 78.14±8.27 | 73.62±9.63 | 73.29±9.42 | ≤ 0.05 |
| Diastolic blood pressure | 78.48±10.05 | 78.18±8.94 | 72.14±10.32 | 67.92±7.36 | ≤ 0.05 |
| Systolic blood pressure | 123.91±9.56 | 118.41±9.56 | 111.71±12.58 | 110.21±7.87 | ≤ 0.05 |
| Respiratory rate | 18.96±2.29 | 24.27±20.71 | 18.29±3.05 | 18.83±2.85 | > 0.05 |
Height was not significantly different between the groups (p > 0.05). However, BMI and body fat percentage, which were used to classify each group, showed significant differences (p ≤ 0.05).
The basal values of BP, HR, and oxygen saturation (SatO2) in the obese groups were respectively higher, higher, and lower than in the eutrophic groups. SatO2 values were lower in the obese individuals during the exercise test (p ≤ 0.05). The values differed between the groups and regarding time (p ≤ 0.05) (Table 1, Fig. 1).
 Oxygen saturation (p = 0.011). Higher values were observed for eutrophic females compared to all other groups analyzed at the three and six minutes times. (B) Heart rate (p = 0.037). In the third minute, the obese female group presented higher values than all other groups analyzed; in the sixth minute, obese males showed higher values than eutrophic males, and the obese female group showed higher values than the eutrophic groups. (C) Systolic blood pressure (SBP) (p = 0.001). At baseline, obese males had higher SBP than the eutrophic males, and obese females had higher SBP than eutrophic females. (D) Diastolic blood pressure (DBP) (p = 0.013). At baseline, obese subjects showed higher DBP values than eutrophic females; in the third minute, obese males had higher DBP values than eutrophic males, and obese females had higher values than eutrophic females; in the sixth minute, obese males showed higher values than eutrophic males, and in the first minute after pulmonary function (PF-1min) test, obese males had higher values than eutrophic males and obese females had higher values than eutrophic females.")
Association of cardiorespiratory variables with time of exercise and gender of obese patients and eutrophic controls. (A) Oxygen saturation (p = 0.011). Higher values were observed for eutrophic females compared to all other groups analyzed at the three and six minutes times. (B) Heart rate (p = 0.037). In the third minute, the obese female group presented higher values than all other groups analyzed; in the sixth minute, obese males showed higher values than eutrophic males, and the obese female group showed higher values than the eutrophic groups. (C) Systolic blood pressure (SBP) (p = 0.001). At baseline, obese males had higher SBP than the eutrophic males, and obese females had higher SBP than eutrophic females. (D) Diastolic blood pressure (DBP) (p = 0.013). At baseline, obese subjects showed higher DBP values than eutrophic females; in the third minute, obese males had higher DBP values than eutrophic males, and obese females had higher values than eutrophic females; in the sixth minute, obese males showed higher values than eutrophic males, and in the first minute after pulmonary function (PF-1min) test, obese males had higher values than eutrophic males and obese females had higher values than eutrophic females.
The values of diastolic blood pressure (DBP) and HR were higher in the groups of obese males and females during the exercise test (p ≤ 0.05). The values presented differences between groups and with regard to times (p ≤ 0.05). The group of obese males showed higher SBP values when compared to all other groups (p ≤ 0.05).
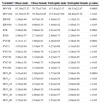
Table 2 and Fig. 2 show the results of spirometry variables. The MVV, FVC, and FEV1 were lower in obese males compared with the eutrophic group, before and after the exercise test (p ≤ 0.05). Spirometry values showed differences between groups (p ≤ 0.05); however, there was no difference between times (p > 0.05). IC values were higher in obese females when compared with eutrophic females (p ≤ 0.05). ERV values were lower in obese males and females when compared with the eutrophic groups. The spirometric values showed differences between groups (p ≤ 0.05), but not for the time (p > 0.05).
Distribution of values of spirometry variables in obese and eutrophic adolescents.
| Variablea | Obese male | Obese female | Eutrophic male | Eutrophic female | p-value |
|---|---|---|---|---|---|
| MVVB | 97.39±27.37 | 78.73±17.65 | 117.43±23.17 | 88.33±22.87 | 0.0005 |
| MVV60 | 91.30±32.55 | 78.50±18.95 | 115.43±27.09 | 88.88±25.76 | > 0.05 |
| ERVB | 1.26±0.49 | 0.87±0.39 | 1.49±0.52 | 1.15±0.32 | 0.0001 |
| ERV60 | 1.13±0.58 | 0.86±0.35 | 1.49±0.42 | 1.05±0.33 | > 0.05 |
| ICB | 2.88±0.86 | 2.60±0.54 | 2.91±0.59 | 2.18±0.38 | 0.0001 |
| IC60 | 2.88±0.57 | 2.71±0.63 | 2.80±0.73 | 2.26±0.44 | > 0.05 |
| FVCB | 4.11±1.11 | 3.60±0.61 | 4.46±0.65 | 3.38±0.58 | 0.0001 |
| FVC1 | 3.97±0.94 | 3.54±0.75 | 4.27±0.69 | 3.31±0.62 | > 0.05 |
| FVC10 | 3.92±1.05 | 3.50±0.78 | 4.22±0.74 | 3.28±0.70 | > 0.05 |
| FVC20 | 3.96±1.08 | 3.47±0.68 | 4.23±0.77 | 3.29±0.65 | > 0.05 |
| FVC30 | 3.86±1.05 | 3.44±0.73 | 4.26±0.69 | 3.28±0.70 | > 0.05 |
| FVC60 | 3.88±1.04 | 3.41±0.66 | 4.16±0.71 | 3.31±0.63 | > 0.05 |
| FEV1B | 3.41±0.94 | 3.05±0.60 | 3.77±0.56 | 2.98±0.56 | 0.0004 |
| FEV11 | 3.23±0.82 | 2.97±0.63 | 3.62±0.54 | 2.88±0.60 | > 0.05 |
| FEV110 | 3.25±0.86 | 2.91±0.59 | 3.63±0.59 | 2.89±0.66 | > 0.05 |
| FEV120 | 3.28±0.88 | 2.90±0.52 | 3.61±0.60 | 2.88±0.61 | > 0.05 |
| FEV130 | 3.19±0.87 | 2.86±0.58 | 3.62±0.57 | 2.89±0.65 | > 0.05 |
| FEV160 | 3.25±0.84 | 2.84±0.55 | 3.55±0.56 | 2.88±0.62 | > 0.05 |
ERV, expiratory reserve volume; FEV1, forced expiratory volume in one second; FVC, forced vital capacity; IC, inspiratory capacity; MVV, maximum voluntary ventilation.
 Maximum voluntary ventilation (p = 0.0005). For the baseline and 60-minute times, eutrophic males showed higher values than eutrophic and obese females. (B) Expiratory reserve volume (p = 0.0001). For the baseline and 60-minute times, eutrophic males showed higher values than eutrophic and obese females; obese males had higher values than obese females; obese females had higher values than eutrophic females. (C) Inspiratory capacity (p = 0.0001). For the baseline and 60-minute times, eutrophic females had lower values than the other groups. (D) Forced vital capacity (p = 0.0001). At all times, eutrophic males showed higher values than the other groups, and obese males had higher values than eutrophic females. (E) Forced expiratory volume in one second (p = 0.0004). For all times, eutrophic males showed higher values than the other groups.")
Association of spirometric variables with time of exercise and gender of obese and normal weight patients. (A) Maximum voluntary ventilation (p = 0.0005). For the baseline and 60-minute times, eutrophic males showed higher values than eutrophic and obese females. (B) Expiratory reserve volume (p = 0.0001). For the baseline and 60-minute times, eutrophic males showed higher values than eutrophic and obese females; obese males had higher values than obese females; obese females had higher values than eutrophic females. (C) Inspiratory capacity (p = 0.0001). For the baseline and 60-minute times, eutrophic females had lower values than the other groups. (D) Forced vital capacity (p = 0.0001). At all times, eutrophic males showed higher values than the other groups, and obese males had higher values than eutrophic females. (E) Forced expiratory volume in one second (p = 0.0004). For all times, eutrophic males showed higher values than the other groups.
MIP and MEP were different between genders, but not between the groups (p ≤ 0.05). The respiratory muscle strength values were significant at baseline, but did not change with exercise.
DiscussionThe results of this study demonstrated that non-morbid obesity (30 < BMI < 40) in children and adolescents differently affected the pulmonary function in males and females. In contrast, exercise was not an aggravating factor in this difference.
These differences may be related to the different model of fat distribution in both genders. It is known that BMI reflects not only adipose tissue, but also muscles and bones. Therefore, the association between BMI and pulmonary function may be due to the action, in part, of the strength of respiratory muscles.18,19
In adolescents, increased BMI may be associated with increased pulmonary function (effect of muscularity), whereas in the elderly, increasing BMI is associated with decreased lung function (effect of adiposity).20 Considering that in adolescence obesity can contribute to increased muscle strength by increasing lean muscle mass, the absence of changes in spirometric values after exercise can be then explained.
It was observed that, with the exception of cardiorespiratory variables, measures of spirometry and respiratory muscle strength were already altered at rest and did not change after exercise. There was a decrease in ERV in obese males and females and an increase in IC in obese adolescent girls when compared to the eutrophic ones. These differences did not change after exercise. Reduced pulmonary volumes, especially functional residual capacity (FRC), ERV, vital capacity (VC), and total lung capacity (TLC) have been identified in obese subjects in several studies.1,7,8
The reduction in FRC and ERV is associated with the closure of peripheral airways, abnormal ventilation/perfusion ratio, and hypoxemia. The reduction of ERV in obesity reflects the inability of the chest wall and of the lung to exhale adequately. 1,21,22 The final resting expiratory position of the lung, chest wall, and diaphragm is determined by the balance of forces of elastic recoil and change in the ratio between ERV and IC. According to Biring et al.,23 in obese females, the increased IC shows normal or increased pulmonary compliance and capacity of the inspiratory muscles to compensate, at least transiently, the deposition of fat in the abdominal and chest wall.
The increase in weight is not always associated with decreased ERV. This fact may result from the site of body fat deposition: while some adolescents accumulate fat in areas that do not interfere with ERV (subscapular region, triceps, and hip), others deposit fat in places that may interfere with ERV, such as the abdominal wall. In such cases, there is considerable increase in intra-abdominal pressure with reduction of ERV.1 Therefore, the impaired ventilation/perfusion (V/Q) ratio, which may occur in obese patients, may be related to the fat deposition region, in addition to the severity of obesity.
In the present study, obese males had lower FVC and FEV1 when compared with eutrophic males. There was no difference regarding time. This fact was not observed in the groups of females.
Some authors have demonstrated that morbidly obese individuals without chronic respiratory diseases did not show improvement in FEV1 and FVC with weight loss. However, there was improvement in ERV, in the partial pressure of oxygen (PaO2), and arterial-alveolar gradient.21,22
Li et al.7 studied 64 obese adolescents, and observed, in the assessment of pulmonary function at rest, decreased FVC only in morbidly obese adolescents (BMI ≥ 45kg/m2).7 These authors observed that only three of the 64 patients had evidence of pulmonary obstruction. In these patients, BMI was > 34kg/m2. The same has been demonstrated with mild degrees of obesity, which should result in less reduction in FEV1 and FVC values, as observed in the present study.
It has been shown that the fat distribution pattern is more representative when compared only to the BMI. Abdominal obesity is often correlated with reduced FVC and FEV1.1 In the present study, obese adolescents had increased concentrations of abdominal fat, a fact observed during the measurement of waist circumference.
In the present study, gender differences were observed in MVV values. Eutrophic males had higher MVV values when compared with eutrophic and obese females. Obese males showed lower mean MVV values when compared with eutrophic males, which was not observed in the two groups of females. Conversely, maximal inspiratory pressure (MIP) and maximal expiratory pressure (MEP) showed differences in groups by gender. Obese males had higher MIP and MEP values when compared to eutrophic and obese females. The values did not change after the exercise test.
It is believed that obese individuals exhibit abnormalities in the peripheral airways, as suggested by reduced maximum expiratory flow at low pulmonary volumes and air trapping. As a result of air trapping, the inspiratory muscles work with mechanical disadvantage, causing low pressure, low inspiratory flow, and inspiratory muscle strength decrease, resulting in reduced MVV.20,24
Another mechanism of MVV reduction in obese individuals results from the extrinsic mechanical compression caused by adiposity, with decreased compliance of the chest wall and increased respiratory load. Some authors verified that the respiratory muscle strength in obese individuals was normal (MIP and MEP), and that the reduction in MVV suggested muscle weakness, probably resulting from the extrinsic load on the chest wall.24,25 The same was observed in the present study.
In the present study, it was observed that obese adolescents tend to have lower exercise tolerance when compared to the healthy control group. This fact can be confirmed by changes in HR, SBP, DBP, and SatO2. The increase in HR, SBP, and DBP were significant in the obese groups. Obese females had higher HR values and obese males had higher BP values.
SBP during exercise increases with increasing load levels, and DBP either increases slightly (less than 10mmHg), remains the same, or decreases slightly (less than 10mmHg). In healthy subjects, who can reach or exceed their maximum predicted HR, SBP may increase during submaximal loads and then remain steady or even decrease at peak exercise. An abnormal DBP response occurs when the pressure increases 15 to 20mmHg or more (above 90mmHg) with exercise.23,26 Although the values of BP and HR were higher in obese individuals, the variables increase was within physiological parameters.
Lower SpO2, observed in the obese subjects, may be related to an imbalance in the V/Q ratio during the exercise test. This change may be related to the reduction of ERV, and was found in both genders among the obese. During exercise, the increase in cardiac output not accompanied by increased ventilation exacerbates the V/Q ratio. The result is a decrease in BP and SatO2. This places limitations on the oxygen extraction reserve and causes increased cardiac output as a compensatory mechanism to improve oxygen consumption.1,27 These facts are more evident in morbidly obese patients who show evidence of hypoxemia and hypercapnia.23,26,28
During the exercise, the partial pressures of oxygen and carbon dioxide (CO2) in the arterial blood are maintained within limits compatible with the equilibrium of systemic change. The linear increase in cardiac output during exercise is proportional to the needs of muscle perfusion. The pulmonary function abnormalities resulting from obesity can cause increase in respiratory work.23 In the morbidly obese, there is an increase in the metabolic demand due to extra muscle work that has to be performed to move the body.23,26 The ratio between oxygen consumption and CO2 production is increased in obesity, even at rest.
The present study has limitations: i) it did not assess the maximal oxygen uptake (VO2max). VO2max may be considered an indicator of cardiorespiratory fitness, and the use of the method would allow for the determination of this variable's effect in these individuals; ii) studies evaluating and comparing the action of exercise on pulmonary function in varying degrees of obesity severity in adolescence should be encouraged; iii) the same should be encouraged when conducting tests to assess maximal exercise rather than submaximal assessment, as in the present study; iv) Polgar values were used for spirometric variables.29
There was no equation for comparison between groups from a population of healthy individuals from the same geographical area. Despite the attempt at a general equation, at the time of data collection it was not possible to compare the results with those of Quanjer et al.30 Equations with normal values for different populations should be encouraged, as it may allow for a better assessment of respiratory disorders in different age groups, between genders, and in varying degrees of obesity of individuals from the same population and physical environment.
ConclusionIt was verified that the model of body fat distribution alters pulmonary function differently in obese males and females, and does not change with exercise test. However, this study was conducted for a short period, included non-morbidly obese individuals, and used submaximal exercise test. Therefore, further studies with obese adolescents, with varying degrees of obesity, using maximal exercise tests, and for longer periods, may allow for a better understanding of the changes in pulmonary function caused by obesity.
FundingFundo de apoio ao ensino, à pesquisa e à extensão da Unicamp (FAEPEX).
Conflicts of interestThe authors declare no conflicts of interest.
Please cite this article as: Faria AG, Ribeiro MA, Marson FA, Schivinski CI, Severino SD, Ribeiro JD, et al. Effect of exercise test on pulmonary function of obese adolescents. J Pediatr (Rio J). 2014;90:242–9.
Study conducted at the Laboratory of Pulmonary Physiology of the Pediatric Investigation Center, Department of Pediatrics, Faculdade de Ciências Médicas, Universidade Estadual de Campinas, Campinas, SP, Brazil.


