
To investigate the frequency distribution of daily meals and its relation to demographic, socioeconomic, behavioral, anthropometric and biochemical factors in children and adolescents.
MethodsThis was a cross-sectional study with a representative sample of 708 schoolchildren aged 7–14 years. Data on personal information, socioeconomic status, physical activity and number of meals were obtained through semi-structured questionnaire and consumption by 24-h recall and food record. Weight and height measurements were also performed to calculate the body mass index. Finally, blood samples were collected for analysis of total cholesterol, high- and low density lipoprotein, triglyceride, and glucose levels. Descriptive statistics, the Mann–Whitney test, and Poisson regression were used in statistical analysis.
ResultsMeal frequency <4 was associated in children, family income <3 Brazilian minimum wages (PR=5.42; 95% CI: 1.29–22.77; p=0.021) and adolescents, the number of sons in the family >2 (PR=1.53; 95% CI: 1.11–2.11; p=0.010). Even in the age group of 10–14 years, <4 meals was related to higher prevalence of body mass index (PR=1.33; 95% CI: 1.02–1.74; p=0.032) and low-density lipoprotein (PR=1.39; 95% CI: 1.03–1.87; p=0.030) higher after adjustments.
ConclusionLower frequency of meals was related to lower income in children and adolescents, larger number of sons in the family, and increased values of body mass index and low-density lipoprotein.
Investigar a distribuição da frequência de refeições diárias e sua relação com fatores demográficos, socioeconômicos, comportamentais, antropométricos e bioquímicos em crianças e adolescentes.
MétodosEste foi um estudo transversal realizado com uma amostra representativa de 708escolarescom idades entre 7 e 14 anos. Os dados sobre informações pessoais, nível socioeconômico, atividade física e número de refeições foram obtidos através de questionário semiestruturado e o consumo através de recordatório de 24h e registro alimentar. Medidas de peso e altura também foram realizadas para cálculo do índice de massa corporal. Por fim, coletaram-se amostras de sangue para análises de colesterol total, lipoproteína de baixa e de alta densidade, triglicerídeos e glicemia. Análises descritivas, Mann-Whitney e regressão de Poisson foram utilizadas nas análises estatísticas.
ResultadosFrequência de refeições < 4 se associou, em crianças, a renda familiar < 3 salários (RP=5,42; IC 95%: 1,29- 22,77; p=0,021) e em adolescentes, ao número de filhos na família > 2 (RP=1,53; IC 95%: 1,11- 2,11; p=0,010). Ainda na faixa etária de 10 a 14 anos, < 4 refeições se relacionou a maior prevalência de índice de massa corporal (RP=1,33; IC 95%: 1,02-1,74; p=0,032) e lipoproteína de baixa densidade (RP=1,39; IC 95%: 1,03- 1,87; p=0,030) elevados após ajustes.
ConclusãoMenor frequência de refeições se associou a menor renda em crianças e em adolescentes a maior número de filhos na família e valores aumentados de índice de massa corporal e lipoproteína de baixa densidade.
It is well established that cardiovascular diseases (CVD) originate in childhood and that two of their main modifiable risk factors, overweight and dyslipidemia, have been increasingly observed in children and adolescents, which are often diagnosed with at least one of these factors.1
The worldwide prevalence of childhood obesity has increased considerably over the past three decades,2–4 especially in countries undergoing economic transitions that favor industrialization and urban and Western lifestyles,3 and, time of excess weight is directly associated with mortality from CVD.5
Atherosclerosis is the physiopathological substrate for CVD that begins in childhood and develops over the years.1,6 Fatty streaks, the precursors of atherosclerotic plaques, appear in the intimal layer of the aorta at three years of age and in the coronaries during adolescence, having dyslipidemia as a traditional risk marker of this process.7
Evidence to date attributes the increased prevalence of excess weight and dyslipidemias to the interaction between genetic and environmental factors. Regarding diet, the consumption of energy and macronutrients has been widely investigated. However, the etiology of existing eating models may not fully explain the development of the risk factors for CVD; eating behaviors also need to be investigated.8
Among the variables related to these behaviors, a protective effect of higher frequency of daily meals on overweight and obesity has been detected in children and adolescents.9–11 Furthermore, although this effect has been observed mainly in relation to total body mass, it has also been observed in relation to deleterious changes in serum lipids.11,12
According to some authors, the habit of skipping meals contributes to dietary inadequacy and increased body weight, as the foods commonly consumed in certain meals are hardly eaten at other times throughout the day and may even be replaced by unhealthy foods.13,14 In addition to this effect that may be mediated by changes in food intake, changes in the postprandial energy expenditure that can predispose to long-term weight gain15 and increased serum cholesterol resulting from higher mean concentrations in plasma insulin peaks and greater area under the curve of insulin responses have also been suggested in irregular eating patterns.
Considering that eating behaviors – such as frequency of meals – may contribute to dietary inadequacy and to prevent the increase of body weight and healthy serum lipid profiles in individuals and populations, the aim of this study was to investigate the distribution of the frequency of daily meals and their association with demographic, socioeconomic, behavioral, anthropometric, and biochemical factors in children and adolescents.
MethodsStudy population and sampling processThis epidemiological cross-sectional study was carried out in 2012 with a representative sample of 708 children and adolescents aged 7–14-years-old, of both genders, attending public and private elementary schools from the urban area of the city of Juiz de Fora, state of Minas Gerais, Brazil.
The definition of sample size (n=708) was based on the following criteria: determination of desirable levels of accuracy and significance of 2% and 5%, respectively, establishing a prevalence of 8% obesity in the assessed age range16 and 20% loss (no authorization from parents or students to participate in the study). Twenty-six students were excluded for not adequately filling out questions related to frequency of meals.
The sampling process was carried out in three phases, according to the following order: cluster sampling, schools were randomly selected within each region of the city; proportional stratified sampling, where the number of individuals sampled in each school grade was proportional to the total number of existing students in each one of them; and, simple random sampling, where the selection of students by school and grade was carried out by drawing lots until the number of students required per school was reached.
Data collection toolsThe frequency of meals was obtained by applying a structured questionnaire containing the following meal options: breakfast, morning snack, lunch, afternoon snack, dinner, and evening snack, asking the participants to identify the meals that they usually had. Meal frequencies were categorized according to the mean value of this variable in the study population as risk (<4 meals) and no risk (≥4 meals).
The tools used in the assessment of food consumption utilized a 24-h food recall for each research subject, applied by the researcher with the help of a photo album and a three-day food record; the latter was given to the students or parents/guardians to be filled out at home and returned on a previously scheduled date; they were instructed to apply it every other day and to include a day on the weekend. Subsequently, the data were entered in the Dietwin® (Dietwin®, nutrition software, version 2008; Brazil) program for the analysis of daily energy consumption.
The multiple source method program (Department of Epidemiology of the German Institute of Human Nutrition Potsdam-Rehbrücke, German) able to estimate the usual intake of each individual through adjustments from 24-h food recalls of the total sample plus three more food records of a subsample, was used to estimate the usual mean intake in the total sample.
Watching two or more hours of TV daily was categorized as “risk” based on recommendations of the Expert Committee Recommendations Regarding the Prevention, Assessment, and Treatment of Child and Adolescent Overweight and Obesity.17 Regarding the total time of physical activity (TPA), children and adolescents were classified as active when they performed 300min or more of moderate or vigorous physical activity weekly and inactive when they performed less than 300min, according to the classification used in the National Students’ Health Survey (Pesquisa Nacional de Saúde do Escolar [PeNSE] 2012).18
Weight was measured on a Tanita® scale, Ironmen BC-553 model (Tanita Corporation of America – Arlington Heights, USA) with a maximum capacity of 136kg and precision of 0.5kg. The individuals were weighed in the standing position, barefoot and wearing light clothes. Height was measured using an Alturexata® field stadiometer (Alturexata, Brazil), body mass index (BMI) was calculated based on the obtained values, and the children and adolescents were classified as having excess weight (overweight or obesity) based on BMI for age ≥Z score + 1, according to the limits proposed by the WHO.19
Blood samples were obtained from the individuals after a 12-h fast. Biochemical measurements of total cholesterol and fractions (HDL and LDL), triglycerides, and glucose were performed. Alterations in serum lipids and glucose were analyzed according to the V Brazilian Guideline on Dyslipidemia and Atherosclerosis Prevention20 and according to the criteria of the National Diabetes Education Program (NDEP), respectively, considering the borderline values for serum lipids and fasting blood glucose levels ≥100mg/dL as risk factors.
Statistical analysisThe normality of the data was verified by the Kolmogorov–Smirnov test. Subsequently, descriptive analysis stratified by age range was performed and the Mann–Whitney test was used to identify significant differences between the values of the central tendency measures.
To analyze the associations between frequency of meals and the variables of interest, crude Poisson regression and Poisson regression adjusted with robust variance adjustment and control for the design effect were used. Variables with a significance level ≤0.20 or those that could represent potential confounding factors were included in the models.
Differences between values were considered statistically significant for p<0.05. Statistical analyses were performed using SPSS (SPSS®, version 13.0, USA) and Stata (Stata, version 10.1, USA).
Ethical aspectsThe project was approved by the Ethics Committee of Universidade Federal de Juiz de Fora (Opinion No. 09/2010; CAAE 0018.0.180-10), with free and informed consent obtained from parents or legal guardians after they were informed about the research objectives, protocol, and procedures.
ResultsOf the 708 students aged 7–14 years, 682 correctly answered questions related to the number of meals and, therefore, comprise the subsample of this article. Of these, 1.68% were from private schools and 98.32% from public schools; 47.66% were boys and 52.34% girls, with a mean age of 10.82±2.14 years, with no difference in mean age by gender (p=0.981). In the sample, 35.5% of the children and 31.5% of the adolescents had excess weight.
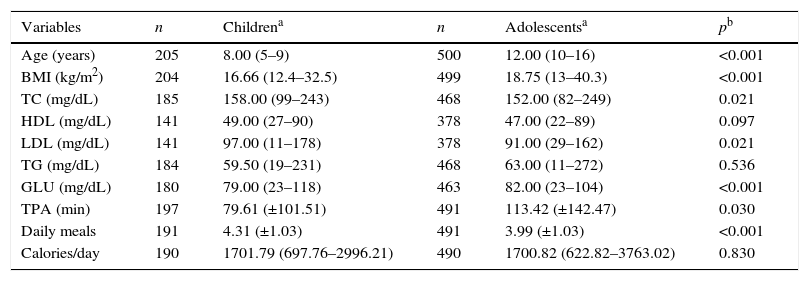
BMI, fasting glucose levels, and TPA were significantly higher among adolescents; however, the children showed higher values of TC, LDL, and a higher number of meals, and energy consumption did not vary significantly according to age range (Table 1).
Demographic, anthropometric, biochemical, behavioral, and dietary characteristics of children and adolescents.
| Variables | n | Childrena | n | Adolescentsa | pb |
|---|---|---|---|---|---|
| Age (years) | 205 | 8.00 (5–9) | 500 | 12.00 (10–16) | <0.001 |
| BMI (kg/m2) | 204 | 16.66 (12.4–32.5) | 499 | 18.75 (13–40.3) | <0.001 |
| TC (mg/dL) | 185 | 158.00 (99–243) | 468 | 152.00 (82–249) | 0.021 |
| HDL (mg/dL) | 141 | 49.00 (27–90) | 378 | 47.00 (22–89) | 0.097 |
| LDL (mg/dL) | 141 | 97.00 (11–178) | 378 | 91.00 (29–162) | 0.021 |
| TG (mg/dL) | 184 | 59.50 (19–231) | 468 | 63.00 (11–272) | 0.536 |
| GLU (mg/dL) | 180 | 79.00 (23–118) | 463 | 82.00 (23–104) | <0.001 |
| TPA (min) | 197 | 79.61 (±101.51) | 491 | 113.42 (±142.47) | 0.030 |
| Daily meals | 191 | 4.31 (±1.03) | 491 | 3.99 (±1.03) | <0.001 |
| Calories/day | 190 | 1701.79 (697.76–2996.21) | 490 | 1700.82 (622.82–3763.02) | 0.830 |
BMI, body mass index; TC, total cholesterol; HDL, high-density lipoprotein; LDL, low-density lipoprotein; TG, triglycerides; GLU, glucose; TPA, total time of physical activity.
The habit of having four or more meals was significantly more prevalent among children (80.1%) than among adolescents (68.8%; p=0.003) and more prevalent among males (77.9%) when compared to females (66.6%; p=0.001; data not shown).
Among the adolescents, girls that had fewer than four meals had a 1.53-fold (PR=1.53; 95% CI: 1.06–2.22; p=0.022) higher risk of having excess weight when compared to those with a more frequent pattern of meals. No significant differences were observed regarding the prevalence ratio of excess weight for the different meal patterns in male adolescents and children of both genders (data not shown).
TPA and the median caloric intake did not vary significantly between children who had fewer than four meals vs. four or more meals. Adolescents also showed no differences in TPA according to the frequency of meals. However, among adolescents, the median caloric intake was higher (p<0.001) among individuals who consumed four or more meals than among individuals who consumed fewer than four (data not shown).
Among the individuals who had fewer than four meals a day, supper was the most often skipped meal by the children (66.0%) and adolescents (77.3%), followed by snacks, which were skipped by 60.0% of children and 61.0% of adolescents, and breakfast, skipped by 32.0% of children and 34.8% of adolescents (data not shown).
No significant differences were observed in children regarding the different skipped meals by gender; however, among adolescents, girls more often skipped breakfast (34.9% vs. 23.3; p=0.009) and lunch (11.2% vs. 5.6; p=0.050) when compared to boys, whereas snacks were more often skipped by males than females (60.3% vs. 49.1, p=0.034; data not shown).
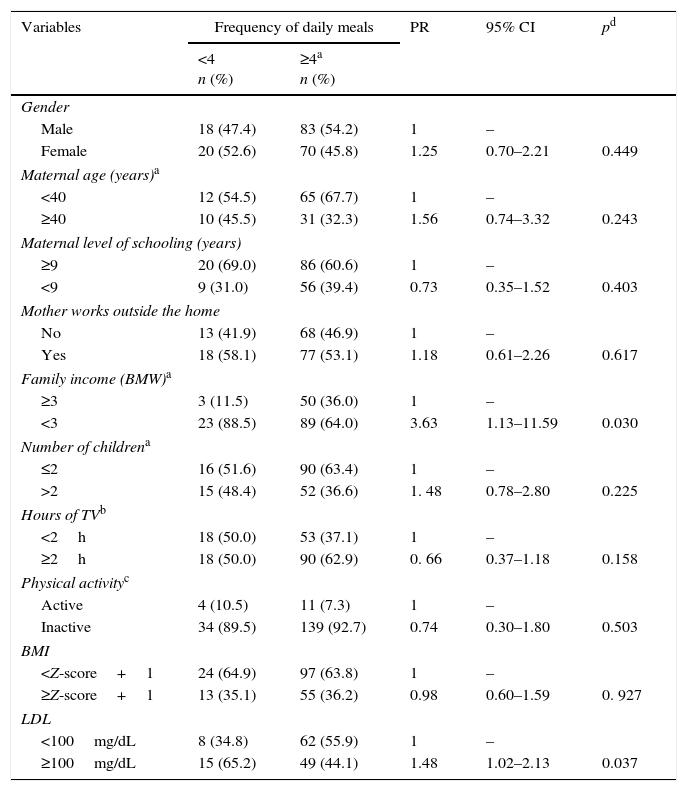
Table 2 shows the unadjusted Poisson regression analysis in children, demonstrating that the prevalence of the pattern of less than four meals/day was higher among individuals with lower family income (PR=3.63; 95% CI: 1.13–11.59; p=0.030) and that this pattern was associated with a higher prevalence of increased LDL (PR=1.48; 95% CI: 1.02–2.13; p=0.037).
Frequency distribution of daily meals and crude prevalence ratio according to demographic, socioeconomic, dietary, behavioral, anthropometric, and biochemical variables of children, Juiz de Fora, MG, Brazil, 2012.
| Variables | Frequency of daily meals | PR | 95% CI | pd | |
|---|---|---|---|---|---|
| <4 n (%) | ≥4a n (%) | ||||
| Gender | |||||
| Male | 18 (47.4) | 83 (54.2) | 1 | – | |
| Female | 20 (52.6) | 70 (45.8) | 1.25 | 0.70–2.21 | 0.449 |
| Maternal age (years)a | |||||
| <40 | 12 (54.5) | 65 (67.7) | 1 | – | |
| ≥40 | 10 (45.5) | 31 (32.3) | 1.56 | 0.74–3.32 | 0.243 |
| Maternal level of schooling (years) | |||||
| ≥9 | 20 (69.0) | 86 (60.6) | 1 | – | |
| <9 | 9 (31.0) | 56 (39.4) | 0.73 | 0.35–1.52 | 0.403 |
| Mother works outside the home | |||||
| No | 13 (41.9) | 68 (46.9) | 1 | – | |
| Yes | 18 (58.1) | 77 (53.1) | 1.18 | 0.61–2.26 | 0.617 |
| Family income (BMW)a | |||||
| ≥3 | 3 (11.5) | 50 (36.0) | 1 | – | |
| <3 | 23 (88.5) | 89 (64.0) | 3.63 | 1.13–11.59 | 0.030 |
| Number of childrena | |||||
| ≤2 | 16 (51.6) | 90 (63.4) | 1 | – | |
| >2 | 15 (48.4) | 52 (36.6) | 1. 48 | 0.78–2.80 | 0.225 |
| Hours of TVb | |||||
| <2h | 18 (50.0) | 53 (37.1) | 1 | – | |
| ≥2h | 18 (50.0) | 90 (62.9) | 0. 66 | 0.37–1.18 | 0.158 |
| Physical activityc | |||||
| Active | 4 (10.5) | 11 (7.3) | 1 | – | |
| Inactive | 34 (89.5) | 139 (92.7) | 0.74 | 0.30–1.80 | 0.503 |
| BMI | |||||
| <Z-score+1 | 24 (64.9) | 97 (63.8) | 1 | – | |
| ≥Z-score+1 | 13 (35.1) | 55 (36.2) | 0.98 | 0.60–1.59 | 0. 927 |
| LDL | |||||
| <100mg/dL | 8 (34.8) | 62 (55.9) | 1 | – | |
| ≥100mg/dL | 15 (65.2) | 49 (44.1) | 1.48 | 1.02–2.13 | 0.037 |
BMI, body mass index; LDL, low-density lipoprotein; BMW, Brazilian minimum wages.
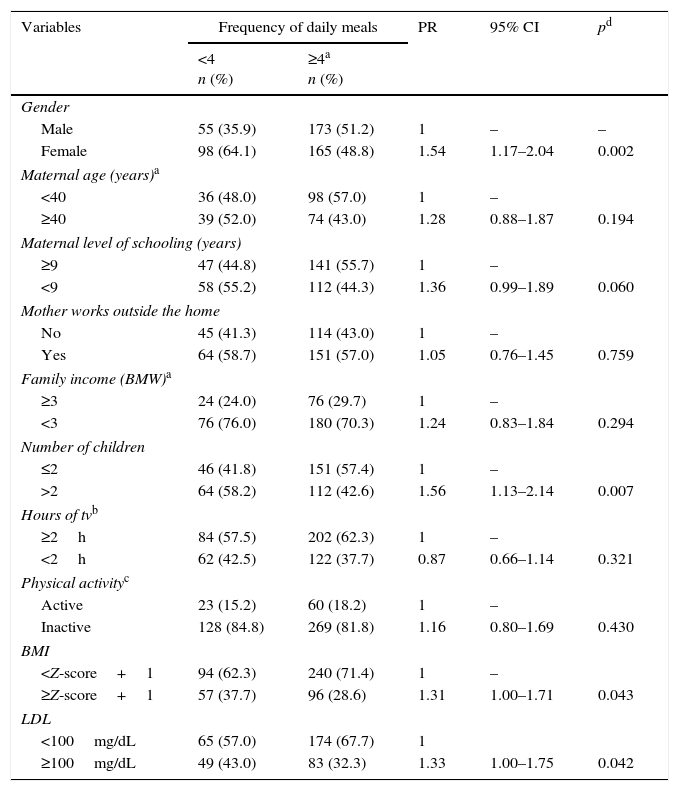
In adolescents (Table 3), the pattern of less than four meals per day was more prevalent among girls (PR=1.54; 95% CI: 1.17–2.04; p=0.002) and among families with more than two children (PR=1.56; 95% CI: 1.13 2.14; p=0.007). In turn, this pattern of meals was also directly associated with increased BMI (PR=1.31; 95% CI: 1.00–1.71; p=0.043) and LDL levels (PR=1.33; 95% CI: 1.00–1.75; p=0.042). The other biochemical variables were not related to the frequency of meals.
Frequency distribution of daily meals and prevalence ratio according to demographic, socioeconomic, dietary, behavioral, anthropometric, and biochemical variables of adolescents, Juiz de Fora, MG, Brazil, 2012.
| Variables | Frequency of daily meals | PR | 95% CI | pd | |
|---|---|---|---|---|---|
| <4 n (%) | ≥4a n (%) | ||||
| Gender | |||||
| Male | 55 (35.9) | 173 (51.2) | 1 | – | – |
| Female | 98 (64.1) | 165 (48.8) | 1.54 | 1.17–2.04 | 0.002 |
| Maternal age (years)a | |||||
| <40 | 36 (48.0) | 98 (57.0) | 1 | – | |
| ≥40 | 39 (52.0) | 74 (43.0) | 1.28 | 0.88–1.87 | 0.194 |
| Maternal level of schooling (years) | |||||
| ≥9 | 47 (44.8) | 141 (55.7) | 1 | – | |
| <9 | 58 (55.2) | 112 (44.3) | 1.36 | 0.99–1.89 | 0.060 |
| Mother works outside the home | |||||
| No | 45 (41.3) | 114 (43.0) | 1 | – | |
| Yes | 64 (58.7) | 151 (57.0) | 1.05 | 0.76–1.45 | 0.759 |
| Family income (BMW)a | |||||
| ≥3 | 24 (24.0) | 76 (29.7) | 1 | – | |
| <3 | 76 (76.0) | 180 (70.3) | 1.24 | 0.83–1.84 | 0.294 |
| Number of children | |||||
| ≤2 | 46 (41.8) | 151 (57.4) | 1 | – | |
| >2 | 64 (58.2) | 112 (42.6) | 1.56 | 1.13–2.14 | 0.007 |
| Hours of tvb | |||||
| ≥2h | 84 (57.5) | 202 (62.3) | 1 | – | |
| <2h | 62 (42.5) | 122 (37.7) | 0.87 | 0.66–1.14 | 0.321 |
| Physical activityc | |||||
| Active | 23 (15.2) | 60 (18.2) | 1 | – | |
| Inactive | 128 (84.8) | 269 (81.8) | 1.16 | 0.80–1.69 | 0.430 |
| BMI | |||||
| <Z-score+1 | 94 (62.3) | 240 (71.4) | 1 | – | |
| ≥Z-score+1 | 57 (37.7) | 96 (28.6) | 1.31 | 1.00–1.71 | 0.043 |
| LDL | |||||
| <100mg/dL | 65 (57.0) | 174 (67.7) | 1 | ||
| ≥100mg/dL | 49 (43.0) | 83 (32.3) | 1.33 | 1.00–1.75 | 0.042 |
BMI, body mass index; LDL, low-density lipoprotein; BMW, Brazilian minimum wages.
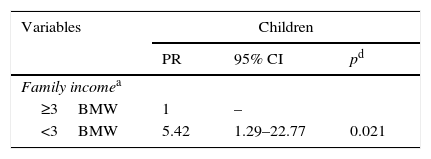
Table 4 illustrates the adjusted Poisson regression analysis. In the model, a lower frequency of meals showed, as an associated factor in children, family income below three Brazilian minimum wages (PR=5.42; 95% CI: 1.29–22.77; p=0.021) and in adolescents, more than two children (PR=1.53; 95% CI: 1.11–2.11; p=0.010). Also in the age range of 10–14 years, individuals with fewer meals showed a higher chance of having elevated BMI (PR=1.33; 95% CI: 1.02–1.74; p=0.032) and LDL levels (PR=1.39; 95% CI: 1.03–1.87; p=0.030), after the adjustments.
Association between frequency of daily meals lower than four and socioeconomic, demographic, anthropometric, and biochemical variables, in children and adolescents, Juiz de Fora, MG, Brazil, 2012.
| Variables | Adolescents | ||
|---|---|---|---|
| PR | 95% CI | pd | |
| Number of childrenb | |||
| ≤2 | 1 | – | |
| >2 | 1.53 | 1.11–2.11 | 0.010 |
| BMIc | |||
| <Z-score+1 | 1 | – | |
| ≥Z-score+1 | 1.33 | 1.02–1.74 | 0.032 |
| LDLc | |||
| <100mg/dL | 1 | – | |
| ≥100mg/dL | 1.39 | 1.03–1.87 | 0.030 |
LDL, low-density lipoprotein; BMW, Brazilian minimum wages.
The present study showed a high frequency of excess weight (overweight or obesity) in children and adolescents, detected in 35.5% of children in the age range of 7–9 years and in 31.5% of individuals aged 10–14 years. These results were significantly lower than those found throughout the country by the Household Budget Survey (Pesquisa de Orçamentos Familiares [POF] 2008/2009) in children (49.8%) and were similar to adolescents (30.0%) at the same age ranges.16
As expected, the association between frequency of meals and gender was observed in the present study as well as in others, with the habit of skipping meals being more frequent in the female gender. Among the reasons for this finding, the authors highlight concern with body image, particularly among girls, commonly leading to the practice of restrictive diets without expert guidance, in which skipping meals is a common practice.21
Other studies indicate that skipping meals is also a more common phenomenon among adolescents than among children, which is justified by the common eating irregularity at that phase of development, either by adhering to restrictive diets without follow-up, or due to changes in their life styles, such as greater autonomy to make food choices, need for convenience, media influence, and preference for certain flavors.22,23 Skipping meals such as breakfast18 often occurs in this population group, or the replacement of main meals for snacks or quick meals.24
It is possible that the association found between excess weight and lower frequency of meals in female adolescents is due to reverse causality, considering that concerns with body weight are very common in this specific group, which can modify the behavior of some explanatory variables, such as the number of meals. This is a typical problem of cross-sectional studies, in which reverse causality can mask the effects of some investigated associations.25
The results suggest that efforts to increase the number of meals among children should prioritize families with lower income, as it is well established that food habits are subject to the purchasing power of households, which depend on the availability, quantity, and quality of consumed food. In this sense, schools have the potential to provide healthy and accessible meal options to students from families with lower incomes.
Among adolescents, it was found that the total number of children per household should be considered in determining meal standards. The presence of more children in the family increases the demand for food, compromising availability. According to Hoffmann, the food insecurity situation is positively affected by the presence of a higher number of individuals under 18 years and the number of individuals per household.26 Additionally, a higher number of children may also interfere in the mother's health care to these adolescents.
Even if the meal frequency has been recognized as a possible influence for excess weight, as observed among adolescents in this study, little is known about the involved mechanisms to date.10,12 It has been suggested that plasma glucose and insulin levels that remain relatively constant throughout the day, as a result of frequent small meals, promote better appetite control. Another hypothesis is that there is an increase of postprandial energy expenditure, with overall increased thermic effect of food with regular meal patterns.15
In this study, lower LDL serum levels were also associated with a higher frequency of meals in adolescents. It is believed that possible mechanisms are the lower mean concentrations in plasma insulin peaks and the smaller area under the curve for insulin responses with regular eating patterns,27 causing reduction of hepatic synthesis and activity of the enzyme 3-hydroxy-3-methylglutaryl coenzyme A reductase to occur. This enzyme acts by decreasing the secretion of lipoproteins containing apolipoprotein B and increasing the synthesis of hepatic LDL receptors, consequently decreasing their serum levels.28
Some studies have indicated that although a smaller number of meals is related to a lower daily energy intake, there may be an increase in caloric intake per meal, which is a strong indicator of deleterious metabolic profiles such as glucose intolerance and dyslipidemia.29 This may explain why the association between a higher frequency of meals and serum LDL levels can be observed even in individuals with normal weight.
In addition to the cross-sectional design, which prevents conclusions on causal associations, this study has as limitations the difficulty to standardize what would be defined as a meal and concomitant under-reporting of food intake and food frequency. This under-reporting has been widely acknowledged, and it is particularly evident in individuals with excess weight regarding the reporting of snacks compared with the main meals.30
In conclusion, this analysis indicated that the habit of having four or more meals a day is associated with demographic, socioeconomic, anthropometric, and biochemical factors. It was found that higher meals frequencies are more often observed in children when compared with adolescents, as well as in males compared to females; higher family income values and fewer children in the family also favor an increase in the frequency of meals in children and adolescents, respectively. Moreover, a higher number of meals can contribute to weight control and better serum LDL profile in adolescents.
FundingConselho Nacional de Desenvolvimento Científico e Tecnológico (CNPq), Fundação de Amparo à Pesquisa do Estado de Minas Gerais (FAPEMIG), and Universidade Federal de Juiz de Fora (UFJF).
Conflicts of interestThe authors declare no conflicts of interest.
To Conselho Nacional de Desenvolvimento Científico e Tecnológico (CNPq – 476016/2010-0), Fundação de Amparo à Pesquisa do Estado de Minas Gerais (FAPEMIG), and Universidade Federal de Juiz de Fora.
Please cite this article as: Silva FA, Candiá SM, Pequeno MS, Sartorelli DS, Mendes LL, Oliveira RM, et al. Daily meal frequency and associated variables in children and adolescents. J Pediatr (Rio J). 2017;93:79–86.
Study conducted at the Department of Nutrition, Instituto de Ciências Biológicas, Universidade Federal de Juiz de Fora (UFJF), Juiz de Fora, MG, Brazil


