This study aimed to evaluate the association of junk food consumption with hypertension and obesity in a national sample of Iranian children and adolescents.
MethodsThis nationwide study was conducted in 2011-2012 among 14,880 students, aged 6-18 years, selected by cluster sampling from 30 provinces. Weight, height, waist circumference (WC), hip circumference (HC), waist-to-hip ratio (WHR), waist-to-height ratio (WHtR), as well as systolic and diastolic blood pressure (BP) were measured. Junk food was divided into four categories, including salty snacks, sweets, sweetened beverages, and fast food. Subjects reported how many times they had consumed each item (daily, weekly, and seldom).
ResultsThe intake of sweets was significantly associated with anthropometric indices and BP levels. Moreover, a significant association was found between fast food consumption, BP levels, and anthropometric indices (except for WHtR and WHR). Sweet beverages consumption was significantly associated with anthropometric indices; however, the consumption of salty snacks was only significantly associated with height, HC, and WHR. The risk of general obesity (OR: 0.75, 95% CI: 0.65-0.87) and abdominal obesity (OR: 0.81, 95% CI: 0.72-0.92) among participants who seldom consumed sweets was less than those who consumed daily. Also, the risk of general obesity (OR: 0.85, 95% CI: 0.74-0.97) among students that seldom consumed sweetened beverages was less than subjects who consumed them on a daily basis.
ConclusionIt was found that junk food consumption increased the risk of both general and abdominal obesity; therefore, consumption of junk food should be reduced via restricting TV advertisements and increasing taxes on junk foods.
Este estudo pretende avaliar a associação entre o consumo de junk food e a hipertensão e obesidade em uma amostra nacional de crianças e adolescentes iranianos.
MétodosEste estudo nacional foi realizado entre 2011 e 2012 com 14.880 estudantes com 6-18 anos de idade, selecionados por amostra em bloco em 30 províncias. Foram medidos o peso, a estatura, a circunferência da cintura (CC), circunferência do quadril (CQ), razão cintura/quadril (RCQ), razão cintura/estatura (RCE) e a pressão arterial sistólica e diastólica (PAS e PAD). A junk food foi dividida em quatro categorias, incluindo lanches salgados, doces, bebidas açucaradas e fast food. Os indivíduos relataram quantas vezes consumiam cada um dos itens (diariamente, semanalmente, raramente).
ResultadosO consumo de doces foi associado significativamente aos índices antropométricos e níveis de PA. Além disso, havia uma associação significativa entre o consumo de fast food e os níveis de PA e índices antropométricos (exceto RCE e RCQ). O consumo de bebidas açucaradas foi associado significativamente aos índices antropométricos, porém o consumo de lanches salgados foi associado significativamente apenas à estatura, CQ e RCQ. O risco de obesidade geral (RC: 0,75, IC de 95%: 0,65-0,87) e obesidade abdominal (RC: 0,81, IC de 95%: 0,72-0,92) entre participantes que raramente consumiam doces era menor que naqueles que os consumiam diariamente. Além disso, o risco de obesidade geral (RC: 0,85; IC de 95%: 0,74-0,97) entre estudantes que raramente consumiam bebidas açucaradas era menor que entre indivíduos que os consumiam diariamente.
ConclusãoConstatamos que o consumo de junk food aumentou o risco de obesidade geral e abdominal; portanto, o consumo de junk food deve ser reduzido por meio da restrição de comerciais de TV e do aumento de impostos sobre esse tipo de alimento.
In recent decades, childhood obesity has become a worldwide concern. In the United States, nearly one-third of children and adolescents are overweight or obese.1 In addition, the prevalence of obesity in children in developing countries, including Iran, is increasing rapidly.2 In the third nationwide survey of the CASPIAN study, 17.7% of the students were overweight or obese (19.9% of boys and 15.5% of girls). Abdominal obesity also has been reported (16.3%).3 In addition, in childhood, obesity is a known risk factor for cardiovascular disease (including hypertension and coronary disease), type-2 diabetes, and certain types of cancer. Obese children are at increased risk of mortality and morbidity resulting from cardiovascular disease in adulthood.4 Increased sedentary activity, lack of regular physical activity, and poor eating habits, e.g., high intake of sweetened beverages, fast foods, and sweets, may lead to obesity.5
Only 25% of hypertensive cases are diagnosed and treated. Many studies have shown that hypertension may begin in adolescence or even in childhood.6 In children, the prevalence of hypertension is lower than adults. The prevalence of hypertension in the adult population of the United States and Europe has been estimated at 15-30%, while the prevalence in children is 3-5%.7 Physical inactivity, smoking, consumption of fast food, and sugar-sweetened beverages are associated with increased blood pressure.8
Low intake of nutrients and increased consumption of high-energy foods is known as junk food. It represents a significant proportion (15-40%) of total daily caloric intake of children and has been shown to be associated with overweight and obesity.9,10 These eating habits of children and adolescents are a concern of many researchers. A study has shown that increased consumption of snacks is associated with obesity and other chronic diseases among children and adolescents.11 The consumption of junk food as snacks is increasing among children. The prevalence of obesity has increased with a greater intake of processed carbohydrates (e.g. sugar, white flour, and saturated fats) in Western societies during past century.12 Majane et al. have demonstrated that consumption of a diet high in sugar and saturated fat compared to sugar-free and low-fat diet resulted in left ventricular dysfunction and hypertension.13 Experimental studies have shown that chronic hypertension and systolic and diastolic dysfunction can lead to heart failure.14
As a result of changing dietary patterns in recent decades, nutritious snacks are substituted by junk food. Television advertising, attractive packaging, and lack of parental awareness are the major cause of junk food consumption. These snacks contain high amounts of fat, salt, and sugar. Excess salt intake in childhood is associated with hypertension in adulthood.15 Since life style changes, weight disorders, and hypertension prevalence have increased rapidly due to epidemiological and nutritional transition in recent years in Iran, and because the effect of junk food consumption on these disorders in children and adolescents is not well documented, this study was designed to evaluate association between hypertension and obesity with junk food consumption in a representative national sample of Iranian children and adolescents.
Materials and MethodsStudy populationThis study was as fourth survey of Childhood and Adolescence Surveillance and Prevention of Adult Non-communicable Diseases, entitled CASPIAN-IV (2011-2012). This study was conducted on 13,486 children and adolescents 6-18 years who were selected through a multi-stage cluster sampling from 30 provinces of Iran (480 samples in each province). Methods are described in detail in previous study.16 After a full explanation of the study objectives and protocols, written informed consent and verbal consent was obtained from parents and students.
MeasurementsDemographic dataTrained health care providers collected the demographic characteristics, such as age, family size, socio-economic status, sedentary lifestyle, physical activity, as well as parent's occupation and education level.
MeasurementsWeight, height, waist circumference (WC), hip circumference (HC), waist-to-hip ratio (WHR), waist-to-height ratio (WHtR), and systolic and diastolic blood pressure (SBP and DBP) were measured by a trained researcher. Weight was measured with minimal clothing, with 0.1kg accuracy and standing height was recorded without shoes, with 0.1cm accuracy. WC was measured using a non-elastic tape on the distance around the smallest area below the rib cage and above the iliac crest at the end of normal expiration, to the nearest 0.1cm. The widest part of the buttocks was measured to obtain the hip circumference to the nearest 0.1cm. WHtR was calculated by dividing WC (incm) by height (incm). In this study, abdominal obesity was defined as WHtR more than 0.5.17 Body mass index (BMI) ≥ 95th percentile was considered as obesity.
BP was measured using a mercury sphygmomanometer on the right arm in a sitting position. It was measured twice at five-minute intervals, and the average was reported. BP was categorized into two groups: normal pressure (< 95th percentile) and hypertension (≥ 95th percentile).
Foods with a high content of sugar, salt, saturated fats and trans fats, and low content of nutrients were placed in the junk food group. Accordingly, junk food was categorized into four groups, including salty snacks (chips, cheese curls, popcorn, and pretzels), sweets (biscuits, cookies, cakes, chocolate, and candies), sweetened beverages (soda, soft drinks), and fast foods (hot dogs, hamburgers, cheeseburgers, fried chicken, and pizza). Junk food consumption was categorized into four groups: daily, weekly, seldom, and never. Subsequently, the groups of “seldom” and “never” were merged, and were considered as the seldom group. Subjects reported how many times they had consumed each item (daily, weekly, and seldom).
The physical activity (PA) of the participants was collected one week prior to the study, benefiting a valid questionnaire.18 Weekly frequency of PA outside the school of at least 30minutes per day was reported by children as the number of days which had caused heavy sweating or large increases in breathing or heart rate. For the sake of statistical analysis, each weekly frequency received a classification (0-2 days per week [mild], 3-5 days per week [moderate], 6-7 days [severe]).
Statistical analysisQualitative variables were reported as numbers and percentages, and quantitative variables were reported as mean±SD (standard deviation). The chi-squared test was used to analyze qualitative variables, and comparison of means of quantitative variables was investigated by Student's t-test and analysis of variance (ANOVA). To adjust the relationships for possible confounders, logistic regression analysis was conducted to evaluate the association of junk food with hypertension and anthropometric indices in four models, consisting of: Model I: crude model (without adjustment); Model II: adjusted for age and sex, and living area; Model III: additionally adjusted for family history of chronic disease, physical activity, screen time, and socioeconomic status; Model IV: additionally adjusted for BMI only for hypertension. In all models, the daily group was considered as the reference group. p-value of less than 0.05 was considered as statistically significant. All statistical analyses were conducted in Stata 2011, release 12 (Stata Corp - College Station, TX, USA), by using survey (cluster) analysis design.
Ethical considerationsAfter a complete explanation of the objectives and methods of the study, an informed consent was obtained from parents and students. The study protocol was reviewed and approved by the ethical committees and other relevant national regulatory organizations.
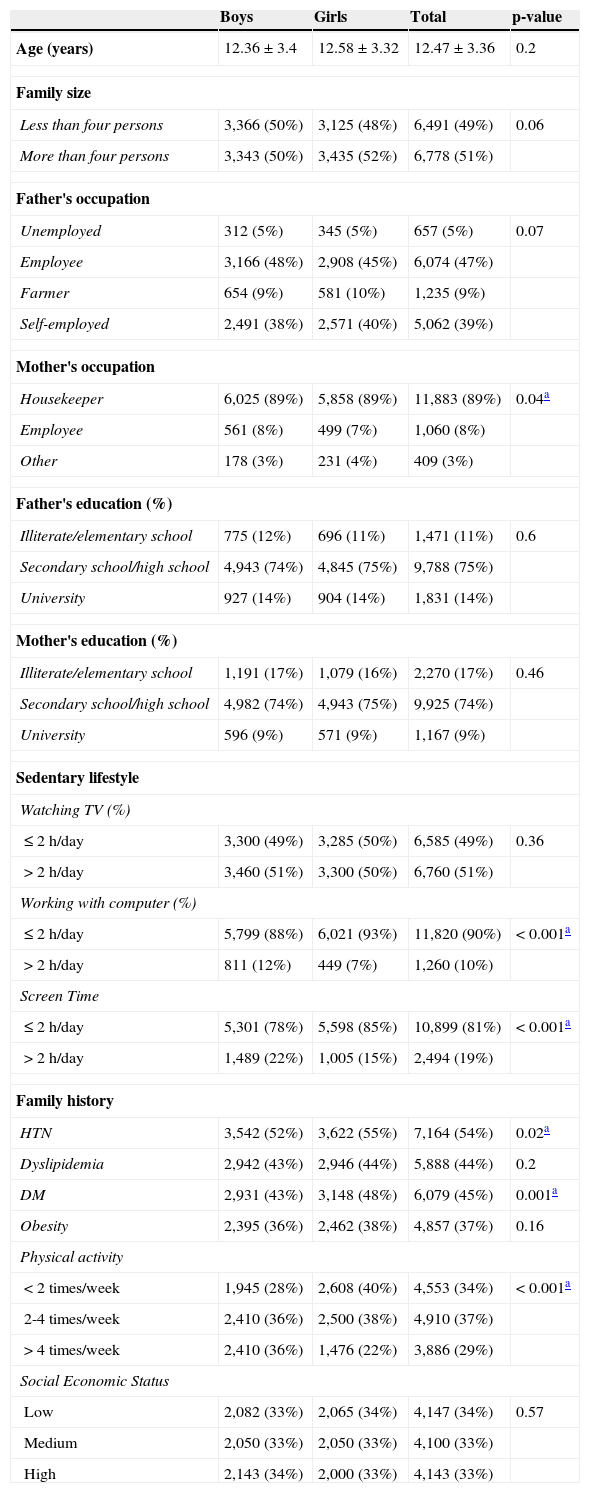
ResultsA total of 13,486 children and adolescents out of 14,880 invited subjects (participation rate of 90.6%) were evaluated in the current study. The average age of girls and boys was 12.58 (SD: 3.32) and 12.36 (SD: 3.39) years, respectively. Demographic characteristics of participants are shown in Table 1. As shown, physical activity levels were significantly higher in boys than girls (p-value<0.001). Screen time activity more than two hours per day in boys and girls was 22% and 15%, respectively, a significant difference between sexes.
Demographic characteristics of participants according to sex: the CASPIAN-IV Study.
| Boys | Girls | Total | p-value | |
|---|---|---|---|---|
| Age (years) | 12.36±3.4 | 12.58±3.32 | 12.47±3.36 | 0.2 |
| Family size | ||||
| Less than four persons | 3,366 (50%) | 3,125 (48%) | 6,491 (49%) | 0.06 |
| More than four persons | 3,343 (50%) | 3,435 (52%) | 6,778 (51%) | |
| Father's occupation | ||||
| Unemployed | 312 (5%) | 345 (5%) | 657 (5%) | 0.07 |
| Employee | 3,166 (48%) | 2,908 (45%) | 6,074 (47%) | |
| Farmer | 654 (9%) | 581 (10%) | 1,235 (9%) | |
| Self-employed | 2,491 (38%) | 2,571 (40%) | 5,062 (39%) | |
| Mother's occupation | ||||
| Housekeeper | 6,025 (89%) | 5,858 (89%) | 11,883 (89%) | 0.04a |
| Employee | 561 (8%) | 499 (7%) | 1,060 (8%) | |
| Other | 178 (3%) | 231 (4%) | 409 (3%) | |
| Father's education (%) | ||||
| Illiterate/elementary school | 775 (12%) | 696 (11%) | 1,471 (11%) | 0.6 |
| Secondary school/high school | 4,943 (74%) | 4,845 (75%) | 9,788 (75%) | |
| University | 927 (14%) | 904 (14%) | 1,831 (14%) | |
| Mother's education (%) | ||||
| Illiterate/elementary school | 1,191 (17%) | 1,079 (16%) | 2,270 (17%) | 0.46 |
| Secondary school/high school | 4,982 (74%) | 4,943 (75%) | 9,925 (74%) | |
| University | 596 (9%) | 571 (9%) | 1,167 (9%) | |
| Sedentary lifestyle | ||||
| Watching TV (%) | ||||
| ≤ 2h/day | 3,300 (49%) | 3,285 (50%) | 6,585 (49%) | 0.36 |
| > 2h/day | 3,460 (51%) | 3,300 (50%) | 6,760 (51%) | |
| Working with computer (%) | ||||
| ≤ 2h/day | 5,799 (88%) | 6,021 (93%) | 11,820 (90%) | < 0.001a |
| > 2h/day | 811 (12%) | 449 (7%) | 1,260 (10%) | |
| Screen Time | ||||
| ≤ 2h/day | 5,301 (78%) | 5,598 (85%) | 10,899 (81%) | < 0.001a |
| > 2h/day | 1,489 (22%) | 1,005 (15%) | 2,494 (19%) | |
| Family history | ||||
| HTN | 3,542 (52%) | 3,622 (55%) | 7,164 (54%) | 0.02a |
| Dyslipidemia | 2,942 (43%) | 2,946 (44%) | 5,888 (44%) | 0.2 |
| DM | 2,931 (43%) | 3,148 (48%) | 6,079 (45%) | 0.001a |
| Obesity | 2,395 (36%) | 2,462 (38%) | 4,857 (37%) | 0.16 |
| Physical activity | ||||
| < 2 times/week | 1,945 (28%) | 2,608 (40%) | 4,553 (34%) | < 0.001a |
| 2-4 times/week | 2,410 (36%) | 2,500 (38%) | 4,910 (37%) | |
| > 4 times/week | 2,410 (36%) | 1,476 (22%) | 3,886 (29%) | |
| Social Economic Status | ||||
| Low | 2,082 (33%) | 2,065 (34%) | 4,147 (34%) | 0.57 |
| Medium | 2,050 (33%) | 2,050 (33%) | 4,100 (33%) | |
| High | 2,143 (34%) | 2,000 (33%) | 4,143 (33%) | |
HTN, hypertension; DM, diabetes mellitus.
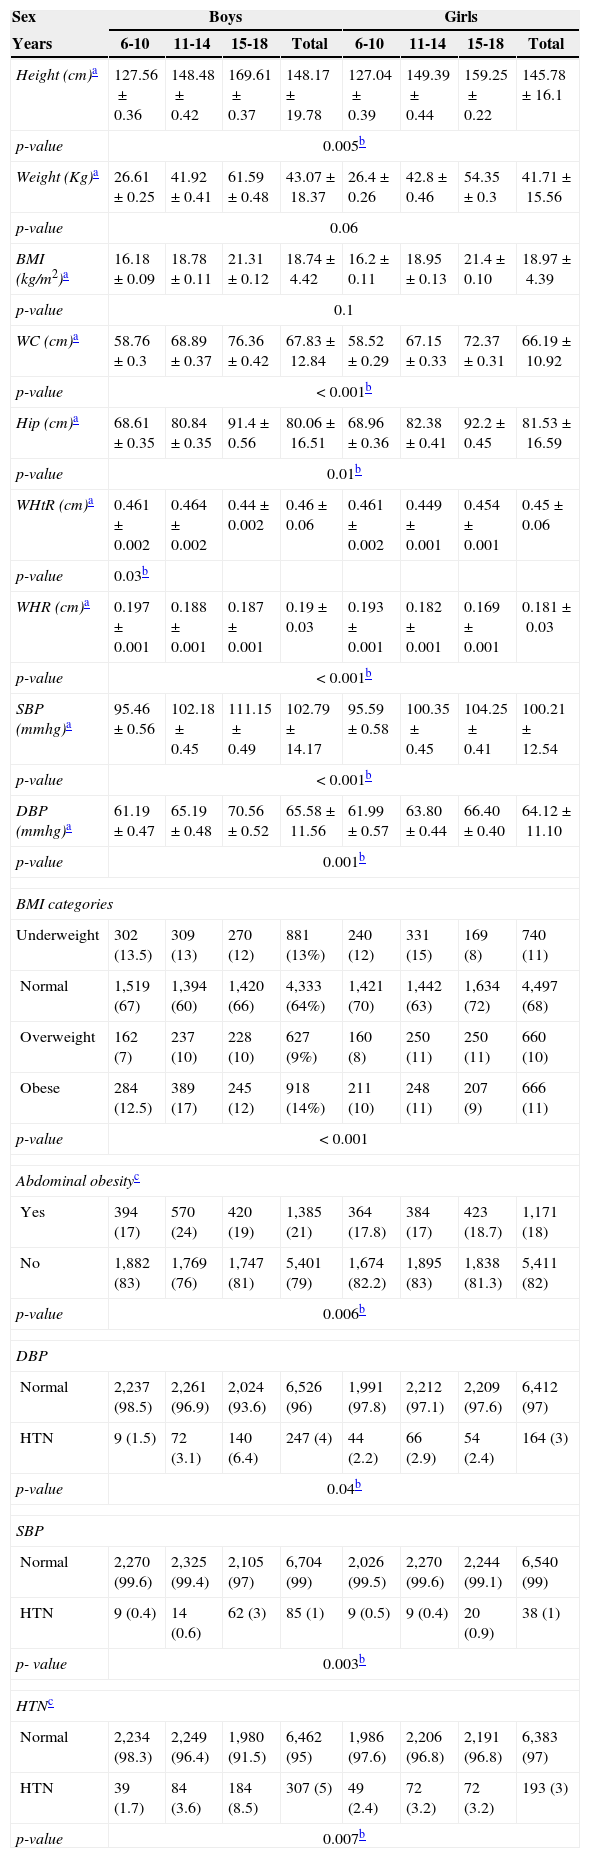
Mean and prevalence of various anthropometric and blood pressure measures are shown in Table 2. The average of height, WC, WHtR, WHR, SBP, and DBP were significantly higher in boys compared with girls. The percentage of overweight and obesity in girls were 11% and 10%, while in boys they were 14% and 9%, respectively. Also, the percentage of abdominal obesity among girls was larger than boys (p-value=0.006). Hypertension was reported in 5% of boys and in 3% of girls, which was a statistically significant difference (p-value=0.006).
Characteristics of participants according by sex and age groups: the CASPIAN-IV Study.
| Sex | Boys | Girls | ||||||
|---|---|---|---|---|---|---|---|---|
| Years | 6-10 | 11-14 | 15-18 | Total | 6-10 | 11-14 | 15-18 | Total |
| Height (cm)a | 127.56±0.36 | 148.48±0.42 | 169.61±0.37 | 148.17±19.78 | 127.04±0.39 | 149.39±0.44 | 159.25±0.22 | 145.78±16.1 |
| p-value | 0.005b | |||||||
| Weight (Kg)a | 26.61±0.25 | 41.92±0.41 | 61.59±0.48 | 43.07±18.37 | 26.4±0.26 | 42.8±0.46 | 54.35±0.3 | 41.71±15.56 |
| p-value | 0.06 | |||||||
| BMI (kg/m2)a | 16.18±0.09 | 18.78±0.11 | 21.31±0.12 | 18.74±4.42 | 16.2±0.11 | 18.95±0.13 | 21.4±0.10 | 18.97±4.39 |
| p-value | 0.1 | |||||||
| WC (cm)a | 58.76±0.3 | 68.89±0.37 | 76.36±0.42 | 67.83±12.84 | 58.52±0.29 | 67.15±0.33 | 72.37±0.31 | 66.19±10.92 |
| p-value | < 0.001b | |||||||
| Hip (cm)a | 68.61±0.35 | 80.84±0.35 | 91.4±0.56 | 80.06±16.51 | 68.96±0.36 | 82.38±0.41 | 92.2±0.45 | 81.53±16.59 |
| p-value | 0.01b | |||||||
| WHtR (cm)a | 0.461±0.002 | 0.464±0.002 | 0.44±0.002 | 0.46±0.06 | 0.461±0.002 | 0.449±0.001 | 0.454±0.001 | 0.45±0.06 |
| p-value | 0.03b | |||||||
| WHR (cm)a | 0.197±0.001 | 0.188±0.001 | 0.187±0.001 | 0.19±0.03 | 0.193±0.001 | 0.182±0.001 | 0.169±0.001 | 0.181±0.03 |
| p-value | < 0.001b | |||||||
| SBP (mmhg)a | 95.46±0.56 | 102.18±0.45 | 111.15±0.49 | 102.79±14.17 | 95.59±0.58 | 100.35±0.45 | 104.25±0.41 | 100.21±12.54 |
| p-value | < 0.001b | |||||||
| DBP (mmhg)a | 61.19±0.47 | 65.19±0.48 | 70.56±0.52 | 65.58±11.56 | 61.99±0.57 | 63.80±0.44 | 66.40±0.40 | 64.12±11.10 |
| p-value | 0.001b | |||||||
| BMI categories | ||||||||
| Underweight | 302 (13.5) | 309 (13) | 270 (12) | 881 (13%) | 240 (12) | 331 (15) | 169 (8) | 740 (11) |
| Normal | 1,519 (67) | 1,394 (60) | 1,420 (66) | 4,333 (64%) | 1,421 (70) | 1,442 (63) | 1,634 (72) | 4,497 (68) |
| Overweight | 162 (7) | 237 (10) | 228 (10) | 627 (9%) | 160 (8) | 250 (11) | 250 (11) | 660 (10) |
| Obese | 284 (12.5) | 389 (17) | 245 (12) | 918 (14%) | 211 (10) | 248 (11) | 207 (9) | 666 (11) |
| p-value | < 0.001 | |||||||
| Abdominal obesityc | ||||||||
| Yes | 394 (17) | 570 (24) | 420 (19) | 1,385 (21) | 364 (17.8) | 384 (17) | 423 (18.7) | 1,171 (18) |
| No | 1,882 (83) | 1,769 (76) | 1,747 (81) | 5,401 (79) | 1,674 (82.2) | 1,895 (83) | 1,838 (81.3) | 5,411 (82) |
| p-value | 0.006b | |||||||
| DBP | ||||||||
| Normal | 2,237 (98.5) | 2,261 (96.9) | 2,024 (93.6) | 6,526 (96) | 1,991 (97.8) | 2,212 (97.1) | 2,209 (97.6) | 6,412 (97) |
| HTN | 9 (1.5) | 72 (3.1) | 140 (6.4) | 247 (4) | 44 (2.2) | 66 (2.9) | 54 (2.4) | 164 (3) |
| p-value | 0.04b | |||||||
| SBP | ||||||||
| Normal | 2,270 (99.6) | 2,325 (99.4) | 2,105 (97) | 6,704 (99) | 2,026 (99.5) | 2,270 (99.6) | 2,244 (99.1) | 6,540 (99) |
| HTN | 9 (0.4) | 14 (0.6) | 62 (3) | 85 (1) | 9 (0.5) | 9 (0.4) | 20 (0.9) | 38 (1) |
| p- value | 0.003b | |||||||
| HTNc | ||||||||
| Normal | 2,234 (98.3) | 2,249 (96.4) | 1,980 (91.5) | 6,462 (95) | 1,986 (97.6) | 2,206 (96.8) | 2,191 (96.8) | 6,383 (97) |
| HTN | 39 (1.7) | 84 (3.6) | 184 (8.5) | 307 (5) | 49 (2.4) | 72 (3.2) | 72 (3.2) | 193 (3) |
| p-value | 0.007b | |||||||
BMI, body mass index; WC, waist circumference; WHtR, waist-to-height ratio; WHR, waist-to-hip ratio; SBP, systolic blood pressure; DBP, diastolic blood pressure; HTN, hypertension.
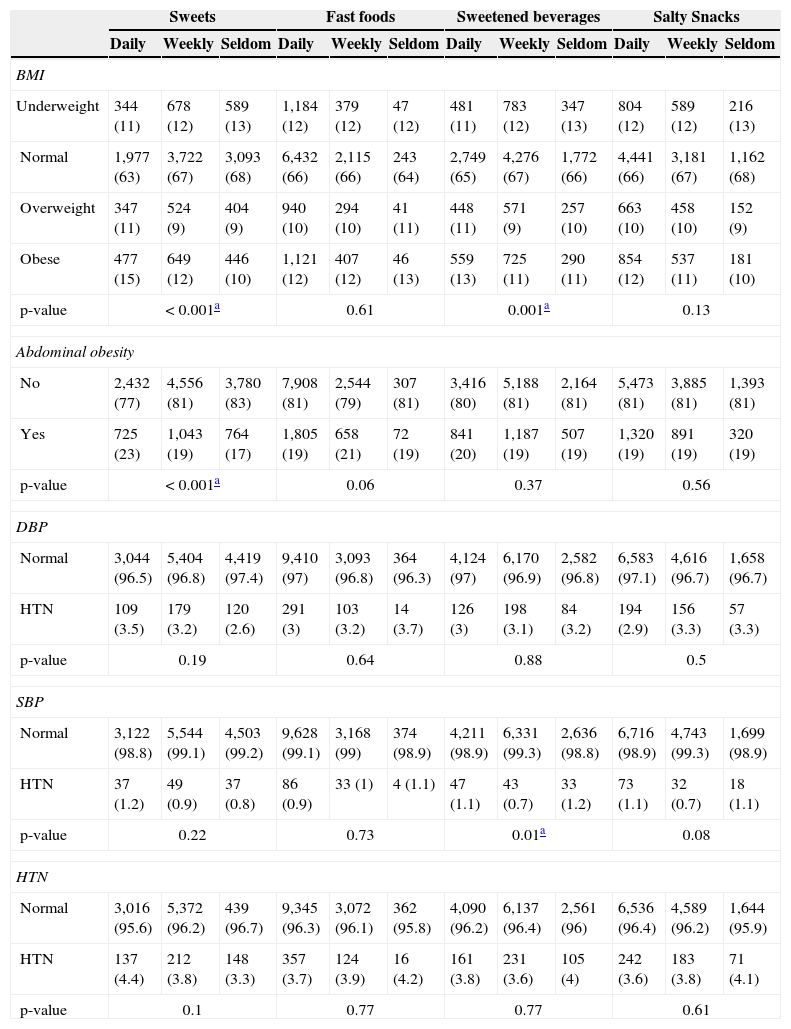
The association of junk food consumption with prevalence of general and abdominal obesity and hypertension is presented in Table 3. According to this table, there was no association between junk food consumption and hypertension. However, sweets consumption showed a significant association with obesity and abdominal obesity.
Association between blood pressure and junk foods: the CASPIAN-IV Study.
| Sweets | Fast foods | Sweetened beverages | Salty Snacks | |||||||||
|---|---|---|---|---|---|---|---|---|---|---|---|---|
| Daily | Weekly | Seldom | Daily | Weekly | Seldom | Daily | Weekly | Seldom | Daily | Weekly | Seldom | |
| BMI | ||||||||||||
| Underweight | 344 (11) | 678 (12) | 589 (13) | 1,184 (12) | 379 (12) | 47 (12) | 481 (11) | 783 (12) | 347 (13) | 804 (12) | 589 (12) | 216 (13) |
| Normal | 1,977 (63) | 3,722 (67) | 3,093 (68) | 6,432 (66) | 2,115 (66) | 243 (64) | 2,749 (65) | 4,276 (67) | 1,772 (66) | 4,441 (66) | 3,181 (67) | 1,162 (68) |
| Overweight | 347 (11) | 524 (9) | 404 (9) | 940 (10) | 294 (10) | 41 (11) | 448 (11) | 571 (9) | 257 (10) | 663 (10) | 458 (10) | 152 (9) |
| Obese | 477 (15) | 649 (12) | 446 (10) | 1,121 (12) | 407 (12) | 46 (13) | 559 (13) | 725 (11) | 290 (11) | 854 (12) | 537 (11) | 181 (10) |
| p-value | < 0.001a | 0.61 | 0.001a | 0.13 | ||||||||
| Abdominal obesity | ||||||||||||
| No | 2,432 (77) | 4,556 (81) | 3,780 (83) | 7,908 (81) | 2,544 (79) | 307 (81) | 3,416 (80) | 5,188 (81) | 2,164 (81) | 5,473 (81) | 3,885 (81) | 1,393 (81) |
| Yes | 725 (23) | 1,043 (19) | 764 (17) | 1,805 (19) | 658 (21) | 72 (19) | 841 (20) | 1,187 (19) | 507 (19) | 1,320 (19) | 891 (19) | 320 (19) |
| p-value | < 0.001a | 0.06 | 0.37 | 0.56 | ||||||||
| DBP | ||||||||||||
| Normal | 3,044 (96.5) | 5,404 (96.8) | 4,419 (97.4) | 9,410 (97) | 3,093 (96.8) | 364 (96.3) | 4,124 (97) | 6,170 (96.9) | 2,582 (96.8) | 6,583 (97.1) | 4,616 (96.7) | 1,658 (96.7) |
| HTN | 109 (3.5) | 179 (3.2) | 120 (2.6) | 291 (3) | 103 (3.2) | 14 (3.7) | 126 (3) | 198 (3.1) | 84 (3.2) | 194 (2.9) | 156 (3.3) | 57 (3.3) |
| p-value | 0.19 | 0.64 | 0.88 | 0.5 | ||||||||
| SBP | ||||||||||||
| Normal | 3,122 (98.8) | 5,544 (99.1) | 4,503 (99.2) | 9,628 (99.1) | 3,168 (99) | 374 (98.9) | 4,211 (98.9) | 6,331 (99.3) | 2,636 (98.8) | 6,716 (98.9) | 4,743 (99.3) | 1,699 (98.9) |
| HTN | 37 (1.2) | 49 (0.9) | 37 (0.8) | 86 (0.9) | 33 (1) | 4 (1.1) | 47 (1.1) | 43 (0.7) | 33 (1.2) | 73 (1.1) | 32 (0.7) | 18 (1.1) |
| p-value | 0.22 | 0.73 | 0.01a | 0.08 | ||||||||
| HTN | ||||||||||||
| Normal | 3,016 (95.6) | 5,372 (96.2) | 439 (96.7) | 9,345 (96.3) | 3,072 (96.1) | 362 (95.8) | 4,090 (96.2) | 6,137 (96.4) | 2,561 (96) | 6,536 (96.4) | 4,589 (96.2) | 1,644 (95.9) |
| HTN | 137 (4.4) | 212 (3.8) | 148 (3.3) | 357 (3.7) | 124 (3.9) | 16 (4.2) | 161 (3.8) | 231 (3.6) | 105 (4) | 242 (3.6) | 183 (3.8) | 71 (4.1) |
| p-value | 0.1 | 0.77 | 0.77 | 0.61 | ||||||||
Data are presented as n (%).
BMI, body mass index; SBP, systolic blood pressure; DBP, diastolic blood pressure; HTN, hypertension.
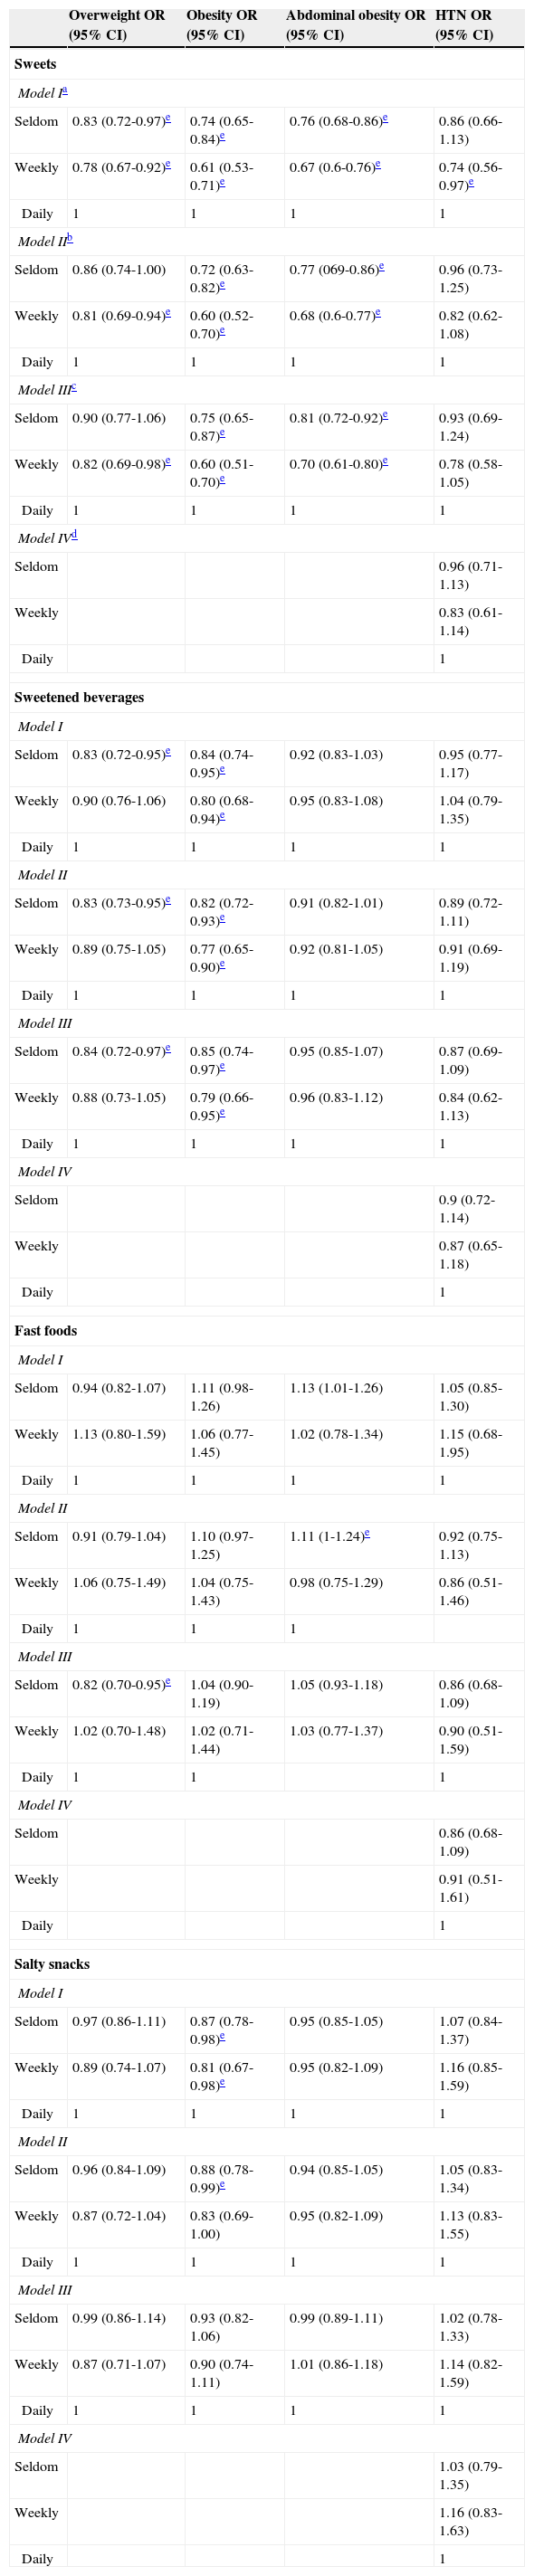
The odd ratios for blood pressure and general and abdominal obesity across junk food intake categories are presented in Table 4. In the multivariate model (model III), the risk of general obesity and abdominal obesity among subjects who seldom consumed sweets was approximately 25% (OR: 0.75, 95% CI: 0.65-0.87) and 19% (OR: 0.81, 95% CI: 0.72-0.92) less than subjects who consumed daily, respectively. Also, the risk of general obesity among students that seldom consumed sweetened beverages was approximately 15% (OR: 0.85, 95% CI: 0.74-0.97) less than subjects who consumed daily.
Odds ratios (CI 95%) for anthropometric indices and BP across junk food consumption: the CASPIAN-IV Study.
| Overweight OR (95% CI) | Obesity OR (95% CI) | Abdominal obesity OR (95% CI) | HTN OR (95% CI) | |
|---|---|---|---|---|
| Sweets | ||||
| Model Ia | ||||
| Seldom | 0.83 (0.72-0.97)e | 0.74 (0.65-0.84)e | 0.76 (0.68-0.86)e | 0.86 (0.66-1.13) |
| Weekly | 0.78 (0.67-0.92)e | 0.61 (0.53-0.71)e | 0.67 (0.6-0.76)e | 0.74 (0.56-0.97)e |
| Daily | 1 | 1 | 1 | 1 |
| Model IIb | ||||
| Seldom | 0.86 (0.74-1.00) | 0.72 (0.63-0.82)e | 0.77 (069-0.86)e | 0.96 (0.73-1.25) |
| Weekly | 0.81 (0.69-0.94)e | 0.60 (0.52-0.70)e | 0.68 (0.6-0.77)e | 0.82 (0.62-1.08) |
| Daily | 1 | 1 | 1 | 1 |
| Model IIIc | ||||
| Seldom | 0.90 (0.77-1.06) | 0.75 (0.65-0.87)e | 0.81 (0.72-0.92)e | 0.93 (0.69-1.24) |
| Weekly | 0.82 (0.69-0.98)e | 0.60 (0.51-0.70)e | 0.70 (0.61-0.80)e | 0.78 (0.58-1.05) |
| Daily | 1 | 1 | 1 | 1 |
| Model IVd | ||||
| Seldom | 0.96 (0.71-1.13) | |||
| Weekly | 0.83 (0.61-1.14) | |||
| Daily | 1 | |||
| Sweetened beverages | ||||
| Model I | ||||
| Seldom | 0.83 (0.72-0.95)e | 0.84 (0.74-0.95)e | 0.92 (0.83-1.03) | 0.95 (0.77-1.17) |
| Weekly | 0.90 (0.76-1.06) | 0.80 (0.68-0.94)e | 0.95 (0.83-1.08) | 1.04 (0.79-1.35) |
| Daily | 1 | 1 | 1 | 1 |
| Model II | ||||
| Seldom | 0.83 (0.73-0.95)e | 0.82 (0.72-0.93)e | 0.91 (0.82-1.01) | 0.89 (0.72-1.11) |
| Weekly | 0.89 (0.75-1.05) | 0.77 (0.65-0.90)e | 0.92 (0.81-1.05) | 0.91 (0.69-1.19) |
| Daily | 1 | 1 | 1 | 1 |
| Model III | ||||
| Seldom | 0.84 (0.72-0.97)e | 0.85 (0.74-0.97)e | 0.95 (0.85-1.07) | 0.87 (0.69-1.09) |
| Weekly | 0.88 (0.73-1.05) | 0.79 (0.66-0.95)e | 0.96 (0.83-1.12) | 0.84 (0.62-1.13) |
| Daily | 1 | 1 | 1 | 1 |
| Model IV | ||||
| Seldom | 0.9 (0.72-1.14) | |||
| Weekly | 0.87 (0.65-1.18) | |||
| Daily | 1 | |||
| Fast foods | ||||
| Model I | ||||
| Seldom | 0.94 (0.82-1.07) | 1.11 (0.98-1.26) | 1.13 (1.01-1.26) | 1.05 (0.85-1.30) |
| Weekly | 1.13 (0.80-1.59) | 1.06 (0.77-1.45) | 1.02 (0.78-1.34) | 1.15 (0.68-1.95) |
| Daily | 1 | 1 | 1 | 1 |
| Model II | ||||
| Seldom | 0.91 (0.79-1.04) | 1.10 (0.97-1.25) | 1.11 (1-1.24)e | 0.92 (0.75-1.13) |
| Weekly | 1.06 (0.75-1.49) | 1.04 (0.75-1.43) | 0.98 (0.75-1.29) | 0.86 (0.51-1.46) |
| Daily | 1 | 1 | 1 | |
| Model III | ||||
| Seldom | 0.82 (0.70-0.95)e | 1.04 (0.90-1.19) | 1.05 (0.93-1.18) | 0.86 (0.68-1.09) |
| Weekly | 1.02 (0.70-1.48) | 1.02 (0.71-1.44) | 1.03 (0.77-1.37) | 0.90 (0.51-1.59) |
| Daily | 1 | 1 | 1 | |
| Model IV | ||||
| Seldom | 0.86 (0.68-1.09) | |||
| Weekly | 0.91 (0.51-1.61) | |||
| Daily | 1 | |||
| Salty snacks | ||||
| Model I | ||||
| Seldom | 0.97 (0.86-1.11) | 0.87 (0.78-0.98)e | 0.95 (0.85-1.05) | 1.07 (0.84-1.37) |
| Weekly | 0.89 (0.74-1.07) | 0.81 (0.67-0.98)e | 0.95 (0.82-1.09) | 1.16 (0.85-1.59) |
| Daily | 1 | 1 | 1 | 1 |
| Model II | ||||
| Seldom | 0.96 (0.84-1.09) | 0.88 (0.78-0.99)e | 0.94 (0.85-1.05) | 1.05 (0.83-1.34) |
| Weekly | 0.87 (0.72-1.04) | 0.83 (0.69-1.00) | 0.95 (0.82-1.09) | 1.13 (0.83-1.55) |
| Daily | 1 | 1 | 1 | 1 |
| Model III | ||||
| Seldom | 0.99 (0.86-1.14) | 0.93 (0.82-1.06) | 0.99 (0.89-1.11) | 1.02 (0.78-1.33) |
| Weekly | 0.87 (0.71-1.07) | 0.90 (0.74-1.11) | 1.01 (0.86-1.18) | 1.14 (0.82-1.59) |
| Daily | 1 | 1 | 1 | 1 |
| Model IV | ||||
| Seldom | 1.03 (0.79-1.35) | |||
| Weekly | 1.16 (0.83-1.63) | |||
| Daily | 1 | |||
OR, odds ratio; CI, confidence interval.
This study showed significant association between consumption of sweets and both general and abdominal obesity. Moreover, daily consumption of sweets increased the risk of general and abdominal obesity. However, there was no significant association between sweets consumption and elevated BP. These findings are consistent with a longitudinal study with two years of follow-up, which showed a parallel finding with the result of the current study; a significant association was found between the intake of sweets and weight gain during two years of follow-up.19
In addition, there was a significant association between sweetened beverages consumption and general obesity. However, there was no significant association between the intake of sweetened beverages and hypertension. As reported by Zheng et al., there was a significant association between sweetened beverages and obesity.20 These results are similar to the findings of the present study. Also, Chen et al. concluded that decreased intake of sweetened beverages was significantly associated with reduced blood pressure.21
There was no significant association among junk foods (fast foods and salty snacks), obesity, and hypertension; despite the fact that many studies have shown that there is a significant association among general, abdominal obesity, and junk foods.20,22 Esmaillzadeh & Azadbakht showed that among of general, central obesity is inversely associated with healthy dietary pattern, while the Western dietary pattern (include refined grains, processed meats, sweets, desserts, pizza, fries potatoes, and soft drinks) was directly related to obesity.22 According to a study conducted on children, a significant association was not observed between consumption of junk foods and weight.15 In that study, the consumption of junk food in children with weight over the 95th percentile and below the 5th percentile was higher.15
As reported by Stanley et al., long-term consumption of junk foods accelerates the onset of heart failure.23 The high consumption of junk foods also can cause obesity.23 A community-based study showed that obesity is an independent risk factor for heart disease.24 There is also a strong relationship between obesity and hypertension.25 High consumption of junk foods may also cause the hypertension. However, the present study did not observe significant association between consumption of junk foods and hypertension. Khan et al. also did not observe a significant association between blood pressure and junk food.26
A study revealed that children who spent more time on watching TV usually consumed more calories (their diet contained more fat and soda and fewer fruits and/or vegetables).27 Some researchers believe that inclination toward unhealthy food increases during watching TV.
TV advertisements also have a significant effect on the consumption of foods containing fat, salt, and sugar. More than 80% of food advertisements during children's TV programs include junk foods.28 Restricting TV advertisements is a major way to reduce the choice of junk foods.
Another policy to reduce the consumption of junk food is to place taxes on unhealthy foods.29 Decreasing junk food consumption leads to a reduction in energy intake, which ultimately results in reduced weight changes.30
One of the main strengths of present study is a large national sample size. The other strength of this study is its consideration of socioeconomic status and physical activity, in order to reduce the effects of confounders.
The limitations of this study included its cross sectional design, and the possible recall bias in reporting dietary intakes.
In conclusion, consumption of sweets was associated with general obesity and central obesity in children and adolescents. Moreover, significant association existed between consumption of sweetened beverages and general obesity. However, the association of fast food and salty snack consumption with obesity and hypertension was not significant. It is suggested that the consumption of junk foods should be reduced by several methods, including restriction of TV advertisements and increased taxation of junk foods.
FundingThis study was conducted as a part of a national surveillance program funded by the Iranian Ministry of Health and Medical Education.
Conflicts of interestThe authors declare no conflicts of interest.
This nationwide survey was performed in Iran with cooperation of Ministry of Education and Training, the Ministry of Health and Medical Education, the Child Health Promotion Research Center, the Isfahan University of Medical Sciences; and the Endocrinology and Metabolism Research Center of Tehran University of Medical Sciences.
Please cite this article as: Payab M, Kelishadi R, Qorbani M, Motlagh ME, Ranjbar SH, Ardalan G, et al. Association of junk food consumption with high blood pressure and obesity in Iranian children and adolescents: the CASPIAN-IV Study. J Pediatr (Rio J). 2015;91:196–205.


