To evaluate the behavior of VCR and VCH, per municipality and per vaccines offered at the NVC, to identify priority areas for intervention.
MethodsDescriptive study of a time series, using secondary data and accompanied by a narrative review of the literature evaluating VCR and VCH. Vaccines offered to children under one year and to those aged one year in the pre-pandemic period of COVID-19 (2015 to 2019) were selected and compared to those offered during the pandemic period (2020 and 2021).
Results and discussionsThe decrease in VCR and VCH is a process that precedes the COVID-19 pandemic but was intensified during this period. In 2021, the VCR was around 70% for most vaccines. This phenomenon encompasses the entire country; however, it is more intense in the states/municipalities located in the north and northeast regions, suggesting greater difficulty in accessing health services.
ConclusionsLow and heterogeneous VCR requires the adoption of practices that were previously implemented, establishing partnerships with governmental and non-governmental institutions, with adequate communication, active search for non-compliance and non-adherence to the regular vaccination program, adopting intra- and extramural vaccination strategies, to reverse the current situation and reduce the risk of recurrence of diseases that have been already controlled and eliminated.
The National Immunization Program (PNI, Programa Nacional de Imunizações), coordinated by the Ministry of Health, jointly with the State (SES, Secretaria de Estado da Saúde) and Municipal (SMS, Secretaria Municipal da Saúde) Health Secretariats, has established itself as an efficient public policy by carrying out interventions at the national level, with an impact on the morbidity and mortality profile of the Brazilian population, in the last 49 years of its trajectory, adapting to the changes that occurred over time in the political, epidemiological and social fields.1
The National Vaccination Calendar (CNV, Calendário Nacional de Vacinação) offers children universal coverage of a total of 15 vaccines, of which nine are indicated in the first year of life and six in the second year of life, which constitutes the basic vaccination schedule.2
If the recommendations regarding the age for the child's vaccination are followed, as well as the simultaneity in the administration of vaccine doses in each visit to the vaccination centers, compliance with the basic vaccination schedule is attained at 15 months of life and required at least nine visits to the health service units, finishing the entire vaccination schedule at the tenth visit indicated at four years of age.2
In the 1970s, the vaccine-preventable diseases were endemic, with a high burden of morbidity and mortality, with approximately 100,000 cases of measles and 80,000 cases of pertussis, 10,000 cases of poliomyelitis and diphtheria being recorded. Based on the structuring and strengthening of vaccination actions throughout the country, guaranteeing universal access to all vaccines offered at the CNV, it was possible to reduce regional and social inequalities, making vaccination available to all Brazilians, in all locations, whether they were easy or difficult to access.3
The last case of poliomyelitis was recorded in 1989 and, in 1994, the country received the certification of disease eradication in the American continent. Although poliomyelitis is a distant memory in most parts of the world, the disease still exists in Pakistan and Afghanistan, associated with poliovirus type 1, and mainly affects children under five years old. The poliomyelitis virus causes irreversible paralysis (usually in the lower limbs) in every 200 infections. Among those with the paralytic form, 5% to 10% die.4 In 2015, the World Health Organization (WHO) declared the wild poliovirus type 2 to be eradicated, and in 2019, the poliovirus 3.5
Up to June 2022, there have been confirmed cases of polio by the wild poliovirus type 1 in Pakistan, Afghanistan, Malawi and Mozambique. Due to the low Vaccine Coverage Rates (VCR) in several countries, especially the ones that continue to use the oral poliomyelitis vaccine, cases of poliomyelitis derived from the vaccine have been recorded, jeopardizing the goal of global eradication of the disease.5
Measles is a highly contagious viral disease and remains a major cause of death in children worldwide, despite the availability of a safe and effective vaccine. Vaccination actions have dramatically reduced deaths caused by measles, with a 73% decrease between 2000 and 2018 worldwide.6
Pneumococcal disease, in its various clinical forms, represents an important cause of morbidity and mortality. The WHO estimates that one million deaths occur per year caused by invasive pneumococcal disease, most of them in children under five years of age.7,8 Among children who survive an episode of pneumococcal meningitis, a significant proportion is affected by long-term impairments, such as hearing loss, language disorders, intellectual disability, motor abnormalities, and visual disturbances.8
Since the introduction of the 10-valent pneumococcal conjugate vaccine (PCV10) in the CNV in the Americas, a significant reduction in all disease outcomes has been observed. In a systematic review that evaluated the effectiveness and impact of vaccination in the countries of the region, reductions of 8.8 to 37.8% were observed for hospitalizations due to radiologically confirmed pneumonia; of 7.4 to 20.6% due to clinical pneumonia; 13.3 to 87.7% for hospitalizations due to meningitis and of 56 to 83.3% for hospitalizations due to invasive pneumococcal disease (IPD), varying by age, the definition of clinical outcome, type of vaccine used (PCV10 vs. PCV13) and study design.9
Regarding the diseases protected by vaccines containing DTP components – diphtheria, tetanus and pertussis – there was a significant decrease in annual incidences. As the VCR increased, diphtheria cases decreased from 0.45/100,000 inhabitants in 1990 to less than 5 cases per year from 2016 onwards, and only one case was confirmed in 2021 (Table 1).
Number of cases and incidence coefficientsa of vaccine-preventable diseases per type of disease and year, Brazil, 1982 and 2021.
Source: data extracted from the Notifiable Diseases Information System (http://portalsinan.saude.gov.br/dados-epidemiologicos-sinan, accessed on August/12/2022).
The incidence of pertussis has also shown an important reduction, decreasing from 10.6 cases/100,000 inhabitants in 1990 to 0.9 cases/100,000 inhabitants in 2000. As of 2011, there was an increase in incidence rates, reaching 4.2 cases /100,000 inhabitants in 2014, and a further decrease from that year onwards, coinciding with the implementation of the triple acellular vaccine (diphtheria, tetanus and acellular pertussis) for pregnant women. This strategy aimed at inducing the production of high antibody titers against pertussis in pregnant women, allowing the transplacental transfer of these antibodies to the fetus.10 In 2016, 1,334 cases were confirmed and in 2021 only 130 cases (Table 1).
The role that immunization plays in improving the quality of life of the population is unquestionable, as the high vaccination coverage achieved in the national context has had a strong impact on the morbidity and mortality profile of vaccine-preventable diseases in the country. These results are attributed to the success of the PNI, part of the Brazilian Unified Health System (SUS, Sistema Único de Saúde), which throughout its existence acquired the trust of the population by adhering to both routine and campaign actions, in addition to its acknowledged importance due to its dynamism, incorporating new products to the CNV, particularly as of the second half of the 2000s.
However, if in the past the country made progress in achieving good results in immunization to the point of having an impact on the occurrence of diseases with a high incidence in childhood, mainly, the most recent VCR data showed that in recent years it has progressively decreased, more markedly as of 2016. This situation was aggravated in 2020 and 2021, coinciding with the occurrence of the Covid-19 pandemic, which brought important changes to the routines of the population and health services, impacting vaccination, such as the recommendation of social isolation with the aim of attenuating the risks of the disease transmission, thus limiting visits to vaccination units.
For these achievements to be maintained, it is necessary that surveillance and immunization actions be carried out adequately, meeting the goals established by the Ministry of Health. Two indicators are monitored by the PNI to identify areas at risk of reintroduction of vaccine-preventable diseases if these goals are not met, namely: VCR and vaccine coverage homogeneity (VCH).
Aiming at evaluating the behavior of VCR and VCH, per municipalities and the vaccines offered to children under one year of age and those aged one year, an attempt was made to compare the periods before and during the Covid-19 pandemic, aiming to identify the priority areas for intervention.
MethodsThe vaccination schedule for children under one year of age includes eight vaccines: BCG, Hepatitis B ≤ 30 days, meningococcal C conjugate vaccine (meningo C), 10-valent pneumococcal conjugate vaccine (PCV10), monovalent human rotavirus (RV1), poliomyelitis (IPV), pentavalent (penta - DTP/HB/Hib) and Yellow Fever (YF). The Influenza vaccine is also offered in the National Flu Vaccination Campaign, totaling nine offered vaccines.
A descriptive time series analysis was carried out, using secondary data and accompanied by a narrative review of the literature on the behavior of the vaccination performance indicators - VCR and VCH - per municipalities and by the vaccines indicated in the CNV for this target group, in the pre-pandemic period of Covid-19 (2015 to 2019), comparing data from the pandemic period (2020 and 2021).
To calculate the VCR, the vaccine schedule of those vaccinated in the public vaccination service that received the rotavirus, penta, poliomyelitis, meningo C and PCV10 vaccines, had the doses of vaccines that contain similar components offered by private vaccination services accounted for: rotavirus, pentavalent, hexavalent (DTP/HB/Hib/IPV), acellular pentavalent (DTP/Hib/IPV), ACWY meningococcal and 13-valent pneumococcal, provided that the private vaccination clinics are registered in the National Immunization Program Information System (SIPNI, Sistema de Informação do Programa Nacional de Imunizações) and are correctly transmitting vaccination data.
The VCR of the years in the period from 2015 to 2019 was evaluated and the increment (percentage of increase or decrease) and the difference in percentage points in the year 2019 compared to the year 2015 (pre-pandemic) were estimated. Then, the same calculation was applied for the years 2020, a pandemic year, in relation to the year 2019; and for the year 2021, the year in which the vaccination campaign against Covid-19 was implemented, in relation to the year 2020.
For the same period, the increment was estimated by dividing the later coverage by the earlier one, multiplying by 100, and subtracting from 100 (later VCR/earlier VCR *100-100). The difference in VCR in percentage points was measured by subtracting the previous VC from the subsequent one, year by year, in the same period.
The parameters established by the PNI for VC were used as the basis for the analysis: 90% for BCG and rotavirus vaccines and 95% for the other vaccines. The numerator for calculating the VCR comprises the total number of doses that complete the vaccination schedule (BCG - single dose; YF - initial dose; HepB - dose ≤30 days; meningo C and PCV10 and rotavirus second dose; IPV and penta-third dose). The denominator was the number of births that occurred in the respective year, obtained from the National System of Live Births (SINASC, Sistema Nacional de Nascidos Vivos), multiplying it by 100. The VC reports available on the DATASUS website were used.
The VCH was estimated per municipality, year by year in the period from 2015 to 2021, using the total number of Brazilian municipalities with adequate VCR (attained target) for each vaccine in the numerator and the total number of municipalities in the denominator, multiplying it by 100.
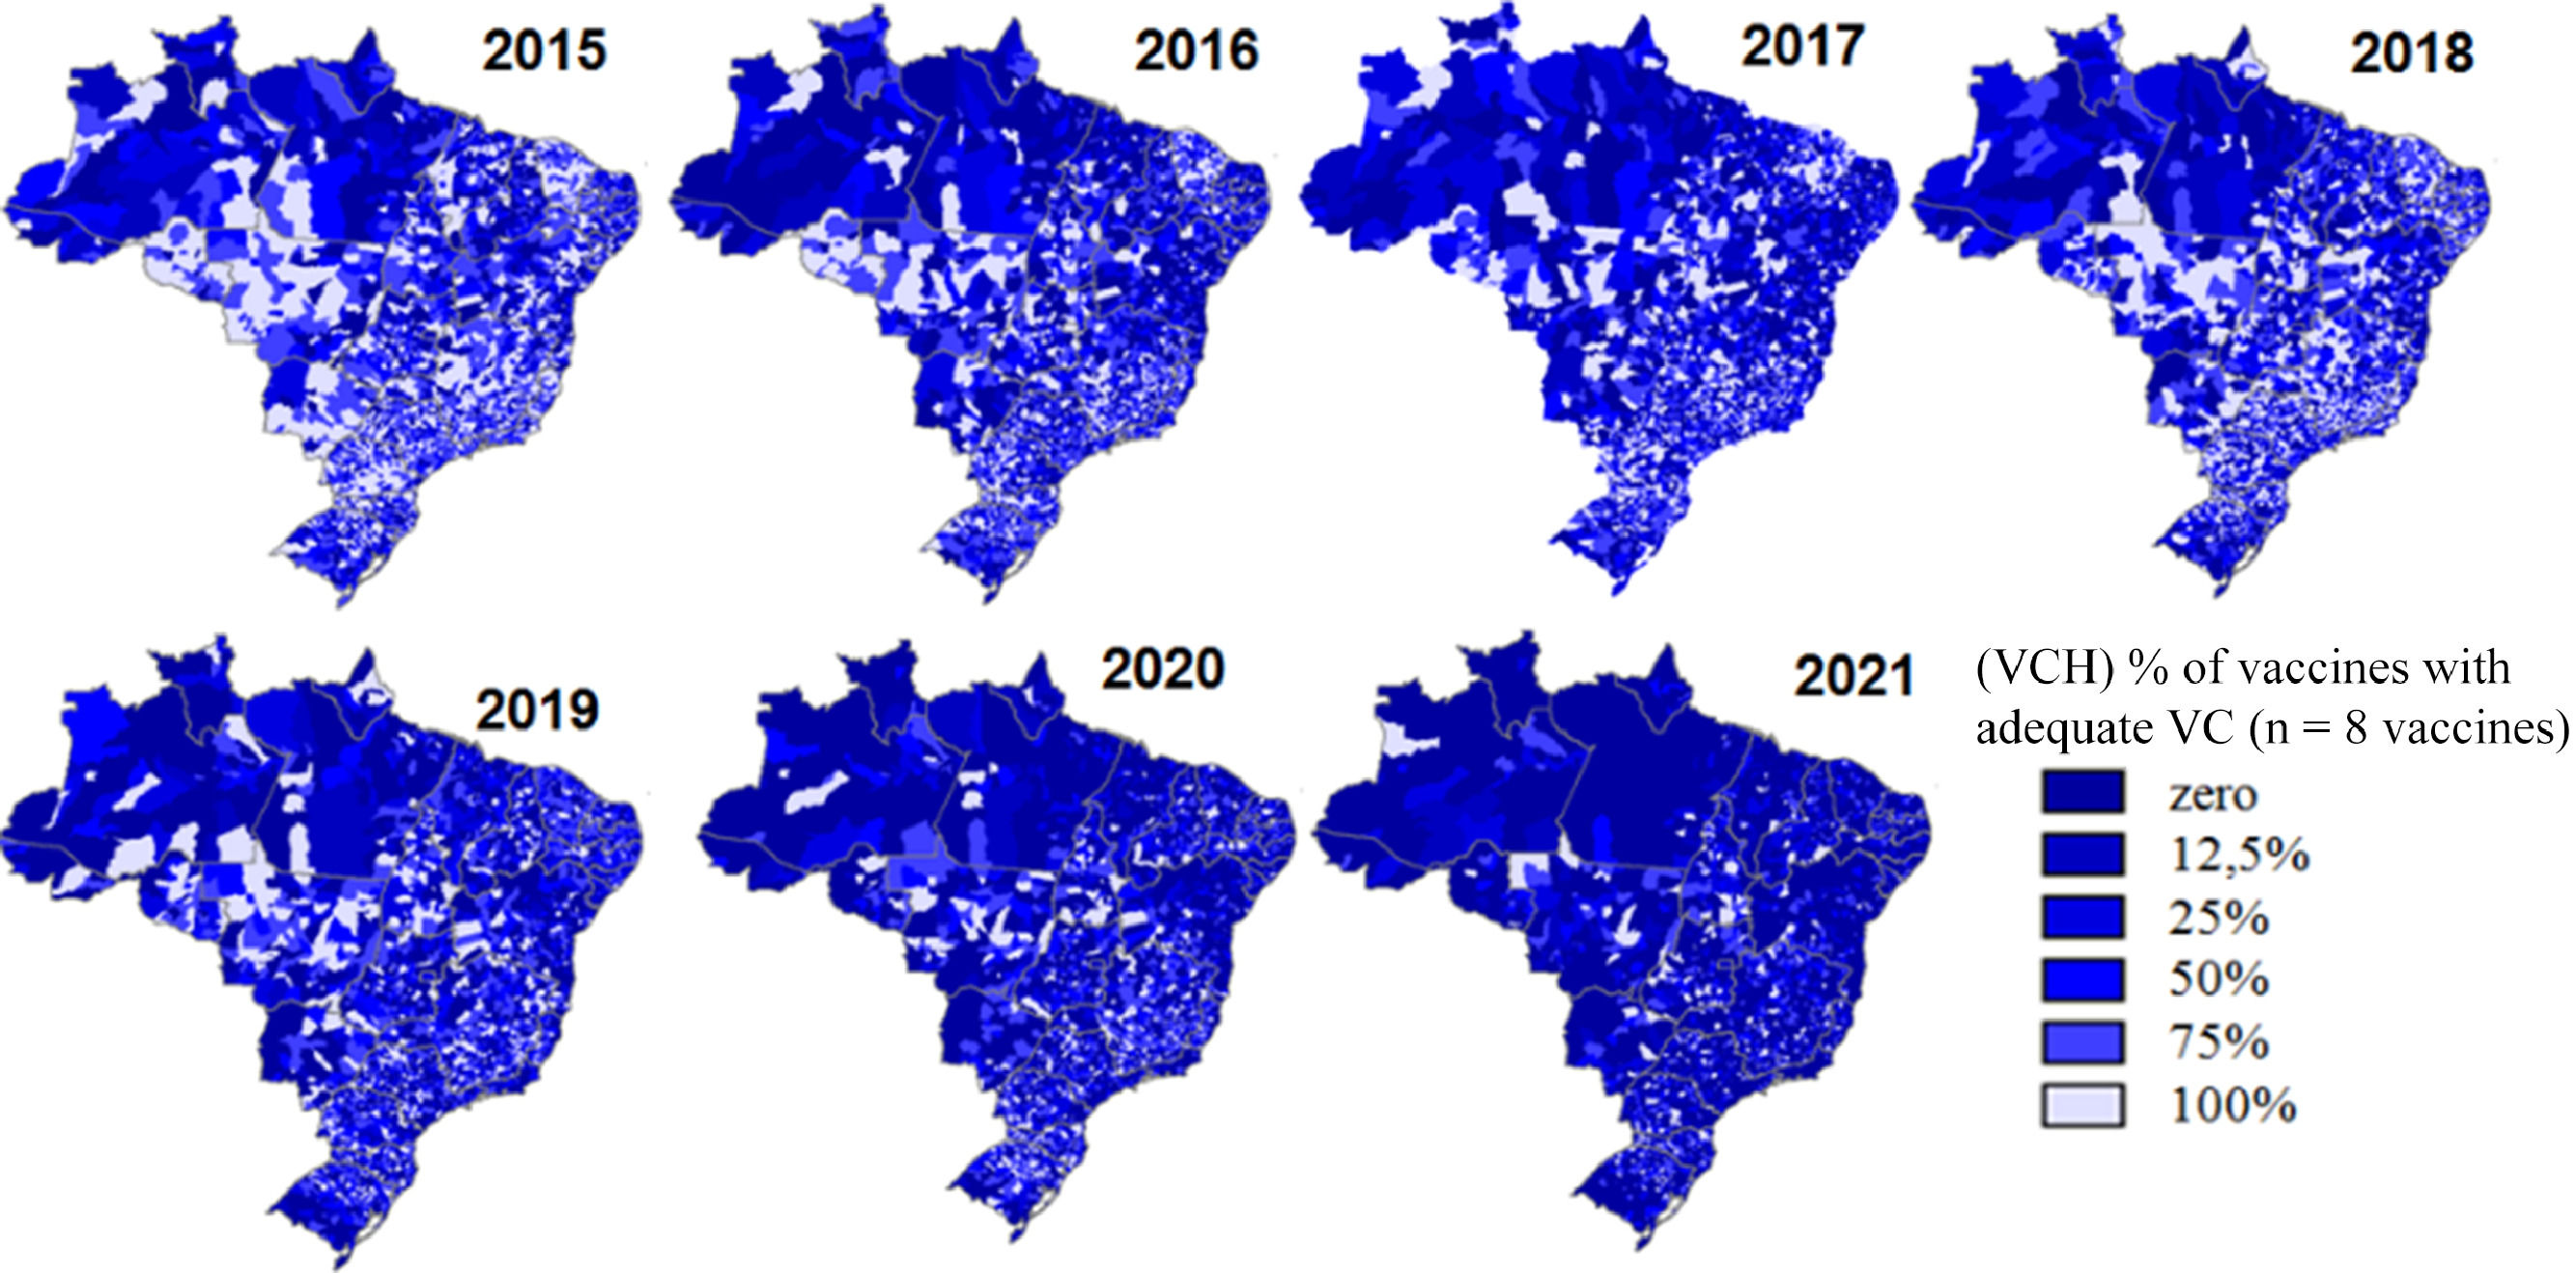
The VCH between vaccines was estimated using the total number of vaccines with achieved VCR in the numerator and the total number of vaccines (eight) that make up the vaccination schedule for children under one year of age in the denominator, multiplying by 100, using the strata in percentages (%) of zero, 12.5, 25, 50, 75 and 100% with adequate VCR, according to the possible percentage of vaccines with adequate coverage (zero to eight vaccines).
The analysis comprised the national, state and municipal contexts. The VCR of each vaccine within the municipalities was stratified and depicted as maps in the VC strata <80%;80<95% and ≥95%. The VC strata <80%, 80<90% and ≥90% were defined for the BCG and rotavirus vaccines. The VCH between vaccines was estimated by FU and municipalities and the proportional distribution of municipalities according to the percentage of vaccines with adequate VCR.
The data for the analysis were extracted from the SIPNI, on 07/11, 07/12 and 07/13 in 2021, with no change in values in the period, which were available on the website of the Department of Informatics of the Unified Health System (DATASUS), at http://sipni.datasus.gov.br (tabnetBD), of public domain. These are secondary data, tabulated and grouped per vaccine and by year, consolidated by national, state and municipal instances. They are depicted in the document as tables, graphs, using the Microsoft Office Excel application, version 8, or maps were built using the data tabulation tool developed by DATASUS, Tabwin415, of free access.
Data on the incidence of vaccine-preventable diseases were obtained from the Department of Immunizations and Vaccine-preventable Diseases/General Coordination of the National Immunization Program - Health Surveillance Secretariat - Ministry of Health (DEIDT CGPNI/ /SVS/MS -Departamento de Imunizações e Doenças Imunopreveníveis/Coordenação Geral do Programa Nacional de Imunizações - Secretaria de Vigilância em Saúde - Ministério da Saúde) and extracted from the Notifiable Diseases Information System (SINAN) (http://portalsinan.saude.gov.br/dados-epidemiologicos-sinan, accessed on 08 /03/2022).
Results and discussionsData available on VCR since 1980 showed that, until the mid-1990s, in Brazil, vaccine coverage in the child calendar, at the time Bacillus Calmette Guérin - BCG; bacterial triple vaccine (diphtheria, tetanus and pertussis - DTP); measles and oral poliomyelitis; were below the targets established by the PNI. However, in the middle of the same decade, there was a significant increase in vaccination rates, remaining, as a rule, high until the mid-2010s, then progressively decreasing.11
Coinciding with the decrease in VCR for the group of CNV vaccines, expanded over the years, followed by the replacement of the aggregated data record by the nominal record with the implementation of the SIPNI, which was intensified as of 2015, and the replacement by the Primary Health Information System (Sistema de Informação da Primária a Saúde) e-SUS APS, which was completed in January 2020 in the country.12
Although the vaccination data were collected individually in the vaccination unit, the registration in the system occurred in an aggregate manner and by place of vaccination, thus compromising, in part, the data analysis; for instance, municipalities with a high VCR did not necessarily have its population adequately vaccinated, but it was due to the vaccination of children who lived in other locations.12
The implementation of the individualized registry and by the origin of the vaccinated individual is aimed at reducing estimation errors and, particularly, at reducing possible duplication of records, monitoring the individual situation, and enabling the analysis of performance vaccination indicators closer to reality, although it does not eliminate data quality problems, such as record errors.12
The decrease in VCR and VCH since then has been attributed to the inadequate integration of databases, and more recently to the effects of the Covid-19 pandemic that caused an overload for immunization services.
However, the resurgence of diseases, such as measles that preceded the pandemic, demonstrated the existence of accumulated susceptible individuals due to heterogeneous VCR over the years, who were capable of becoming ill in the presence of the infectious agent.
In 2016, the Americas received the measles elimination certification from the Pan-American Health Organization (PAHO). However, due to the low VCR related to the triple viral vaccine (measles, rubella and mumps), there was an accumulation of susceptible individuals and a resurgence of measles circulation in Brazil in 2018. After more than two years of sustained transmission, Brazil lost the title of free of autochthonous virus circulation area.13
Between 2018 and 2020, 39,695 measles cases were confirmed. In 2020, a total of 9 countries in the Summit of the Americas reported measles cases and deaths.14,15
It is important to note that the reduction in the VCR in recent years is multifactorial. It is necessary to understand which factors are contributing to this decrease, highlighting the lack of knowledge about the importance of vaccination, vaccine hesitation, fake news published especially on social networks about the harm that vaccines can cause to one's health, the partial shortage of some products, operational problems in carrying out the vaccination, ranging from inadequate data recording to difficult access to the health unit. Understanding these factors is extremely important to seek new paths, aiming to re-establish the high VCR achieved until a few years ago.16,17
As a result of the decrease in the circulation of several vaccine-preventable diseases, prevention is placed in the background, often believed to be unnecessary. As of 2012, the WHO, reaffirming the importance of this issue and its implications, seeks to understand this phenomenon aiming to gather evidence for the development of public health interventions and, thus, revert this situation. Vaccine hesitation was defined as a delay in carrying out the vaccination schedule or refusal to receive the recommended vaccines, despite their availability in health services.18
These are, therefore, complex issues, as they involve cultural, social and economic aspects and vary over time, location and types of vaccines being used in the different vaccination programs. It should be understood as a continuous process that permeates from hesitant individuals who accept only a few vaccines and others who deliberately delay the vaccines, not accepting the recommended vaccination schedule, to those who refuse to vaccinate, regardless of the immunobiologicals being offered.18 In 2019, the WHO considered “vaccine hesitation” as one of the ten biggest global health threats.19
The insufficient structure of the vaccination network to meet the demand, with the distribution of numbers and limited hours to serve the population; lack of human or material resources, and partial shortage of immunobiologicals, especially for vaccines in the child calendar, has contributed to the decrease in access to vaccination in Brazil.20 Together with the misleading perception of parents that, due to the low risk of illness, it is no longer necessary to vaccinate their children, the lack of knowledge of which vaccines constitute the children's vaccination schedule, the fear that vaccines will cause adverse reactions or overload the children's immune system and the anti-vaccination movement that is growing in the country, although apparently not yet as significant, are reasons for the current scenario of the decrease in VCR.17,21
The VCR in Brazil, regarding the eight vaccines that comprise the vaccination schedule for children under one year of age, has shown important variations in its results, with a decrease in rates from 2015 to 2021, with a slight increase in rates for all vaccines in 2018. In that year, there was an intense mobilization of all sectors of SUS, in an attempt to rescue the VCR. However, these actions did not continue in 2019, and all vaccines had their VCR below the target (Table 2).
Vaccination coverage, increment of coverage and homogeneity of coverage between vaccines at <1 year of age and 1 year of age per type of vaccines and year, Brazil, 2015 to 2021*.
Source: sipni.datasus.gov, preliminary data from 2020 and 2021, accessed on 07/11/2022.
Highlight in bold for VC < target and negative values for percentage decrease in VCR comparing the Covid-19 pre-pandemic and pandemic periods.
In the pre-pandemic period, when comparing the year 2015 with 2019 for YF alone, a 34% increase in the VCR was identified, probably attributed to the increase in the use of this vaccine in geographic areas that were not considered as recommended for YF vaccination.
The worst performance was observed for the penta vaccine, which showed a 26.5% decrease. In 2019, there was a significant shortage in the second semester, certainly contributing to this decrease.
Historically, the VCR of the BCG vaccine has been high, surpassing the rate of 100% of children under one year of age. However, as of 2016 it also began to show a decline, albeit remaining above the target of 90% until the year 2018. The increment in the VCR was negative, with a 17.5% decrease. For the other vaccines, the decrease was between 5.5% for PCV10 and 14.3% for IPV (Table 2).
The situation worsened in the pandemic period (2020 - 2021), with a decrease for almost all VCRs of around 8%, with the exception of hepatitis B≤30 days, which was 3.2% and YF, which showed a small increase (0.7%) (Table 2). The VCH between vaccines for the same period decreased from 62.5% to “zero” and since 2019, no vaccine has reached the VC target established by the PNI in the national context (Table 2).
Considering the simultaneity of vaccination schedules, variations were observed between them that indicate a missed opportunity for vaccination during the child's visit to the health service. For vaccines with simultaneous two-dose schedules – rotavirus and PCV10 – there were differences in coverage that varied from 1 percentage point higher for rotavirus in 2015 to 7 percentage points higher for PCV10. In general, they were higher for PCV10, indicating a delayed full vaccine schedule when the child has already lost the opportunity to receive the second dose of the rotavirus vaccine, given the restriction on the administration of the second dose of this vaccine as of 8 months of life (Table 2).
In relation to the penta and IPV vaccines, simultaneous three-dose schedule vaccines, the year-by-year difference in coverage was lower compared to the VCR of the two-dose vaccines and, in general, they were higher for the penta vaccine. A marked difference was observed in 2019, between the VCR of these vaccines, being around 14% higher for IPV (Table 2).
For vaccines administered as of one year of age in the pre-pandemic period, there was an increase only for the triple viral vaccine (measles, rubella and mumps) (2%); however, it did not reach the recommended target, with the decrease ranging from 2.4% for meningo C booster dose up to 33.5% for DTP booster dose. There was a decrease in all vaccines during the pandemic period (Table 2).
Homogeneity of vaccination coverage between vaccines by Federation UnitThe VCH between vaccines per Federation Unit (FU) over the analyzed years showed a reduction in the number of vaccines with adequate VC in each FU. In 2015, only 10 of the 27 FUs achieved adequate VC for at least 75% of the eight vaccines. In the year 2021, except for Amapá and the Federal District (Distrito Federal, DF), which reached the VC goal for 01 of the 8 vaccines (12.5%) offered to children under one year of age, the VCH was zero percent in the other FUs (Table 3).
VCH between vaccinesa in the child calendar in children under one year of age, per Federation Unit, Brazil, 2015 to 2021.
Available data for the 5,570 municipalities showed that the proportion of these municipalities with adequate VC was below 70% (target) of them throughout the analyzed historical series (2015 to 2021), except for the rotavirus vaccine in the year 2015. It ranged from 54.9% to 21.3% in the years 2015 and 2021 for the BCG vaccine and the percentage of municipalities with adequate VC for the hepatitis B vaccine decreased by around 50% year by year when compared to BCG, despite the simultaneous recommendation (Table 4).
VCH per municipalitya according to the type of vaccines in the child calendar of children under one year of age and aged one year, Brazil, 2015 and 2021.
The penta and IPV vaccines in 2015 showed 61.6% and 64% of municipalities with adequate VCR. In 2019, following the same order, 39.8% and 22.4% of the municipalities reached the coverage target. The biggest difference in 2019 for the penta vaccine can be explained by penta shortages. However, in 2020, while 41.5% of the municipalities reached the penta goal, only 37.6% reached it for poliomyelitis, reiterating the loss of opportunity for vaccination, given that there was no shortage of the polio vaccine.
In 2021, when almost all efforts were focused on meeting the demand imposed by the vaccination campaign against Covid-19, the VCH was below 30% of municipalities for all vaccines, in a process that proved to be progressive during that period. The VCH between the vaccines in the municipalities decreased considerably, similar to what was observed in relation to the FUs. There was a progressively greater concentration of darker blue on the maps, reflecting a smaller number of municipalities with more vaccines with adequate coverage, being accentuated in the pandemic period of Covid-19 (2020 and 2021) and more frequent in the states of the north and northeast regions (Figure 1).

The distribution of municipalities according to the number of vaccines with adequate VC showed that in the seven years of the historical series, municipalities that did not attain the vaccination target (zero%) were proportionally more frequent.
In general, the VCR maintains a common characteristic, showing extreme values for any vaccine and target group. These atypical extreme values are common in municipalities with small populations (fewer than 100 children), where data quality is more compromised, as any variation in the birth rate and/or registration of an applied dose alters the behavior of target indicator achievement, with a VCR much above 100%.
Considering that the VCH indicator includes in the numerator all vaccines that reached the target, regardless of overestimated values due to underestimation of the denominators or overnumbering of the numerator for the calculation of the VCR, in a way it places limitations on the VCH indicator, whether for each vaccine in the context of the municipalities (homogeneity between municipalities for each vaccine), or for the group of vaccines in each municipality.
Based on the year 2021, for the BCG vaccine given at birth, the variation in the VCR ranged from zero (61 municipalities without information) to 490%. The same was verified in relation to the hepatitis B vaccine ≤30 days in children up to 30 days old, although it is recommended together with the BCG vaccine at birth. For this vaccine, there are no data in the national database in 100 municipalities and 419 of the 5,570 municipalities recorded a coverage > 100%. PCV10, rotavirus, penta, IPV, meningo C and YF vaccines showed values with variation in indices ranging from zero to 550% of the VCR.
Therefore, it is reasonable to note that overestimated or underestimated VCR at the levels at which these indices are, is questionable, and could not be included in the context of adequate VC and therefore, despite being a good indicator to suggest "population immunity", it should be seen with caution.
ConclusionsThe present evaluation has limitations due to the quality of the information (VCR outliers), as well as the integrity of the database compromised by the inadequate integration of information systems on vaccination data.
However, for the available data, when evaluating vaccination coverage by vaccine and homogeneity of coverage by the municipality and between vaccines in the different spheres of PNI management, a significant reduction in these indicators was observed in the pre-and pandemic periods of Covid-19, intensified in this last period due to the overload of services, prioritizing attention to the serious health situation that the world has experienced and because of it, the initial recommendations for social isolation, despite the fact that the pandemic is not an isolated cause of the also serious problem that represents the decline in vaccination coverage in the country.
It is an issue that encompasses the set of all Brazilian municipalities; however, the results are less favorable in the North and Northeast regions, possibly related to access to vaccination services, availability of products, and not least, the difficulties of geographical access.
It is necessary, when developing intervention strategies prioritizing situations of greater vulnerability, to incorporate these areas, not eliminating situations of concern in the other regions of the country. Additional efforts must be implemented to encompass all Brazilian municipalities since the current scenario of vaccination coverage in the country is a serious one. Like measles, there may be a resurgence of other diseases, if the VCR and VCH remain as low as seen in recent years.
It is urgent to seek partnerships and strategies to reverse this situation. Adequate communication and professional qualification are important issues, aiming to prepare the services to understand the importance of vaccination for all vaccines and target groups, given the complexity of the PNI vaccination schedule, being essential to guarantee the number of qualified professionals as well as the supply of vaccines in all services.
The current scenario is a matter of concern and requires urgent intervention measures under the penalty of compromising the entire history of the PNI achievements in its almost 50 years of existence, especially regarding the impact on preventable diseases throughout the country.


