
To analyze the content validity and the test-retest reliability of the Questionnaire for Screen Time of Adolescents (QueST).
MethodsA study was conducted with high school adolescents from Southern Brazil enrolled in public education (2019). The QueST measures screen time across five constructs: studying, working/internship-related activities, watching videos, playing games, using social media/chat applications. Content validation involved consulting with experts and adolescents to evaluate whether the five constructs were clear and representing screen time behaviors, all ratings were quantified. The experts’ evaluation provided Content Validity Indexes (CVI) for clarity and representativeness of the questionnaire. Students answered the QueST twice (1-week apart), and differences between applications were verified. Test-retest reliability was assessed using Intraclass Correlation Coefficients (ICC) and Bland-Altman analyses.
ResultsAmong the experts, the CVI indicated 94% and 98% of clarity and representativeness, respectively. All items were highly clear for at least 70% of the students. Test-retest reliability was assessed with 104 students (16.3 ± 1.02 years; 66.3% girls). The ICC ranged from 0.41 (95%CI 0.24–0.56) for videos to 0.76 (95%CI 0.66–0.83) for social media/chat applications on weekdays; and from 0.24 (95%CI 0.04–0.41) for videos to 0.67 (95%CI 0.54–0.77) for social media/chat applications on weekends. The lowest mean difference was -4.6 min for working on weekdays, while the highest was 40.6 min for videos on weekends.
ConclusionsThe QueST proved to be fair to excellent for measuring different screen time constructs. However, the item of videos (weekends) showed poor stability. The QueST demonstrates satisfactory content validity attested by the experts and adolescents.
Screen time refers to the time spent on behaviors that imply interaction with screen-based devices (e.g., using smartphones or computers) and may be performed recreationally, professionally, and in educational settings.1 The physical, mental and social health of children and adolescents has been negatively impacted by screen time.2–6 However, not only the devices are linked to health outcomes, but what is being done on them as well.3,7 For example, excessive social media usage, which is a relatively novel concern, has been associated with depressive symptoms,7 socialization problems,7,8 poor body image,4 and poor academic performance.2,5
Advances in technology are causing changes in screen-based behaviors such as the decrease in television use and an increase in computer use among adolescents.9 Watching movies and videos were limited to the television, and playing video games used to require specific consoles until recently; however, with technological innovations, these activities are being executed on several gadgets, including computers, tablets, and smartphones, indistinctly. Moreover, the novel smart devices allow and encourage multiple concurrent screen use and multitasking within a device (e.g., using a smartphone for checking social media and watching videos at the same time), which brings challenges to the measurement of screen time. However, several available tools are not sensitive to deal with this new scenario. Two recent reviews of questionnaires for measuring sedentary behavior demonstrated that most instruments worldwide measure television screen time, followed by video games, and/or computer use.10,11 Besides, the recently established consensus definitions have highlighted that sedentary time and screen time are conceptually and operationally distinct,1 so that specific approaches and tools are needed to properly measure these outcomes. Additionally, it is imperative to advance in instruments that take into account what activities are being performed on screens in order to broaden the understanding of the etiology of health problems in pediatric populations. But in general, the questionnaires developed or adapted to the Brazilian context are limited to measuring only television time as a screen time indicator.12 An exception is the Brazilian version of the Adolescent Sedentary Activity Questionnaire (ASAQ)13 that has modestly advanced in focusing activities and contents instead of the electronic devices. For example, it investigates time playing video games and watching videos without considering a specific screen device. Based on these issues, this study aimed to propose a questionnaire that uses a novel approach to measure different screen time behaviors among adolescents and evaluate its content validity and test-retest reliability.
MethodsStudy designThe authors used a methodological design for reporting the measurement properties of a novel self-administered instrument.14 The Questionnaire for Screen Time of Adolescents (QueST) aims at assessing habitual volumes of screen time in different constructs in adolescents. After the initial development of the QueST, the proprieties of content validity and test-retest reliability were verified with different samples, as follows: i) for the content validity, 14 students from a Federal Institute of Technological Education and 16 experts were included; ii) for the test-retest reliability, a sample of 104 high school students from the Aplicação School was analyzed. These evaluations were conducted in a metropolitan area of the state of Santa Catarina, Southern Brazil in 2019.
All adolescents who participated and their parents/legal guardians approved the study protocols and provided written consent forms. The study was approved by the ethics committee for research with human participants of the Federal University of Santa Catarina, Brazil (protocol number: 3.168.745).
The Questionnaire for Screen Time of AdolescentsThe idealization of the QueST and the following procedures were performed by researchers with expertise in the physical activity and health field at a Brazilian university. The initial construction of the QueST followed standardized recommendations11 and begun with a non-systematic consultation of recent reviews of questionnaires for measuring sedentary behavior.10,11 The development of the QueST can be described in four steps as follows: i) identification of the constructs representing screen time behaviors among adolescents; ii) determination of the administration format of the questionnaire (e.g., self-reported, self-administrated, digital instrument); iii) choice of the number, format, order, and writing of the items and response options; iv) review of the questionnaire and optimization of its organization and readability.15,16
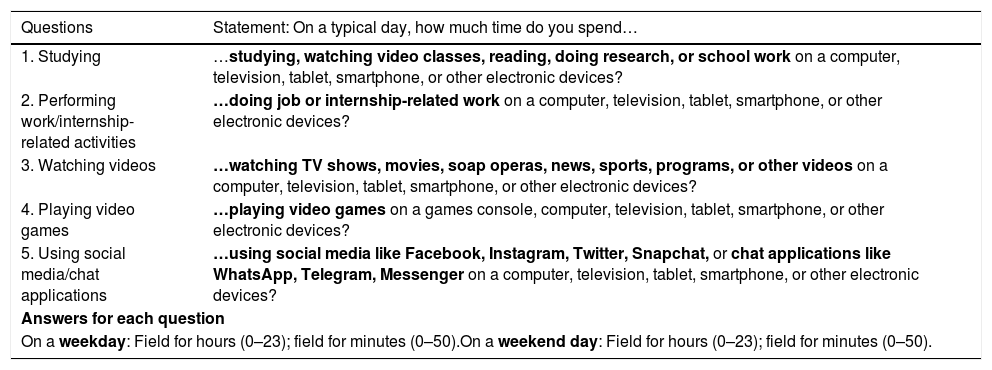
Five screen time constructs were proposed by the researchers based on questions used in this field,10,11,13,17 as follows: (i) activities related to study or homework; (ii) activities related to work or internships; (iii) watching videos, such as series, movies, news, and sports; (iv) playing video games; and (v) using social media and chat applications. The choice to measure the use of chat applications and social media within a single construct was made as platforms and applications generally offer both services. The work-related construct was included as many internships and jobs require screen time activities. On each construct, the time can be reported for weekdays and weekend days. The QueST was written in Brazilian Portuguese and designed to be self-administered. Each of the described constructs represented an item in the questionnaire. QueST items are shown in Table 1.
Final version of the Questionnaire for Screen Time of Adolescents (QueST) (Brazil, 2019).
For the content validation, Brazilian experts were invited among those who fulfilled the following criteria simultaneously: (i) monographic production (e.g., specialization course, thesis, or dissertation), (ii) articles published in scientific journals, and (iii) ongoing research project about screen time or studies with psychometrics and validation of questionnaires. Additionally, all experts should have (iv) Ph.D. and should be (v) either researchers or professors in universities or research institutes. The experts were contacted by e-mail with descriptions of the QueST and instructions on how to conduct the assessment.
The experts evaluated the QueST in two steps: (i) an individual evaluation of each of the items, and (ii) a global evaluation of the QueST.18 The experts rated the content validity of the questionnaire independently, evaluating each item regarding clarity and representativeness.19 The clarity evaluation rated the writing of the questions considering the comprehension of the construct being measured.15 Whereas the representativeness evaluation verified if the items reflected screen time, its constructs, and concepts.15 The experts answered about clarity through a 4-point Likert scale (4 = highly clear; 3 = quite clear; 2 = somewhat clear; 1 = not clear) and answered about the representativeness of the constructs being measured using a similar scale (4 = the item is representative; 3 = the item needs minor revisions to be representative; 2 = the item needs major revisions to be representative; 1 = the item is not representative).19 When considering the ratings on clarity and representativeness, the Content Validity Index for each question was computed.18 Besides, general comments on the questions could be added by the experts.
For the global evaluation of the QueST, experts answered about the clarity and expressiveness of the title (yes/no); all items representing adolescents’ screen time (yes/partially/no); suitability of the metric (yes/partially/no); suitability of the unit of measure and response scale (yes/partially/no); adequacy of the sequence of items (yes/partially/no); the use of the bold tags on the questions to emphasize primary information on the online questionnaire (yes/partially/no). Also, the experts were able to provide comments on each item and suggest the addition and deletion of items. The Content Validity Index for each question also provided an additional index of the global assessment of the QueST.
Instrument review by the adolescentsThe QueST was reviewed by a convenience sample of 14 students enrolled in the last year of high school and attending morning classes in a Federal Institute of Technological Education from Santa Catarina state. Only these students were allowed by the management of the school to participate in this step. The procedure involved an online questionnaire, which comprised the QueST and additional questions about (i) the clarity of each item (highly clear/quite clear/somewhat clear/not clear); (ii) unfamiliar words (no/yes, which one?); (iii) if students did understand how to answer the QueST (I did/I did not understand); (iv) if students had any difficulty in answering the QueST (no/yes, which one?); and (v) if other activities involving the usage of electronic screens were lacking on the questionnaire (no/yes, which one?). Students accessed the electronic link of the questionnaire using their smartphones at school under supervision.
Test-retest reliabilityAll high school students from the Aplicação School in 2019 were recruited (203 eligible students) of whom 151 (74.4%) agreed to participate and provided signed assent and consent forms. They were asked to answer the QueST twice with a 7-day interval between applications, as recommended.16 This procedure was performed in a classroom, during school hours, and students accessed the electronic link of the questionnaire using their smartphones. The measurement conditions were similar for both test and retest.
AnalysisContent validity analysisThe five items of the QueST were evaluated on clarity and representativeness using the Content Validity Index for Items (I-CVI).18 The I-CVI were calculated by summing the ratings of either “3” or “4” in each item divided by the total number of experts. Also, the Content Validity Index for Scales (S-CVI) was obtained by the arithmetic mean of the I-CVIs,18 separately calculated for clarity and representativeness. The authors MTGK, BGGC, and PCS analyzed the qualitative comments provided by the experts, and suggestions were accepted/rejected based on consensus among these authors. This step was blinded to secure the identity of the experts and mitigate bias.
All information regarding the review of the QueST by the students was descriptively presented by proportions. Any ratings "somewhat clear" or "not clear" on the wording of any item, as well as, any student who answered that had not understood how to answer the QueST was adopted as the criterion of reformulating the item or the entire instrument, entailing a second evaluation by the students. Furthermore, the authors MTGK, BGGC, and PCS, by consensus, would replace possible unfamiliar words. The difficulties when answering the QueST were described.
Test-retest reliability analysisOnly students who answered both test and retest were included. Implausible answers were also excluded by adopting >14 daily hours as a cutoff value. Differences between the test and retest were analyzed using non-parametric Sign-Rank tests since screen time behaviors did not accomplish normality, and Student's t-tests were applied for confirmation. The test-retest reliability of the log-transformed screen time items (constructs) was discerned through intraclass correlation coefficients (ICC) and interpreted according to Rosner's classification.20 Also, Bland-Altman analyses were used for examining the mean differences and limits of agreement (in minutes) between test and retest. The Bland-Altman plots of the items were provided in Supplementary Material 1.
ResultsContent validityOf the 24 invited experts, 16 submitted their answers, and they were from the areas of Physical Education (n = 7), Physical Activity and Health (n = 2), Medicine (n = 2), Nutrition in Public Health (n = 2), Statistics (n = 1), Epidemiology (n = 1), and Public Health (n = 1).
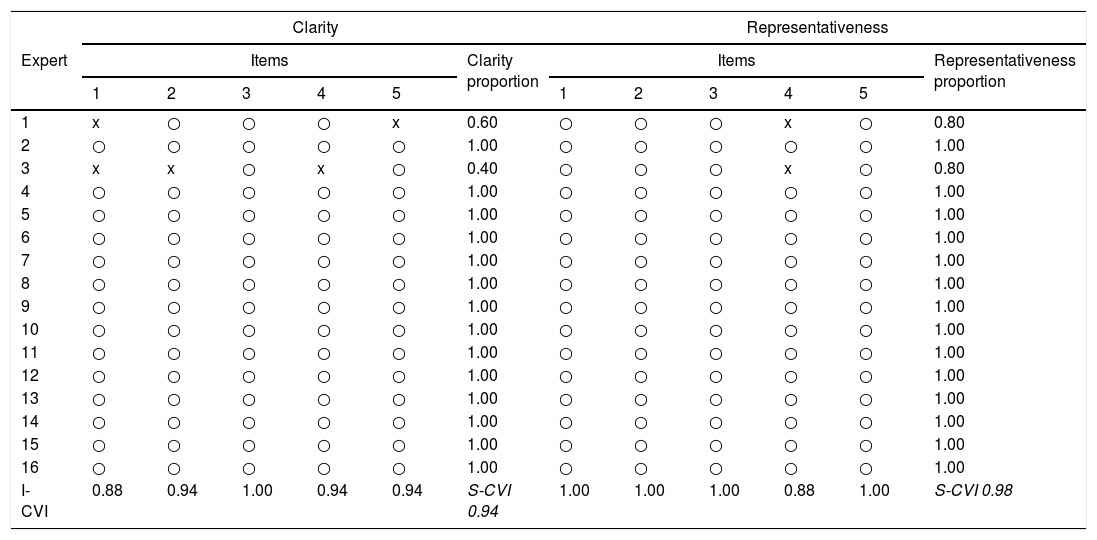
Regarding clarity, the smallest I-CVI was observed in Item 1 (studying: 88% of agreement among the experts). The calculated S-CVI indicated 94% of the overall clarity of the QueST. Regarding representativeness, four out of the five items were considered as 100% representative, except for playing video games (I-CVI = 0.88). The S-CVI indicated representativeness of 98% (Table 2).
Evaluation and rating of the QueST by 16 experts for content validation. (Brazil, 2019).
I-CVI, Content Validity Index for Items; S-CVI, Content Validity Index for Scales; ○, questions rated 3 or 4 on the 4-point Likert scale; x, questions rated 1 or 2 on the 4-point Likert scale.
Based on the review of the experts, some terms in the items were replaced or added (example: to watch sports was added in the Item 3); the response scale was simplified, where the experts proposed a shorter scale (0, 10, 20, 30 min…), instead of a minute-by-minute scale. There was no addition or exclusion of items.
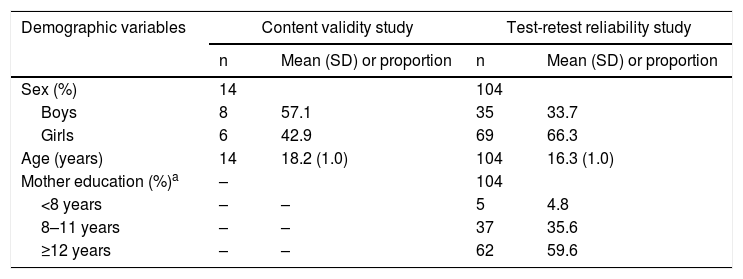
Fourteen students (18.2 ± 1.0 years old, 42.9% girls) participated in the review of the QueST for the content validation (Table 3). Based on the review (data not shown), all students considered the wording of the items to be highly or quite clear. The five items were highly clear for >70% of the students: Item 1: 71.4%; Item 2: 78.6%; Item 3: 85.7%; Item 4: 84.6%; Item 5: 84.6%. There were no "somewhat clear" or "not clear" ratings. No student reported issues regarding the vocabulary, and 100% of them understood how to answer the QueST. Eleven students did not express any difficulty in answering the QueST; however, three students commented that they had difficulty in precisely reporting their habitual screen time. Based on the review of the students, no modifications to the QueST were necessary.
Students characteristics (Brazil, 2019).
| Demographic variables | Content validity study | Test-retest reliability study | |||
|---|---|---|---|---|---|
| n | Mean (SD) or proportion | n | Mean (SD) or proportion | ||
| Sex (%) | 14 | 104 | |||
| Boys | 8 | 57.1 | 35 | 33.7 | |
| Girls | 6 | 42.9 | 69 | 66.3 | |
| Age (years) | 14 | 18.2 (1.0) | 104 | 16.3 (1.0) | |
| Mother education (%)a | – | 104 | |||
| <8 years | – | – | 5 | 4.8 | |
| 8–11 years | – | – | 37 | 35.6 | |
| ≥12 years | – | – | 62 | 59.6 | |
SD, standard deviation.
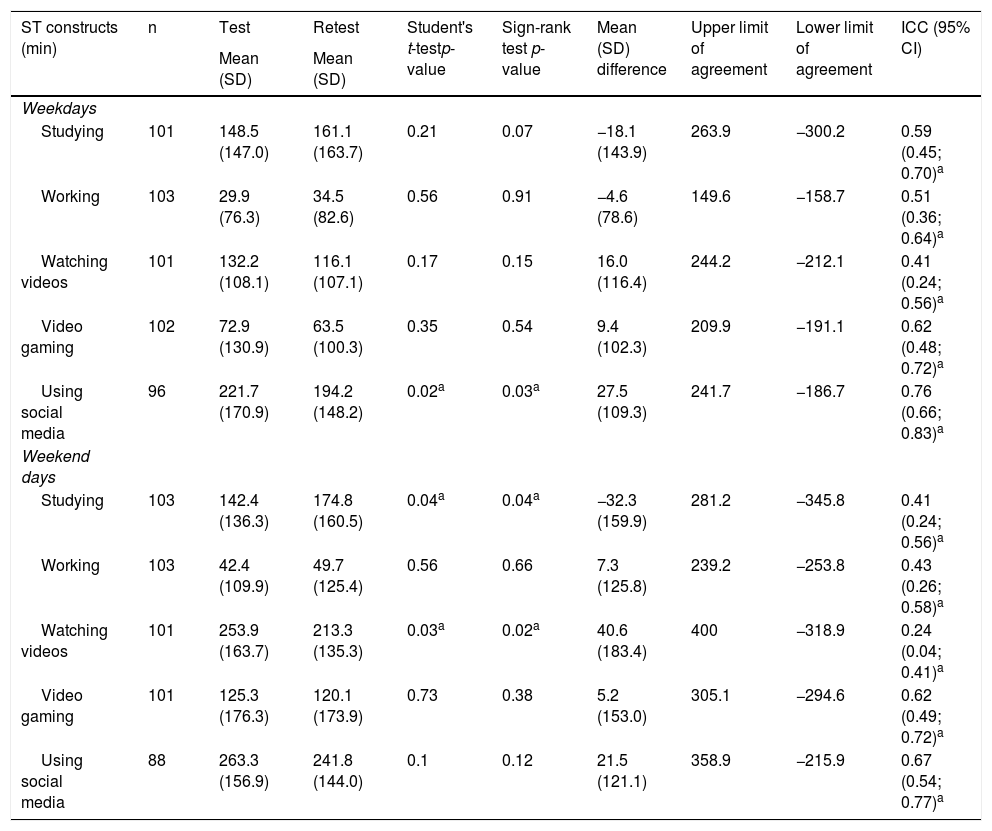
From 151 students who agreed to participate, 104 students (68.9%) aged 14–19 years (16.3 ± 1.02 years; 66.3% girls) answered the QueST entirely in both test and retest (Table 3). For the following reliability results, the parametric and non-parametric tests showed statistical significance in the same items (Table 4). The mean time of social media usage on a weekday was higher at test (test: 221.67 ± 170.87; retest: 194.17 ± 148.24 min; p < 0.05), whereas the time studying on weekend days was higher at retest (test: 142.43 ± 136.33; retest: 174.76 ± 160.46 min; p < 0.05). Moreover, the time watching videos on weekend days was higher at the test (test: 253.86 ± 163.75; retest: 213.26 ± 135.33 min; p < 0.05). The other measures were not different between test and retest.
Test-retest reliability of the QueST (Brazil, 2019).
| ST constructs (min) | n | Test | Retest | Student's t-testp-value | Sign-rank test p-value | Mean (SD) difference | Upper limit of agreement | Lower limit of agreement | ICC (95% CI) |
|---|---|---|---|---|---|---|---|---|---|
| Mean (SD) | Mean (SD) | ||||||||
| Weekdays | |||||||||
| Studying | 101 | 148.5 (147.0) | 161.1 (163.7) | 0.21 | 0.07 | −18.1 (143.9) | 263.9 | −300.2 | 0.59 (0.45; 0.70)a |
| Working | 103 | 29.9 (76.3) | 34.5 (82.6) | 0.56 | 0.91 | −4.6 (78.6) | 149.6 | −158.7 | 0.51 (0.36; 0.64)a |
| Watching videos | 101 | 132.2 (108.1) | 116.1 (107.1) | 0.17 | 0.15 | 16.0 (116.4) | 244.2 | −212.1 | 0.41 (0.24; 0.56)a |
| Video gaming | 102 | 72.9 (130.9) | 63.5 (100.3) | 0.35 | 0.54 | 9.4 (102.3) | 209.9 | −191.1 | 0.62 (0.48; 0.72)a |
| Using social media | 96 | 221.7 (170.9) | 194.2 (148.2) | 0.02a | 0.03a | 27.5 (109.3) | 241.7 | −186.7 | 0.76 (0.66; 0.83)a |
| Weekend days | |||||||||
| Studying | 103 | 142.4 (136.3) | 174.8 (160.5) | 0.04a | 0.04a | −32.3 (159.9) | 281.2 | −345.8 | 0.41 (0.24; 0.56)a |
| Working | 103 | 42.4 (109.9) | 49.7 (125.4) | 0.56 | 0.66 | 7.3 (125.8) | 239.2 | −253.8 | 0.43 (0.26; 0.58)a |
| Watching videos | 101 | 253.9 (163.7) | 213.3 (135.3) | 0.03a | 0.02a | 40.6 (183.4) | 400 | −318.9 | 0.24 (0.04; 0.41)a |
| Video gaming | 101 | 125.3 (176.3) | 120.1 (173.9) | 0.73 | 0.38 | 5.2 (153.0) | 305.1 | −294.6 | 0.62 (0.49; 0.72)a |
| Using social media | 88 | 263.3 (156.9) | 241.8 (144.0) | 0.1 | 0.12 | 21.5 (121.1) | 358.9 | −215.9 | 0.67 (0.54; 0.77)a |
ST, screen time; SD, standard deviation; ICC, intraclass correlation coefficient; CI, confidence interval.
The lowest mean difference between test and retest was −4.6 min (Upper limit: 149.6; Lower limit: −158.7) for working on weekdays, while the highest was 40.6 min (Upper limit: 400.0; Lower limit: −318.9) for watching videos on weekend days. The upper and lower limits of agreement indicate the high standard deviations of the mean differences between test and retest. The dispersions of the differences are graphically displayed in Supplementary Material 1. The highest ICC was observed for the use of social media on weekdays (0.76, 95%CI 0.66–0.83; excellent reliability), whereas the lowest ICC was observed in the construct of watching videos on weekends (0.24, 95%CI 0.04–0.41; poor reliability) (Table 4).
DiscussionThe test-retest reliability of the items from the QueST varied considerably across constructs and days. The content was considered valid based on the level of agreement among experts for clarity and representativeness of the items and questionnaire. According to the acceptability criteria, the lowest I-CVI admitted is 0.78.18 The instrument has acceptable content validity when the S-CVI is ≥ 0.90.21 In addition, the evaluations given by the experts and adolescents were complementary to the content contributing to minor modifications.
The review of the instrument according to the target population and experts is strongly recommended11,14; however, this step is not often carried out.11 Three students reported difficulty in accurately reporting the usual screen time in the items, likely because screen time can be variable and unstable over time and is dependent on several factors22 that contribute to a suboptimal estimation. Thus, the response scale was updated to make the self-report easier and improve the measurement.
The differences between test and retest may be related to the lack of habitual screen time behaviors on specific days of the week. Leisure activities using electronic devices such as using social media applications or watching videos can fluctuate according to attractions that reach adolescents even through specialized algorithms that contribute to less stable or routine screen time behaviors.23 Also, multitasking using electronic devices9 likely impairs accurate reports that may be influencing the test-retest reliability of the QueST.
The test-retest reliability of the items ranged from poor to excellent.20 Overall, it is demonstrated that categorical screen time variables show higher test-retest reliability than continuous measurements.11 In the present study, the item for watching videos, both on weekdays and weekends, showed the lowest ICCs. Likewise, another reliability study with a similar sample size (n = 103) showed poor ICCs for the items measuring time spent watching TV/videos (boys: ICC = 0.20; girls: ICC = 0.38).24 The construct related to videos tends to be unstable throughout the time as some factors can influence screen behavior even in a short time frame.25 For example, the release of a new season of a popular series, or the occurrence of sporting events (e.g., international league finals or Playoffs) can considerably increase the electronic screen usage within a few days and inflate only one measure, either test or retest. Thus, the answers in the test and retest may be accurately reported by adolescents, but it is still verified as poor test-retest reliability because a particular behavior does not represent “typical” patterns.25
The item for playing video games presented fair and good test-retest reliability on week and weekend days, respectively, demonstrating considerable accuracy and stability of the responses to this behavior. The ICCs obtained were similar to those of the Health Behavior in School-aged Children study, which showed ICC = 0.54 (95% CI 0.38; 0.67) on weekdays and 0.69 (95% CI 0.57; 0.78) on weekends for the gaming item.26
Similarly, the item about social media/chatting applications demonstrated good to excellent test-retest reliability on both weekdays and weekend days. Stable, but high volumes characterized this behavior. However, this is expected as they are predominantly realized on smartphones over long periods of the day,4,8 possibly while multitasking.
The item related to screen time for studying on weekdays showed fair to good test-retest reliability and was higher compared to the ICC obtained on the weekends. Possibly, the time spent on studies over the weekend is more variable or flexible and determined by school demands, such as the proximity to exams at school compared to the time spent studying on weekdays, when the adolescents already have established a stable routine of school tasks. In general, few studies include screen time items related to work,10,11 although the proportion of adolescents who have a job is considerable.27
The screen time behaviors were less stable on weekends than on weekdays. But this result may be related to the natural variability of these behaviors, especially on weekends when fewer routine behaviors are expected, and adolescents may have more free time to use electronic devices as they please. Indeed, children and adolescents spend more time on electronic devices on weekends than on weekdays,28 likely because screen time behaviors on weekends can be influenced by the lack of school routine and fewer opportunities to practice physical activities.28 Overall, the measurement errors of sedentary behavior questionnaires for youths are higher on weekends than on weekdays,11 which is in line with the present results.
Among the strengths of this study, the authors highlight the use of a wide range of screen time constructs; the use of guidelines for evaluating measurement properties of questionnaires14 (Supplementary Material 2); the content validation used qualitative and quantitative methods. Besides that, this study sought to include the content validation process from the experts and target population perspectives.
All methods regarding the content validation and test-retest reliability followed recommendations for questionnaires measuring sedentary behavior in children and adolescents.11 Nevertheless, this study had as limitations the convenience sample of students for the content validation; in the test-retest reliability sample, there were more girls than in the group of students excluded from this analysis (data not shown), which represents bias; the QueST was developed to cover activities that adolescents perform using any screen-based device, however, not all possible activities fit into a construct, such as reading eBooks for leisure.
Due to its innovative approach centered on the activities that lead to screen time irrespective of the electronic device, the QueST can be used in research tailored to investigate specific risk factors in adolescence. For instance, the QueST can be employed to verify the relationship between studying and working while using screens with health outcomes, as well as social media, which has gained attention recently and has been linked to mental health3,6 and body dissatisfaction4,6 among adolescents. In addition, the QueST provides measures suitable to support screen time surveillance for public health policies, as current guidelines recommend that individuals between 5 and 17 years should not spend more than 2 h/day in recreative screen time,29,30 and most evidence is solely based on time watching television, using computers, and playing video games.11 In this instance, the items related to videos and video games in the QueST can be adopted to classify compliance with guidelines. Furthermore, the QueST can be used in screening in clinical practice, given the relationship between screen time and metabolic6 and mental health3,6 outcomes. As screen time activities are positively related to educational concerns such as cyberbullying/bullying3 and lower academic performance,2,5 the QueST can be functional for school practitioners seeking to plan interventions aiming to reduce screen time.
In conclusion, the QueST proved to be fair to excellent for measuring different screen time constructs. However, the item of videos on the weekend showed poor stability over a 1-week interval. Overall, the QueST demonstrates satisfactory content validity attested by the experts and adolescents, and its use is recommended. The final electronic version of the QueST is available at pt.surveymonkey.com/r/QLQTQHG (Brazilian Portuguese) and pt.surveymonkey.com/r/Q7QXYL2 (English. Cross-cultural validation is suggested).
Ethical standardsThe study was approved by the ethics committee for research with human participants of the Federal University of Santa Catarina, Brazil (protocol number: 3.168.745).
FundingConselho Nacional de Desenvolvimento Científico e Tecnológico, Brasil, grant: MCTIC/CNPq 2018, process: 406258/2018-0, and Coordenação de Aperfeiçoamento de Pessoal de Nível Superior, Brasil, scholarship grants (MTGK, BGGC, PCS, ACFCS). The funders had no role in the design, conduction, data collection, analysis and interpretation of the results, nor in the preparation, writing, review or approval of the manuscript.


