

To determine the reference intervals (RI) for serum levels of IgG, IgM, and IgE in healthy children aged 1–10 years living in central Brazil.
MethodA sample of 1743 healthy children was randomly selected from kindergartens and public schools. Reference intervals were defined by non-parametric rank (Clinical Laboratory Standards Institute, USA), bootstrapping, and Horn's robust methods.
ResultsBy the rank method, the IgG RI was 792–1771 mg/dL for children of both sexes aged 1–10 years. IgM RI were different for gender and age groups, being 45–196 mg/dL and 34–190 mg/dL for boys aged 1–2 years and 3–10 years, respectively. For girls, the IgM RI were 50–212 mg/dL and 39–212 mg/dL, for ages 1–4 and 5–10 years, respectively. The IgE RI for both sexes and ages 1–10 years was 6–1005 mg/dL. The bootstrap method showed RI similar to the rank method but with slightly different confidence intervals. Horn's robust method determined RI different from those obtained by previous methods.
ConclusionRI for serum concentrations of IgG, IgM, and IgE were established for Brazilian children aged 1–10 years. This definition will be useful for Brazilian physicians, who will have more adequate parameters for their clinical decision-making.
Although the concept and use of reference intervals (RI) seem simple, the process for their reliable estimation is complex. RI is a set of values that includes the upper and lower limits of a test. Laboratory RI includes only a fraction of the values measured in the reference population, mostly the 95 % of the central distribution values between the 2.5th and 97.5th percentiles.1 Reliable RI are essential in clinical practice because they guide about 80 % of clinical decisions.1 Unfortunately, many RI used in medical practice were obtained from a small sample of patients who were either hospitalized or went to the laboratory for clinical tests.2 In pediatrics, it is even more difficult to obtain enough samples from healthy children to determine the RI according to the standards recommended by the Clinical Laboratory Standards Institute (CLSI).1 Guideline C28-A3, which is endorsed by the Federation of Clinical Chemistry and Laboratory Medicine, presents standards to define samples and robust statistical analysis to define and verify reliable RI.1,2
In 2017, the CALIPER database, derived from a large Canadian study with thousands of children and teenagers, determined the RI of more than 100 analytes using the methodology proposed by the CLSI.1,3 Although it included people from different ethnicities, it did not represent the populations of all continents and regions of the world. In Brazil, few studies determine RI for immunoglobulins. Current RI is defined using outdated laboratory methods or samples and statistical methods that did not meet the current CLSI standards.4-6
The population of the state of Mato Grosso in Brazil is the result of intense miscegenation between indigenous and black populations and European migrants coming from the state of São Paulo during the colonial period and after 1970, when there was intense migration from the South, Northeast, and Southeast regions. Cuiabá, the capital of Mato Grosso, represents this migration and population miscegenation profile.7 Therefore, half a century after this last migratory movement, children who currently live in the city are considered representative of most of the Brazilian pediatric population.
The objective of this study was to define the RI of serum IgG, IgM, and IgE levels in a sample of healthy Brazilian children aged 1–10 years in Cuiabá, MT, Brazil. The results presented here are part of a larger ongoing study to determine the RI and decision limits of serum levels of several analytes in healthy children from Cuiabá.8 The RI of serum IgA levels were already established for this population and published by the authors.9
MethodsDetailed descriptions of the methods used to determine a representative sample are available in a previous publication by the authors, which determined the RI of serum IgA levels for this population.8,9 A total of 1743 children aged 1–10 years were selected to determine the RI of serum IgG, IgM, and IgE levels. The inclusion criteria were children with no known underlying disease, no clinical signs or symptoms, no health complaints, and no medication use at the time of blood collection. Sociodemographic history, clinical history, anthropometric parameters, nutritional status, breastfeeding duration, fasting care before sample collection, technique used, and sample conservation and processing data have been previously described.8,9 Serum IgG, IgM, and IgE levels were determined by nephelometry on the same day of collection. A Siemens BN II device was used for data analyses at the CEDILAB laboratory, a member of the Diagnósticos da América SA (DASA) network, in Cuiabá, MT, Brazil.
IgG, IgM, and IgE RI were determined according to the CLSI.1 The data were analyzed using scatter and box plots to visualize extreme outliers, which were removed by Tukey's method (1.5 times the interquartile distance [IQD]).10 The need to divide the groups by sex and age was determined by analysis of the variance ratio (VR) and standard deviation from the mean (SDM). A VR < 1.5 indicated no need to divide the groups. If VR was > 1.5, the SDM was calculated by the z-score and the Z-critical, which depended on the sample size of the subgroups. A calculated z-score > Z-critical indicated the need to divide the groups into subgroups (Harris & Boyd, 1990).11 After identifying the subgroups, the distribution of the serum levels of each immunoglobulin class was evaluated for symmetry, considering symmetric the groups with asymmetry coefficients between −1 and +1.12 Subgroups with an asymmetric distribution were normalized by the Box-Cox transformation. Outliers were identified by twice anTukey's method and eliminated from each subgroup.10 Then, the RI of serum IgG, IgM, and IgE levels were determined by the rank method (i.e., considering the lower and upper limits of values from the 2.5th to the 97.5th percentiles, respectively), including their 95 % confidence interval [CI]. The RI was also determined by nonparametric bootstrapping, with outliers identified and removed by Dixon's and Horn's robust methods in order to compare results.13,14 The data were analyzed by Stata version 12.0 (StatCorp, Texas, USA), R version 4.2.2 (R Foundation, Vienna, Austria), and RefVal version 4.11 for the statistical treatment of medical reference values (Department of Clinical Chemistry, Oslo, Norway).
The study was approved by the two Ethics Committees under documents numbers 947/2010 and 318/2011 before data collection, and the use of its database was approved by a document number 4.870.067/2021. Participants were included according to the inclusion criteria after their parents or guardians signed an informed consent form.
ResultsSociodemographic, perinatal, nutritional, and anthropometric data of the 1743 children who participated in the study have been described in a previous publication,9 which showed that the sample represented the population studied and consisted of healthy participants. The groups with children aged 1–8 years had more than 120 participants each. The groups with children aged 9 and 10 years old had 112 and 114 participants, respectively.9 In spite of the fact that groups were separated by sex or age, no subgroup had fewer than 120 children.
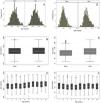
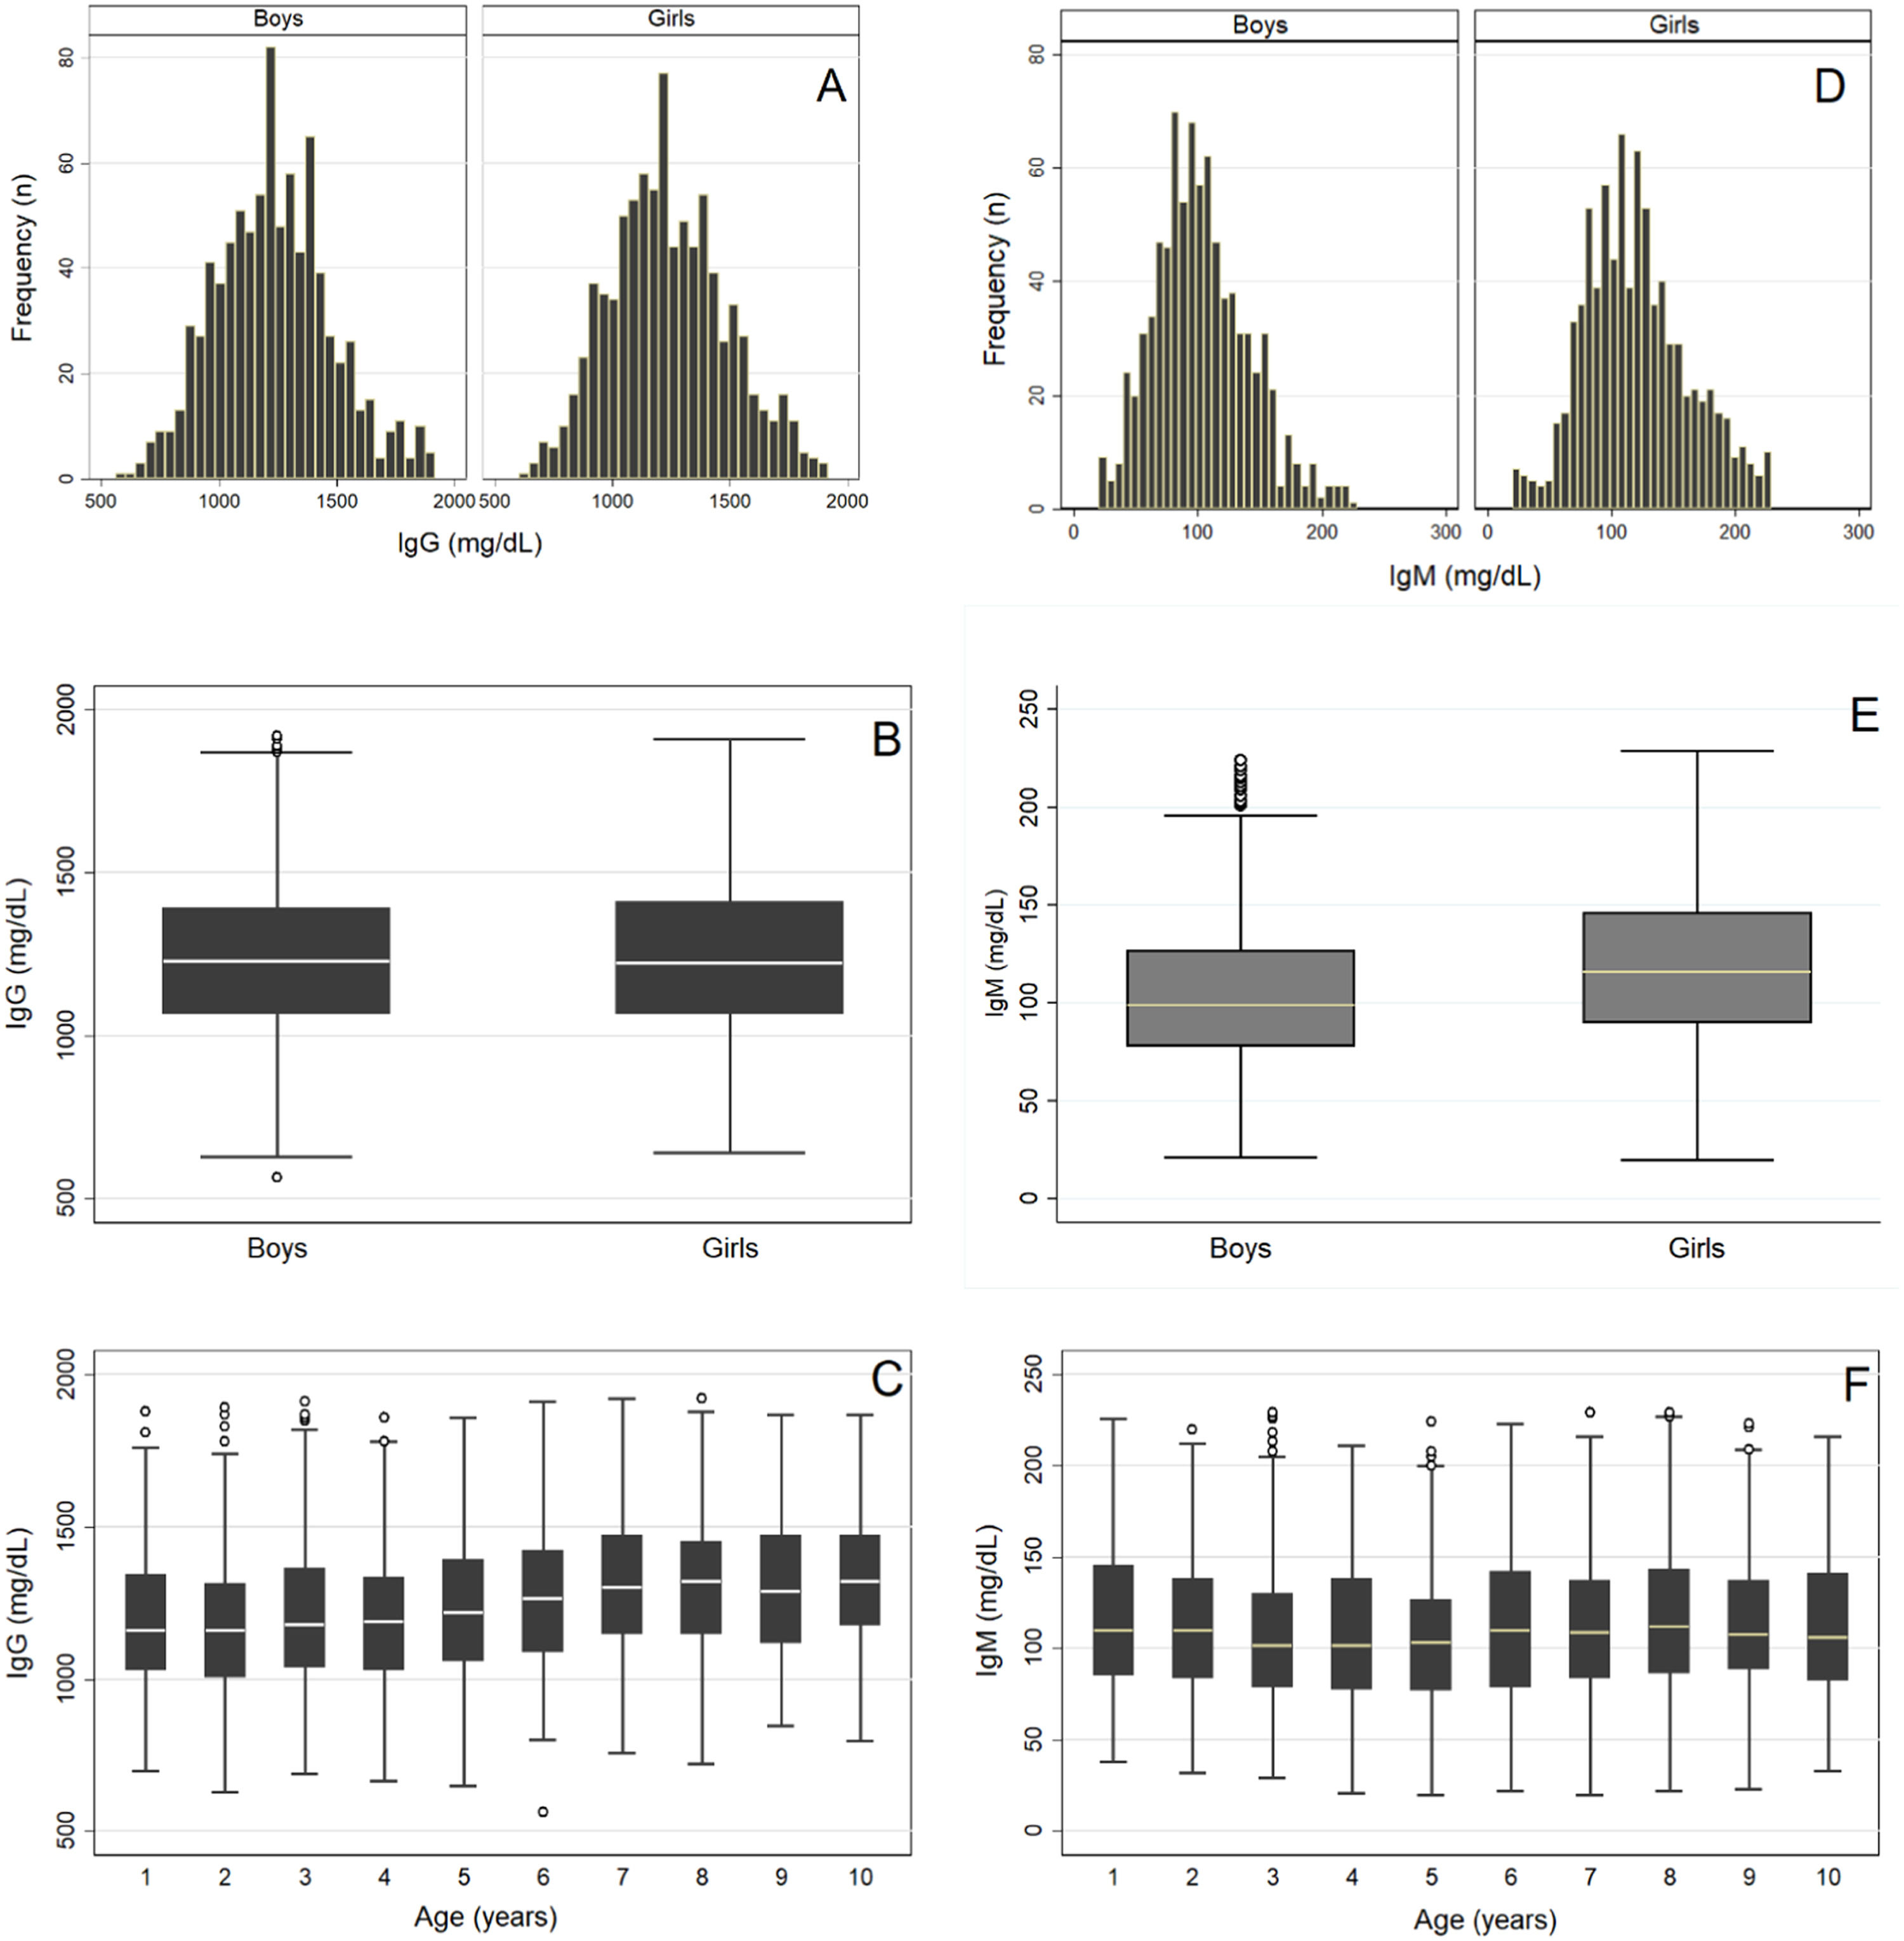
After removing outliers for each immunoglobulin class, the final samples included 1715, 1681, and 1565 children to determine the RI of serum IgG, IgM, and IgE levels, respectively. Figure 1A–C shows a histogram and a boxplot of the distribution of IgG levels by sex and age. Similar serum IgG level distributions were observed in both groups separated by sex and age, showing no need to divide these groups. Likewise, VR and SDM values indicated no need to divide the groups by sex or age (Table 1). Twice Tukey's method10 showed no outliers. Thus, only one RI was determined for serum IgG levels in both male and female children aged 1–10 years (Table 2).
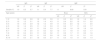
Variances ratio and comparison of Z and Z* of serum levels of IgG, IgE, and IgM between genders and age groups.
VR, variance ratio; Z, calculated Z-score; Z*, Z-critical.
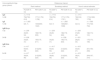
Estimation of IgG, IgE, and IgM reference intervals using rank, bootstrap, and Horn's robust estimator methods in children aged 1–10 years.
Unit, mg/dL; P, percentile; 95 % CI, 95 % confidence interval.
n, sample size after outlier removal (original sample: 1743 individuals).
Figure 1D–F shows the distribution of serum IgM levels by sex after removing outliers.10 The comparison of RI between sexes and age groups indicated no need to divide the groups (VR = 1.1), but the SDM showed the need to divide the groups by sex (i.e., Z-score (8.6) > Z-critical (5.6). In addition, the boys were divided by age into two subgroups: 1–2 and 3–10 years. The girls were also divided into two subgroups: 1–4 and 5–10 years (Table 1). Therefore, separate RI was determined for the sexes and for two different age groups for each sex (Table 2).
The same statistical analysis was used for IgE. Figure 2A–B shows a strong asymmetry and the presence of outliers even after their removal by Tukey's method.10 The distribution of serum IgE levels by sex showed no need for division, which was different from the distribution by age (Figure 2C). However, VR and SDM analyses showed no need to divide the groups by sex or age (Table 1), and a single RI of serum IgE levels was determined for boys and girls aged 1–10 years (Table 2). Subsequently, the distribution of IgE values for the total group of children showed asymmetry (asymmetry coefficient = 1.5), requiring a logarithmic Box-Cox transformation that resulted in an asymmetry coefficient near zero (Figure 2D). In the next step, the data from this group underwent a new outlier survey using twice Tukey's method.10 No outliers were excluded in this phase, confirming data symmetry. After all these steps, the RI of IgG, IgM, and IgE levels were determined by the rank method, bootstrapping, and Horn's robust method (Table 2).14
Discussion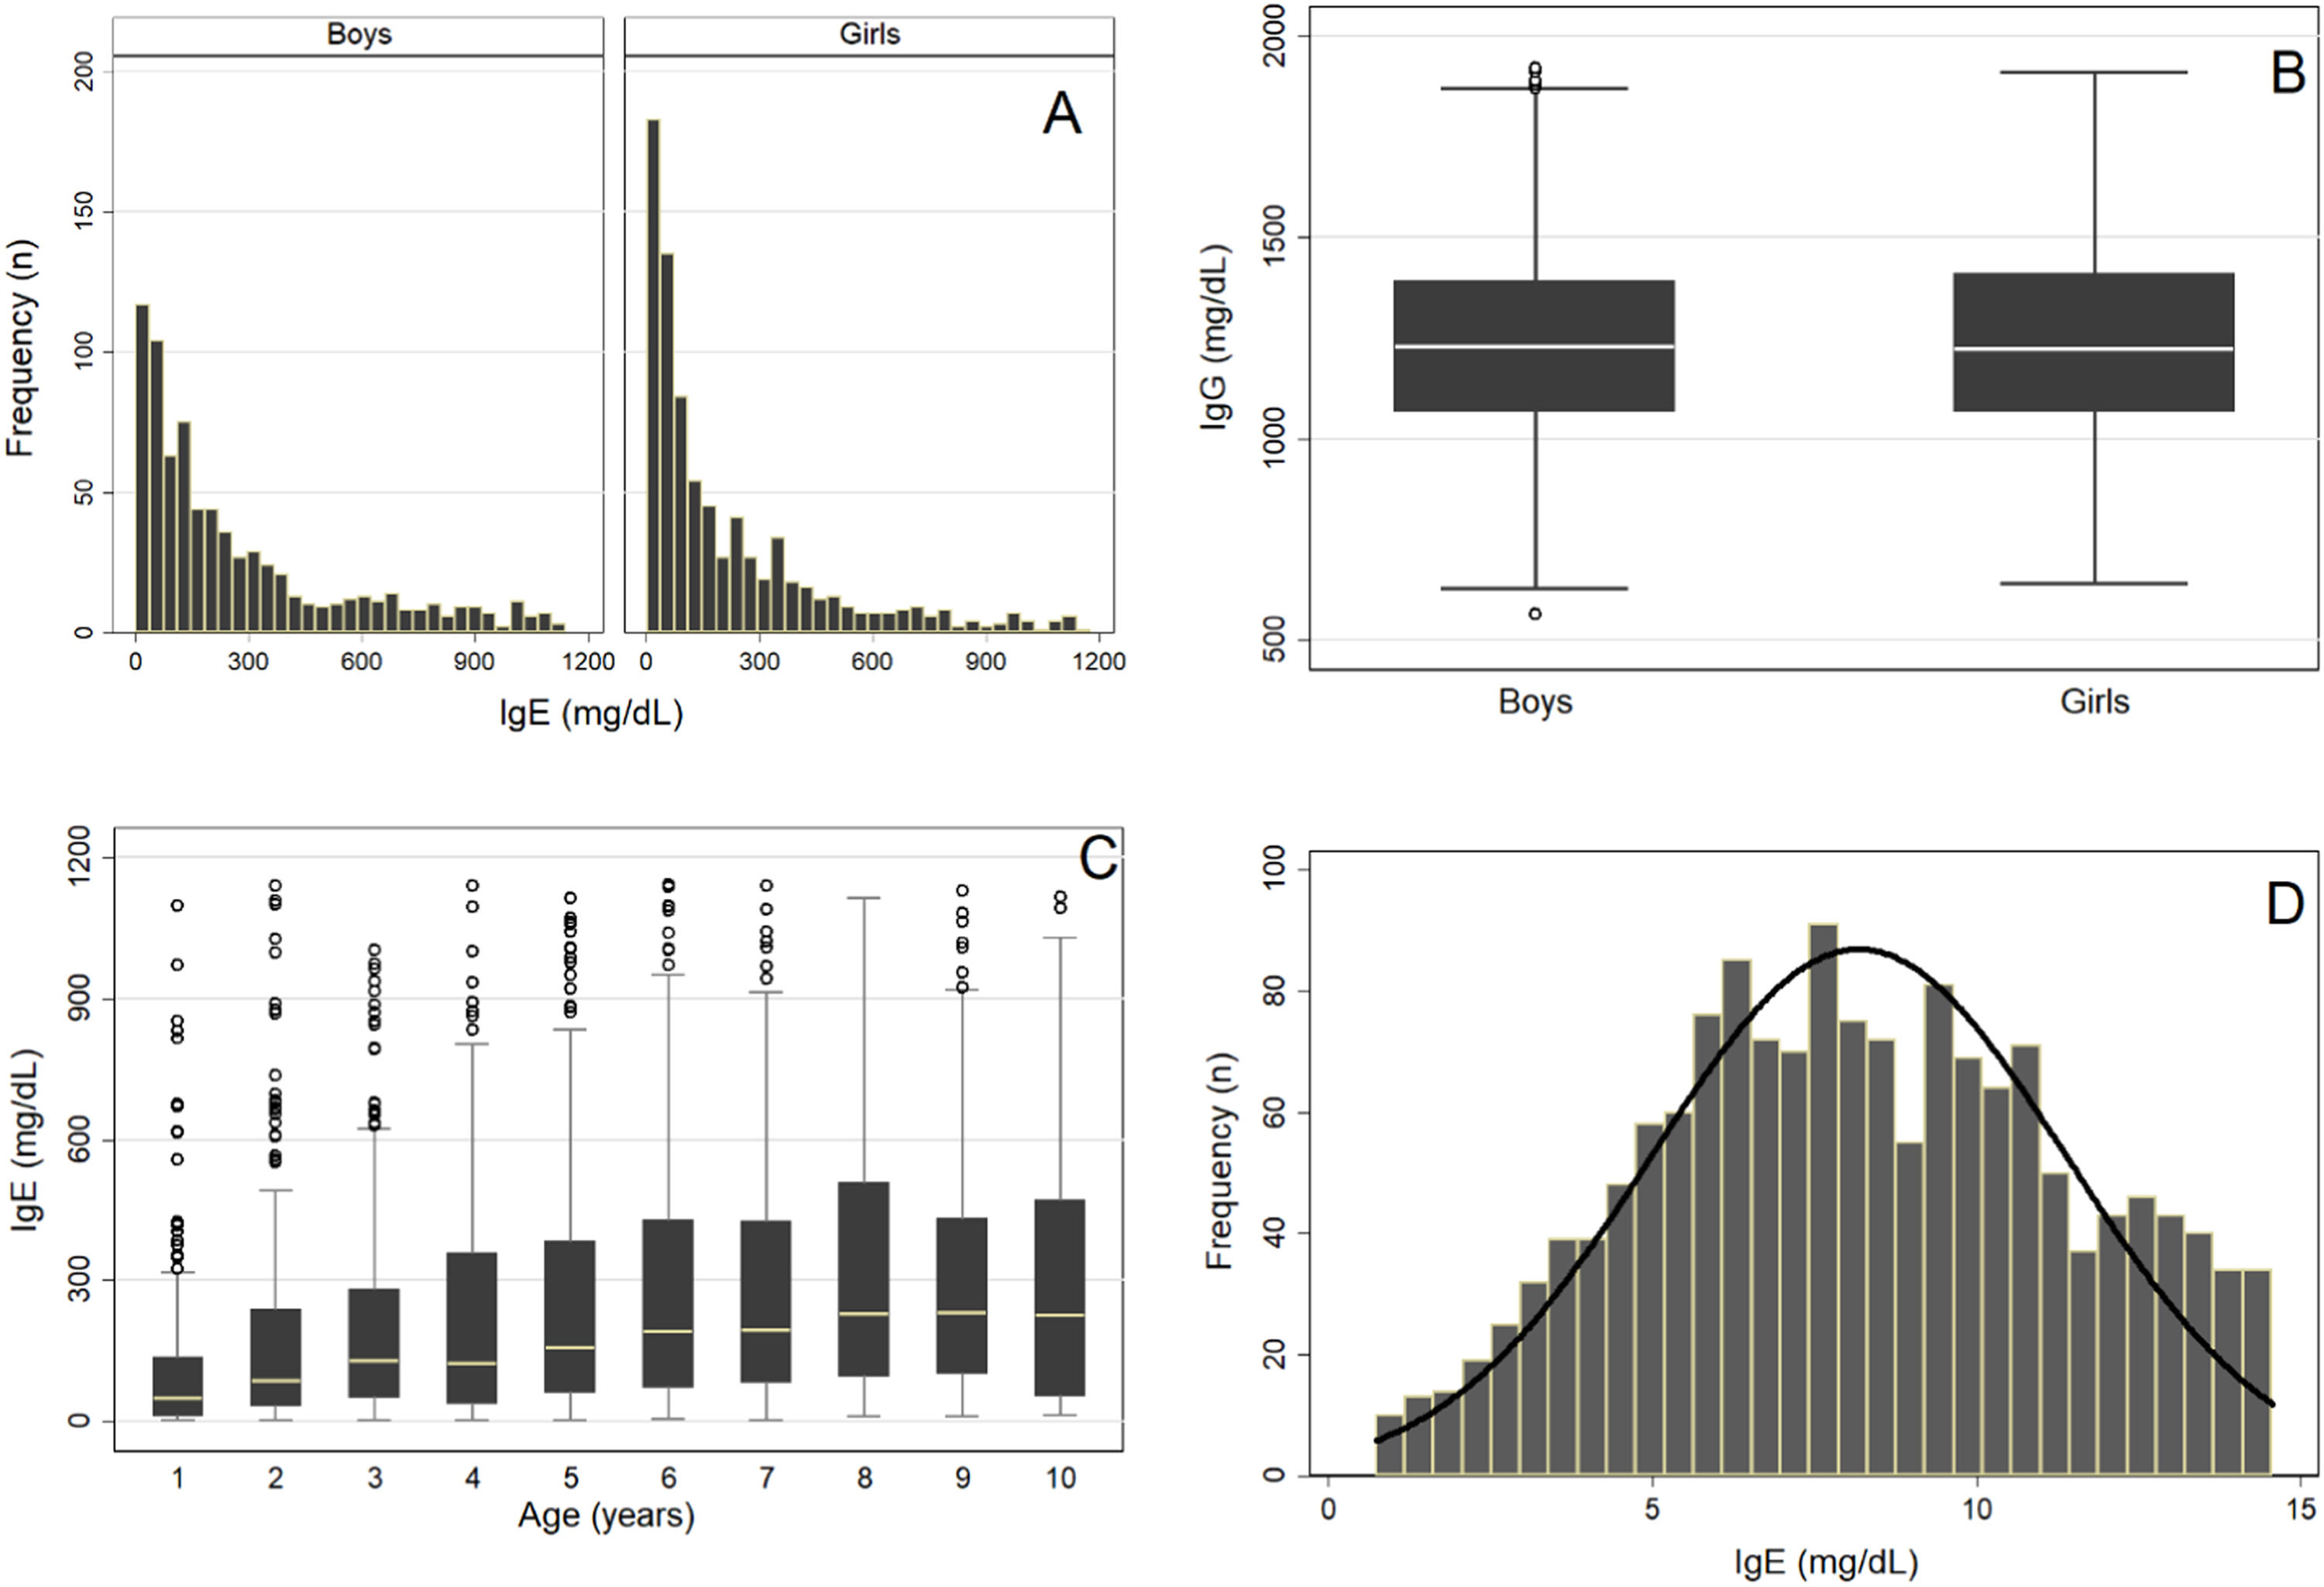
In this study, the RI of serum IgG, IgM, and IgE levels were determined for a population of 1743 healthy children of both sexes aged 1–10 years, which was representative of the Brazilian population.
The determination of RI for biological analytes, especially regarding the population and pre-analytical and analytical care, is a demanding task. This article continues a previous one, which established the RI of serum IgA in the same population.9 The present study is the first Brazilian study to determine the RI of serum IgG, IgM, and IgE levels in a representative sample of children living in central Brazil. The RI proposed here was determined by the nonparametric rank (2.5th and 97.5th percentiles) and bootstrap methods, as well as Horn's robust method.14 Pre-analytical care for sample definition and the use of robust statistical analysis methods are recommended by the CLSI in document C28-A3.1 This is the first study to determine immunoglobulin RI in a representative sample of healthy Brazilian children using the methodology recommended by the CLSI.1 All other studies that investigated serum immunoglobulin levels in Brazilian children presented some selection bias for obtaining the sample from children at health services or children of employees invited to participate in the research, or for using a different methodology for dosing the analyte to obtain the RI.4–6
Race and ethnicity factors interfere with the RI of several analytes.3,15-18 The present sample had a predominance of brown children (64.7 %), followed by white (20.0 %), black (12.4 %), and Asian (2.9 %) participants. The lack of indigenous children is explained because Cuiabá is located in the southern region of Mato Grosso, distant from indigenous communities located in the north, northeast, and northwest regions of the state. Despite being regional, the ethnic distribution of the population evaluated in this study presents characteristics similar to those of the rest of the Brazilian pediatric population (IBGE, 2022).19 Adeli et al. (2017) studied the Canadian population in the CALIPER project,3 which included participants from several origins (Caucasian, South and East Asia, Africa, and the Caribbean, among others), and found a significant difference between at least two ethnic groups for 26 % of the analytes. Other studies have reported similar results.15-18 This reinforces the importance of knowing the RI specific to the population they will be applied to, not those obtained in other countries.
An important aspect in determining the RI of any analyte is the quality of the sample, which is emphasized in the CLSI guidelines for obtaining a reference group composed of reference individuals of a reference population.1 The present sample was mostly composed of normal-weight, disease-free children, with healthy clinical histories, who were effectively breastfed in the first year of life, completely vaccinated, and had an adequate growth profile.9 The decision to include children of all nutritional classes in the study was based on the need to determine the RI of serum IgG, IgM, and IgE levels for all the subgroups proposed, provided that they were healthy.
The upper and lower RI limits of serum immunoglobulin levels obtained in this study differ from those found by Colantonio et al. (2012) and Adeli et al. (2017) as part of the CALIPER project.3,20 The results of these studies were compared because their authors pioneered the use of the methodology proposed by the CLSI. The immunoglobulin RI obtained in this study by the rank method was different from the ones published by those authors. Although the method proposed by Harris & Boyd (1990) was used in the three studies, the subgroups by age used to determine the RI were different. Even though the statistical methodology was the same, the samples differed in several aspects, and the clinical chemistry platforms were different.
Colantonio et al. (2012) studied 2188 children and adolescents aged 0–18 years and reported serum IgM RI separated by sex, which corroborates the results of this study.20 However, stratification by age was unnecessary in their study because it determined only one RI for the 1–18 age group, whereas in the present study, there was a need for dividing the sample into two age groups with different RI for boys and girls. The RI difference between boys and girls was small; thus, the real clinical need for separate RI should be analyzed in other studies.1
Colantonio et al. (2012) and Adeli et al. (2017) reported IgG RI by age groups (1–3, 4–9, and 10–18 years), with no need for division by sex.3,20 The results of those studies, in which there was no need to divide the sample by sex or age group to define the IgG RI, do not corroborate the results of this study. The present study determined only one RI for children aged 1–10 years of both sexes. Colantonio et al. (2012) and Adeli et al. (2017) did not determine the RI of serum IgE levels. Therefore, the results of the present study could not be compared.
The population of those studies included several ethnic groups: Caucasians (Canadians of European descent born in Canada or children of parents from Western European countries), East Asians (from China or other East Asian countries), and South Asians (from India or Bangladesh). As previously discussed, the differences between Canadian and Brazilian children suggest the influence of ethnic, social, and/or environmental differences on serum immunoglobulin levels.3,15-18
The CLSI C28-A3 guideline recommends the nonparametric method as the method of choice for calculating RIs using samples with 120 or more participants1 and bootstrap and Horn's robust methods to compare the resulting RIs with those determined by the empirical ranking method and to evaluate its effectiveness to remove possible outliers that could impact the final result. The RI of IgM, IgG, and IgE levels obtained by the rank and bootstrap methods were the same; however, each limit had a slightly different 95 % CI. This finding shows the high statistical power of the sample, confirming that the rank method is reliable in determining the RI of samples with 120 or more participants and justifying the CLSI choice (2008). The Horn's robust method resulted in upper limits similar to those found with the two previous methods, but the lower limits of the RI appear different. This could be due to the fact that the robust method is for small samples of 40–120 participants (Horn & Pesce, 1998). In this study, the Horn's robust method was less accurate than the rank and bootstrap methods because the smaller subgroup had 180 participants. Another explanation could be the result of the extra round of outlier removal from the Horn method, which may have shifted the robust limits to smaller values. Thus, considering that it is a simple calculation, the RI obtained by the rank method can be used safely. However, this presumption should be further analyzed to confirm whether the subgroups determined by the statistical method are clinically justified. For example, in the IgM subgroup of boys, the separation of children aged 1–2 years from those aged 3–10 years was defined by a small difference (only 0.2) between the Z-score and the Z-critical.
In summary, the RI of serum IgG, IgM, and IgE levels were determined for the first time in Brazilian children aged 1–10 years following the criteria recommended by the CLSI.1 This study will be useful to stimulate future research in other regions of Brazil, making analyte RI more reliable for diagnosis and decision-making in pediatric clinical practice in the country.
Authors’ contributionsSandra Breder Assis: Conceived the study, participated in data collection, analysed the results and wrote the manuscript.
Natasha Slhessarenko: Conceived the study, participated in data collection, analysed the results and revised the manuscript.
Cor Jesus Fernandes Fontes: Analysed the results and revised the manuscript.
Funding sourcesThis work was partially supported by Alta Excelência Diagnóstica - DASA in Alphaville (SP), who performed all lab tests.
The authors thank the directors and technical team of Alta Excelência Diagnóstica - DASA for performing the immunoglobulin dosing free of charge.


