


To determine reference intervals (RI) for serum immunoglobulin A (IgA) levels in healthy children aged 1 to 1 0 years residing in the central region of Brazil.
MethodsThis cross-sectional study was conducted on 1,743 healthy children randomly selected from kindergartens and public schools in Cuiabá, MT, Brazil. The IgA RIs were defined using the statistical methods postulated by the guidelines of the United States Clinical and Laboratory Standards Institute, the nonparametric bootstrap method, and Horn's robust method after the correction of discrepancies by Tukey's, Dixon's, and Horn's methods, respectively. The results were defined based on the values contained between the 2.5th and 97.5th percentiles and their respective 95% confidence intervals.
ResultsPartition by sex was not necessary to determine the IgA RI of the studied children. Homogeneous subgroups were identified among children aged 1–<2, 2–<5, and 5–<11 years, whose IgA-specific RIs were determined.
ConclusionThe serum IgA RIs were established for three groups of Brazilian children aged 1–11 years, which differed from those currently applied in Brazilian pediatric practice and from those defined by international studies. This definition will help Brazilian pediatricians formulate an accurate diagnosis and facilitate decision-making.
Reference intervals (RIs) are fundamental for clinicians to properly interpret quantitative laboratory test results and are essential for assessing patients’ health and assertive clinical decision-making. About 80% of clinical decisions are based on RIs that represent the central distribution of 95% of the healthy population.1 RIs are a health benchmark against which test results are compared. Although their concept and usefulness seem simple, the process required to obtain a reliable estimate is considerably complex. Many laboratories provide pediatric test results using RIs obtained from adult populations and hospitalized pediatric populations or using inaccurate technologies.2 In general, in clinical practice, many RIs used for interpreting laboratory test results are regarded as inaccurate, and their application among pediatric patients is considered inappropriate. Such inappropriate use of RI impacts clinical decision-making and has potentially detrimental effects on the quality of patient care, including misdiagnosis, delayed diagnosis, inappropriate treatments, and other risks. These critical gaps in pediatric health require an urgent need to update and establish age-appropriate RIs for pediatric populations. For this reason, the Clinical Laboratory Standards Institute (CLSI-2010) guideline C28-A3c1 defined, established and verified the age-appropriate RI using robust statistical methodologies.
The world medical literature includes some population surveys to define the analyte RI for different age groups, especially for the pediatric group.3–8 CALIPER (2017),3 a database derived from a large Canadian study conducted in thousands of children and adolescents, determined the RI of more than 100 analytes evaluated in this age group using the CLSI-20101 methodology, which is currently used as a major reference for the interpretation of pediatric laboratory results worldwide. Although it includes different ethnicities, the CALIPER3 does not represent the populations of several continents and regions worldwide. Many studies published the RI for children and adolescents from a region or country with the objective of establishing a reference value specifically for their population.4–9 In Brazil, a few studies determined the reference values for immunoglobulins. Some of them used outdated laboratory methods, and samples and statistical methods that did not meet the standards recommended by the CLSI.10–12
Zellner et al. (2019)13 evaluated statistical methods for sample definition and treatment recommended by the C28-A3c guideline1 and reported that the methods used to eliminate discrepant values were too complacent, suggesting the use of more robust methods for their detection. For this reason, this study aimed to use the methods proposed by the C28-A3 guidelines along with the methods used for removing the outliers, such as Tukey's,14 Dixon's,15 and Horn's16 tests.
The ethnic composition of the Mato Grosso population is the result of intense miscegenation occurring in two historical moments: 1) during the colonial period, among Indigenous, black, and migrant people from São Paulo, a state in the southeast region of Brazil, and 2) from 1970 onwards, when there was intense migration of people from the south, northeast, and southeast regions, stimulated by a government program aimed at increasing the population in the interior of Brazil. The population in Cuiabá, the oldest city in the state of Mato Grosso, was formed through the migration and miscegenation of several people.17 Therefore, almost half a century after this last migratory movement, it is plausible to infer that the children who currently live in the city are, in fact, representatives of the great majority of the Brazilian child population.
The present study aimed to establish the RI of serum IgA levels in a sample of healthy Brazilian children aged 1–10 years. It is part of a larger study aimed at determining the RI and decision limits for serum levels of several analytes, including all classes of immunoglobulins in healthy children aged 1–10 years.18
Materials and methodsThe original research, whose data were used in the present study, included 83 municipal schools and 48 kindergartens, in which 38,934 children and adolescents aged 1 to < 13 years enrolled in 201219 were considered eligible for the study. The number of classrooms in these schools was similar to that in the four regions of the city (approximately 13 classrooms), with about 30 students per classroom. Kindergartens had only one room, with no more than 15 children per room. Due to this homogeneity, a cluster sampling procedure was used in selecting five schools and five kindergartens per region. As children aged 1–2 years were only found in 10 kindergartens, 5 of them were drawn to include all children in this age group. Thus, 20 schools and 25 kindergartens were selected for this study. The original sample was calculated based on the CLSI document, which recommends a minimum of 120 participants per subgroup to define the RI of any analyte.1 Thus, considering the proposal to study 12 age groups (those aged 1 to < 13 years), the required sample is 1440 participants. However, to correct for the cluster sampling effect and compensate for possible losses (absence or refusal), the number was increased by 30%, resulting in an estimated sample of 1872 children. After accounting for the losses and exclusions foreseen in the study, the final sample was reduced to 1865 children. A subsample of 1743 children aged 1 a 10 years, 11 months and 29 days years was selected to determine the serum IgA RI (Figure 1A).
 Flowchart of the sample selection process. (B) Methods used for serum IgA RI calculations in healthy children.")
Children without any known underlying disease, clinical signs or symptoms, and health-related complaints at the time of blood sample collection were included in the study. Those who did not take regular medications, except ferrous sulfate in prophylactic dose, were also included. Parents or guardians completed a 130-question questionnaire to evaluate the demographic and social data and clinical history of the family members and the child. Nutritional status was assessed using body mass index/age and weight/height z-score for 1–2 years. It was classified according to the 7 categories proposed by the WHO (2011).20 All nutritional categories were included, provided that they did not show evidence of comorbidities. Thus, nutritional deviations were not considered exclusion criteria. The serum IgA levels were measured using the nephelometric method. The analyses were performed on the Siemens BN II device at Laboratório Cedilab, a member of the Diagnósticos da América (DASA) network, in Cuiabá.
The IgA RI determination followed the standard approach to verify RIs recommended by the CLSI (EP28-A3c) guideline for routine clinical laboratories.1,21 The data obtained were analyzed in scatter and box plots to eliminate the extremely discrepant values using Tukey's method.14 The need for sex and age group partition was determined based on the analysis of the variance ratio and standard normal deviation of serum IgA values.22 After the identification of the necessary partitions, the distribution of IgA values was reassessed; the distribution appeared symmetrical if the asymmetry coefficient was between –1 and +1.23 In the case of skewed distribution, the IgA data with asymmetric distribution in the partitions were normalized by Box-Cox transformation. Then, the duplicate Tukey's14 method was used for new identification and elimination of discrepant values in each partition. After this, the IgA serum RIs were determined using the empirical method, that is, those constant between the 2.5th and 97.5th percentiles along with their 95% confidence intervals (CIs). RI was also calculated using the nonparametric bootstrap method to compare the results obtained using the empirical method, as recommended by the CLSI; the RI was determined by other methods available in the literature, with the discrepant values identified and eliminated using the Dixon's method16 and the Horn's robust method (Figure 1B). As our data set had groups with n < 120 children or had a high number of outliers, the authors used the robust approach to determine the RI. This methodology consistently yields upper reference interval values that were closer to those of the true underlying distributions, as proposed by Horn, Pesce and Copeland (1998).17 Analysis was performed using Stata Package version 12.0 (StatCorp, Texas, USA), R Package version 4.2.2 (R Foundation, Vienna, Austria), and RefVal program for statistical treatment of medical reference values version 4.11 (Department of Clinical Chemistry, Oslo, Norway).
The study was approved by the Research Ethics Committee of Júlio Muller University Hospital (#947/2010) and USP School of Medicine (#318/2011) prior to the data collection, and the use of a repository derived from it was approved by the HUJM (#4,870,067/2021).
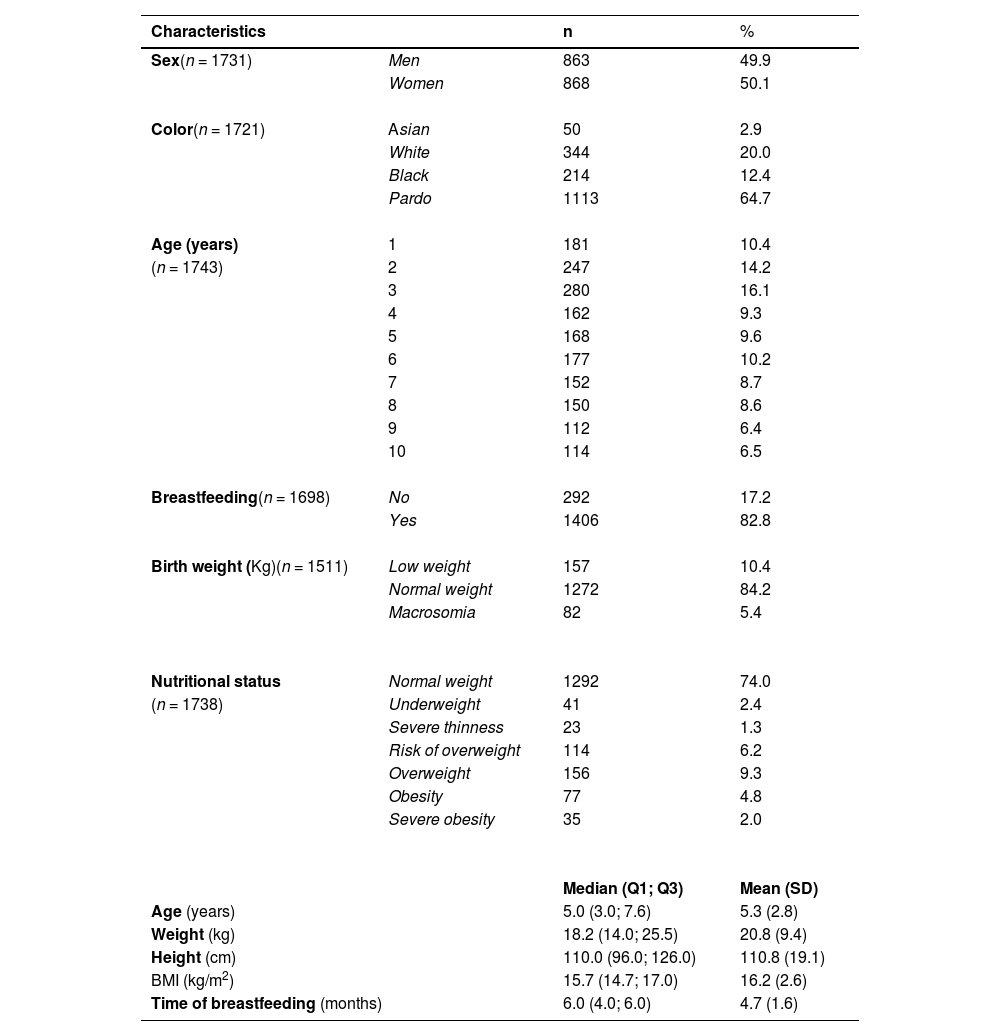
ResultsThe sociodemographic, perinatal, nutritional, and anthropometric characteristics of 1743 healthy children are presented in Table 1. The proportions of female and male children were similar in the sample. Brown children were more predominant (64.7%), followed by Whites (20.0%), Blacks (12.4%), and Asians (2.9%). The mean (SD) age was 5.4 (2.8) years, with a higher proportion of children aged 2 years (14.2%) and 3 (16.1%) years.
Sociodemographic, perinatal, and anthropometric characteristics of healthy children from the municipality of Cuiabá, MT, Brazil.
Variation in n refers to the lack of information about the respective variable.
Of the 1743 children selected, 1292 (74%) had normal weight. Meanwhile, 41 (2.4%) children presented thinness, 23 (1.3%) severe thinness, 114 (6.2%) were at risk of being overweight, and 156 (9.3%) were overweight. Of the total sample, obesity was found in 77 (4.8%) children and severe obesity in 35 (2%) children (Table 1).
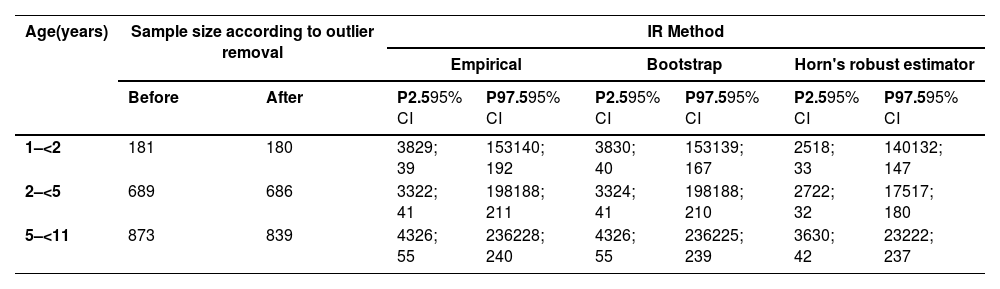
1706 children remained in the study after eliminating 37 extreme outliers through initial visual inspection of the histogram and boxplot and calculations applying the Tukey method3 (1.5 times the interquartile distance (IDQ)) children. In the partition determination step, applying the Dixon and Tukey duplicate methods (3 DIQ),3 only one outlier was removed. With 1705 children, the RI was calculated using the 2.5th and 97.7th percentiles (empirical method) and by boostrap and Horn's robust method (Table 2).
Estimation of IgA RI using empirical, bootstrap, and Horn's robust estimator methods in children aged 1–11 years.
Unit: mg/dL.
P: percentile.
95% CI: 95% confidence interval.
The serum IgA concentration in the sample was homogeneous between boys and girls (Figure 2A), with no need for the determination of a specific RI by sex. This homogeneity was not observed among the ten age groups evaluated (Figure 2B). Age group 1 showed slight asymmetry in relation to the other groups (1.1) and underwent BoxCox transformation. Thus, three age groups with IgA homoscedasticity were identified, with specific RI determined for children aged 1–<2 years, 2–<5 years, and 5–< 11 years.
, age (B), and partitions by age group (C).")
Different serum IgA RIs were established for children aged 1–11 years. Using the empirical method, the 2.5th and 97.5th percentiles (95% CI) obtained for the 1–<2-year age group were 38 (29; 39) mg/dL and 153 (140; 192) mg/dL, respectively. For the 2–< 5-year age group, 33 (22; 41) mg/dL and 198 (188; 211) mg/dL, respectively; and for the 5–<11-year age group, 43 (26; 55) mg/dL and 236 (228; 240) mg/dL, respectively. The RIs were also determined using the nonparametric bootstrap and Horn's robust methods (Table 2).
DiscussionThis study determined the RI of IgA for Brazilian children aged 1–11 years using different analysis methods. The determination of RI for biological analytes requires the utmost attention and considers the representativeness of the population sample and the pre-analytical and analytical care required. This was the first Brazilian study to determine the RI of serum IgA in a representative sample of children aged 1–11 years residing in a municipality of the central region of Brazil. All other studies investigating the serum IgA levels of Brazilian children presented selection or information bias either due to the selection of samples from healthcare centers or from family members of employees invited to participate in the research, or due to the use of different statistical methods for analyzing the analyte dose.10–12
Horn and Pesce (2003)24 and Tahmasebi et al. (2020)25 reaffirmed the role of race and ethnicity as factors that interfere in the RI subdivision. Although the study was conducted at a regional level, the population assessed presented characteristics remarkably similar to those of other Brazilian pediatric populations, whose ethnic distribution resembles that of the children studied here (IBGE, 2022).26 This aspect reinforces the importance of identifying the appropriate IgA RI for the pediatric population instead of using those obtained from children who participated in studies evaluating the IgA RI in other countries. The absence of indigenous children is due to the fact that Cuiabá is located in the southern region of Mato Grosso, far from indigenous communities found in the north, northeast, and northwest regions of the state.
An important aspect in determining the RI of any analyte is the quality of the sample. In addition to having no diseases, the study population should comprise participants with positive clinical history, such as those breastfed in the first year of life, who received complete vaccination, and with adequate growth profiles. In this study, the proportion of children with a history of breastfeeding was relatively higher than that reported in Brazil, with the studied children having an exceptionally good median breastfeeding duration (Table 1). Data from the National Survey of Infant Food and Nutrition27 showed that 45.8% of Brazilian children were exclusively breastfed in the first 6 months of life, while 53.1% of them were breastfed until the first 12 months of life.
Most children in the sample were born with normal weight and presented normal weight at the time of blood collection. The decision to include children of all nutritional classes in the study was based on the need to determine the IgA RI for the entire proposed population, provided that they were healthy before and at the time of the study. Children at weight extremes, that is, those with severe thinness or obesity, represented only 10.6% of the sample (Table 1).
The IgA RI obtained in the study should be interpreted based on similar results from international studies using the currently recommended method. In the case of IgA, the method for RI determination recommended by international regulatory organizations determined that partition by sex was not necessary.3 However, age partitions were always necessary,3,4,6,7 but differed from those identified in this study. This finding reinforces the hypothesis that the RI produced for populations that extremely differed from those used in clinical practice may not reflect the real analyte concentration during childhood.
It remains challenging to compare the results of the present study with those produced by international studies using the same method to determine RI due to the differences in the origin of the sample, the partitions, and the equipment used for immunoglobulin dosing. The serum IgA RI obtained in this study using the classical percentile method was different from that published by CALIPER.3 In the latter study, the RI obtained by the empirical 2.5th and 97.5th percentile method for age groups 1–<3 years, 3–<6 years, and 6–<14 years were 0–100 mg/dL, 30–160 mg/dL, and 50–240 mg/dL, respectively. Although the Harris and Boyd method22 was used in both studies to identify the partitions, the age groups, and RI obtained differed.
Although the IgA RIs have already been determined in some Brazilian studies, these RIs should be cautiously compared with the results of the present study. Naspitz et al. (1982)10 highlighted the importance of determining the normal serum immunoglobulin levels in Brazilian children as it is difficult to characterize the primary and secondary immunodeficiencies in Brazil using foreign reference tables. Their study evaluated the immunoglobulin levels of 280 healthy children examined in the pediatric outpatient clinics of the Paulista Medicine School and USP and determined the values that were still used as reference.28 The radial immunodiffusion method was used for determining the serum IgA level, which is no longer used today. In a Brazilian doctoral thesis conducted by Fujimura (1990),11 the serum immunoglobulin A, E, M, and G levels were determined using the nephelometry method as well as their subclasses in adults and in normal and nephrotic children. Kallaur et al. (2007)12 studied children and adults to investigate the changes in normal serum immunoglobulin A, E, M, and G levels using the values reported by Naspitz et al. as reference. The objective of this last study was not to determine the RI of immunoglobulins, but only the frequency of changes in their serum levels in a population aged 1–13 years at a university hospital in Londrina, PR, Brazil. These studies did not use robust statistical methods to define the sample size or determine the group by age or sex when necessary. No criteria were established for defining the discrepant values or for determining whether these discrepant values were maintained or eliminated during the analysis of results. Therefore, it is not possible to compare the results of those studies with those of our study.
Observing Table 2, the authors see that the RI obtained by the empirical and bootstrap methods are the same, although the 95% CI of each limit is slightly different. The empirical method consists of ranking the values obtained and identifying those that occupy the 2.5th and 97.5th percentiles as lower and upper limits, respectively. The bootstrap method consists of repeated resampling of the sample from the population from which it was extracted. In this way, the resamples obtained from this sample represent what the authors would get if we took several samples from the population. The authors could verify that the empirical method is very reliable for determining the RI of samples > 120 individuals, according to other authors.25 Horn's robust method, on the other hand, obtained results close to the previous ones in the upper limit of the interval, but the lower limit was lower. This methodology consistently yields upper RI values that were closer to those of the true underlying distributions,16 because it is indicated for small samples (>40 e <120 individuals). As our smallest group has 180 individuals (Table 2), this method would be less accurate than those mentioned above.
In summary, the serum IgA RI for Brazilian children aged 1–11 years were determined for the first time using a representative population-based sample in accordance with the criteria recommended by the CLSI1 for sample definition, identification, and treatment of discrepant values, and using robust statistical methods for RI definition. The method used to determine the serum IgA RI applied in this study may be useful in future studies conducted in other regions of Brazil, thus increasing the reliability of RI in diagnosing diseases and in making appropriate decisions in the Brazilian pediatric clinical practice.


