This study had the purpose investigate the physical activity (PA) and sedentary time profile of children with cerebral palsy and its association with body composition.
MethodsA cross-sectional study evaluated 53 children, between 2 and 10 years old, enrolled in three health services Recife-city, northeast of Brazil. Sedentary and PA were measured for a week using the ActiGraph GTX3 accelerometer. Body composition was assessed by anthropometry and an electrical bioimpedance device.
ResultsTime on PA was one hour longer among the mild/moderate CP compared to severe ones, but, sedentary time is similar. Dyskinetic children spent more time in PA, but also in sedentary activities (15.5 hours a day) than spastic ones (12.8). Stunting occurred in 15 (30%) of the sample, all children with stunting had severe impairment. Underweight occurred in 25% of the severe group and 11.8% in the mild/moderate group. Overweight affected 3% of the sample; no overweight children were in the severe group. Body fat% was inversely related to time spent in moderate to vigorous PA.
ConclusionsChildren with CP spend more than a half of their daily time in sedentary activity. In contrast, children with mild to moderate CP spent twice as much time in moderate to vigorous PA and had a tendency (p = 0.07) to spend 50% more time in light PA. Moreover, time spent on moderate to vigorous activity was inversely related to fat mass.
Physical activity (PA) has been associated with lower rates of adiposity and risk of metabolic syndrome among neurotypical children.1 Likewise, sedentary activity, characterized by time spent in activity, in the sitting or reclined position with low energy expenditure (<1.5 METs/hour), is strongly associated with poor quality of life and health.2 In the context of cerebral palsy (CP), however, as far as the authors know, there is only one study[1] that showed the relationship between physical and sedentary activities with adiposity, health, and quality of life in this population.
Children with CP have the motor and functional impairments which cause mobility limitations.3 As a result; children with CP tend to spend extended time in uninterrupted sedentary behavior. However, it is vital to understand that sedentary behavior is not voluntary for children with CP. Therefore, sedentary activity in children with CP may have different determinants and outcomes from those found in the general population.4 Environmental issues such as economic status, family perceptions, social participation, health care, and school access could interplay with biological aspects (body structure and function) modifying mobility patterns of children with CP.3
CP is a heterogeneous condition with different typologies, classifications and clinical characteristics.5 Thus, there may be different responses to physical and sedentary activity according to the type of the disorder (Dyskinetic or spastic) and the degree of motor impairment. Children with more severe motor impairment have more difficulty being active than those with mild impairment.6 In addition to altered muscle tone and strength, individuals with CP may have sensory, perceptive, cognitive, communication or behavioral disorders that affect physical and sedentary activity in different ways.7
Body composition in CP is influenced not only by nutritional aspects but; also non-nutritional (immobility, neuroendocrine abnormalities, inadequate muscle trophism, atypical movement patterns, type of CP, and severity of motor impairment) impacts on adiposity.1,2 Although children with CP face a similar risk of unfavorable outcomes due to excessive adiposity as neurotypical children,8,9 the pathways through which physical and sedentary activity affect body composition in these children remains unknown. Moreover, these pathways may be mediated by motor impairment and type of CP. Therefore, this study aims to investigate the physical activity and sedentary time profiles of children with cerebral palsy and its relation with body composition.
MethodsA Cross-sectional study evaluated Children between two and ten years old with cerebral palsy recruited from three outpatient clinics (a pediatric gastroenterology outpatient clinic for patients with feeding difficulties and two physical therapy services) in Recife, Northeast of Brazil. In order to correlate PA with body composition, the authors estimated a sample size of 55 children, assuming 80% power, α 0,05 error, and 0,15 effect size. The children were evaluated by anthropometry, body composition measures, and assessments of physical and sedentary activity. Finally, food intake was estimated using a 24-hour diet recall. In addition, the main caregivers were interviewed through a structured form, prepared by the main researcher, on the sociodemographic and clinical issues of the participating children.
The motor impairment was defined by the Gross Motor Function Classification System (GMFCS) on mild/ moderate (levels I to III) or severe (levels IV and V).7 This study received approval from the Human Research Ethics Committee of the Federal University of Pernambuco, accordingto National Health Council, Ministry of Health, Brazil (process number: 2.006.558; certificate number: 6125.1316.6.0000.5208) and informed consent was obtained from all caregivers.
AnthropometryHeight was measured using the standard method with a pediatric stadiometer for those who were less than one meter. For the others, tall knee height (KH) was measured and height (H) was estimated using the formula H (cm) = (2.69 x KH) + 24.2. Weight was calculated using the difference between the weight of the caregiver and the child wearing minimal clothing in the caregiver's arms and the weight of the caregiver alone. Weight, height and body mass index (BMI: kg/m2) were classified in z-scores using the World Health Organization Growth Charts.10
Body compositionBody composition was estimated through electrical bioimpedance analysis (BIA) using the Maltron BF-906 device (Maltron, United Kingdom) with four surface electrodes. The children were positioned in the supine position on a non-conductive surface (mat) with the legs and arms at 45° abduction. When necessary, the skin of the participants was cleaned with alcohol at the points of contact with the electrodes. Two electrodes were positioned on the right hand at the third metacarpus and wrist and the other two were positioned on the dorsum of the right foot at the third metatarsus and ankle (between the malleoli). The distance between the pairs of electrodes was 3 to 5 cm. The children were evaluated barefoot, with minimal clothing and no metal accessories (watches, rings, belts, earrings, etc.).11 For the analysis of the BIA variables, crude percentage measures of fat mass and lean mass in kilograms (kg) and the lean mass index (kg divided by height in meters) were evaluated as continuous variables.
Measures of physical and sedentary activityThe physical and sedentary activity was measured using a triaxial accelerometer (Actigraph GT3X) for seven consecutive days attached to the right side of the waist with an elastic strap, which was removed only when the child took a bath or performed aquatic activities. The caregivers were also instructed to record the type of activity the child was performing at a given time and date in the child's log. During the course of the week, the caregivers were contacted to encourage and guide the use of the accelerometer and the recording of the information in the log. The time spent sleeping was calculated as the difference between the number of hours in the day and the number of hours spent on a physical and sedentary activity.
The ActiLife 6.10 program was used for the reduction accelerometer data. Valid data were considered the use of the accelerometer at least three days during the week (one of which was a weekend day) at least five hours per day.12 Periods of time longer than 60 min without any record were considered periods of non-wear time. The epoch used in the download of the accelerometer data was 15 seconds, which is recommended for samples in this age group.13
The cutoff points suggested by Evenson et al.14 were used to determine the duration of the time of physical activity on different intensities: 101-2295 counts/min = light physical activity; 2296-4011 counts/min = moderate physical activity; > 4012 counts/min = vigorous physical activity; and > 2296 counts/min = moderate to vigorous physical activity. The duration of physical activity was determined from the mean of the sum of the time spent on physical activity at each intensity level, dividing by the number of valid days of accelerometer use for each child. Children with less than three valid days of records were considered dropouts.
A cutoff point of < 100 counts/min was used to define sedentary activity.15 Bouts of sedentary activity were defined as uninterrupted times of sedentary activity lasting 1 to 4 min, 5 to 9 min, 10 to 14 min, 15 to 30 min, and ≥ 31 min and expressed as frequency (mean number per day).16
Data analysisThe main researcher entered the data into the EPIINFO statistical version 3.4.5 twice to verify the accuracy of the inputs. The subsequent analyses were performed using the Statistical Package for the Social Sciences (SPSS, version 16.0). The Kolmogorov-Smirnov test was used to determine the normality of the data. Variables with normal distribution were expressed as mean and standard deviation values and compared using the Student's t-test for independent samples. Variables with non-normal distribution were expressed as median and percentiles and compared using the nonparametric Mann-Whitney U test. Categorical variables were expressed as percentiles and compared using either the chi-squared test or Fisher's exact test, when appropriate. Durations of physical activity, sedentary activity and sleep were body composition using the β calculation through logarithmic regression employing the enter method of the SPSS program. For all analyses, a p-value < 0.05 was considered indicative of statistical significance.
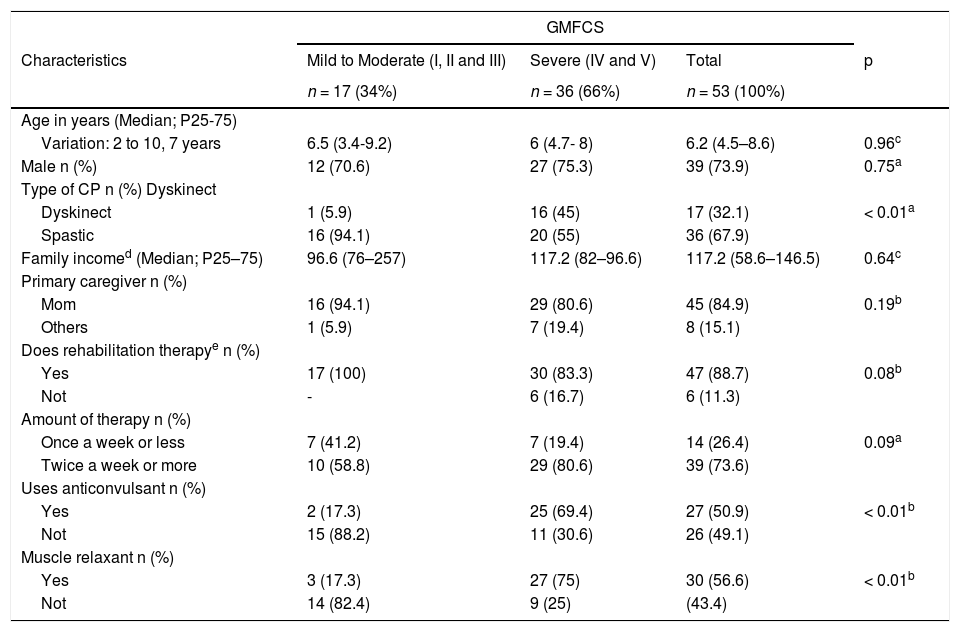
ResultsA total of 72 children were evaluated between April and August 2017. There were 19 dropouts: four due to the loss of records from the device; eight were unable to use the device; one was allergic to the elastic strap securing the device; one was hospitalized during the week of the recording, and five caregivers abandoned the study without communicating the reason. Therefore, 53 children were evaluated: 17 (32,1%) with mild to moderate motor impairment and 36 (67,9%) with severe one (GMFCS). As for the type, 36 (67,9%) children were spastic CP and 17 (32,1%) were Dyskinetic; 16 (94,1%) of the latter group had severe motor impairment. Age ranged from two to ten years (median: 6.2 years). The mild/moderate and severe motor impairment groups were similar regarding age, sex and family income, whereas the group with severe CP had a greater frequency of use of anticonvulsants and muscle relaxants (p < 0.0001) (Table 1).
Characteristics of 53 children with Cerebral Palsy (PC) according to Gross Motor Function Classification Scale (GMFCS).
| GMFCS | ||||
|---|---|---|---|---|
| Characteristics | Mild to Moderate (I, II and III) | Severe (IV and V) | Total | p |
| n = 17 (34%) | n = 36 (66%) | n = 53 (100%) | ||
| Age in years (Median; P25-75) | ||||
| Variation: 2 to 10, 7 years | 6.5 (3.4-9.2) | 6 (4.7- 8) | 6.2 (4.5–8.6) | 0.96c |
| Male n (%) | 12 (70.6) | 27 (75.3) | 39 (73.9) | 0.75a |
| Type of CP n (%) Dyskinect | ||||
| Dyskinect | 1 (5.9) | 16 (45) | 17 (32.1) | < 0.01a |
| Spastic | 16 (94.1) | 20 (55) | 36 (67.9) | |
| Family incomed (Median; P25–75) | 96.6 (76–257) | 117.2 (82–96.6) | 117.2 (58.6–146.5) | 0.64c |
| Primary caregiver n (%) | ||||
| Mom | 16 (94.1) | 29 (80.6) | 45 (84.9) | 0.19b |
| Others | 1 (5.9) | 7 (19.4) | 8 (15.1) | |
| Does rehabilitation therapye n (%) | ||||
| Yes | 17 (100) | 30 (83.3) | 47 (88.7) | 0.08b |
| Not | - | 6 (16.7) | 6 (11.3) | |
| Amount of therapy n (%) | ||||
| Once a week or less | 7 (41.2) | 7 (19.4) | 14 (26.4) | 0.09a |
| Twice a week or more | 10 (58.8) | 29 (80.6) | 39 (73.6) | |
| Uses anticonvulsant n (%) | ||||
| Yes | 2 (17.3) | 25 (69.4) | 27 (50.9) | < 0.01b |
| Not | 15 (88.2) | 11 (30.6) | 26 (49.1) | |
| Muscle relaxant n (%) | ||||
| Yes | 3 (17.3) | 27 (75) | 30 (56.6) | < 0.01b |
| Not | 14 (82.4) | 9 (25) | (43.4) | |
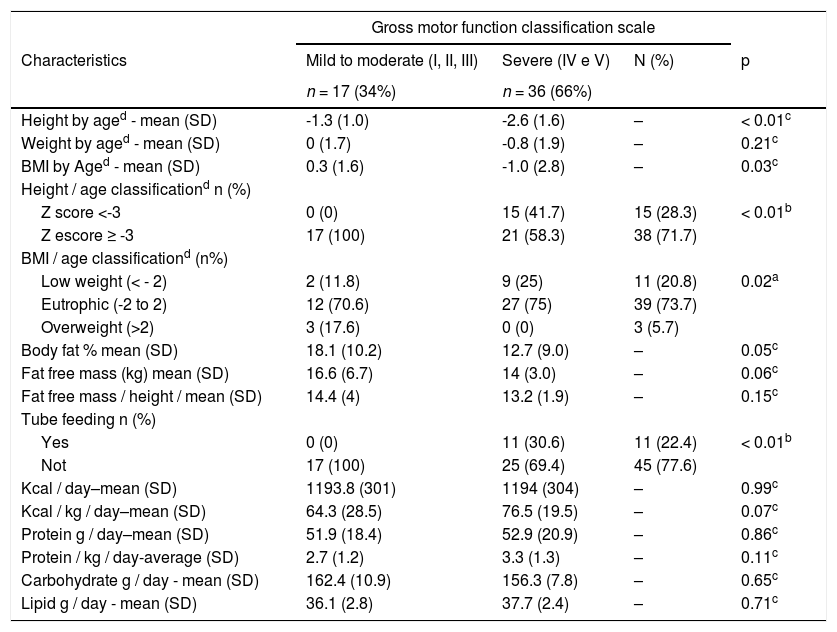
Regarding nutritional status (Table 2), children with severe CP were shorter (p = 0.003), had a greater frequency of underweight (p = 0.025) and a lower percentage of body fat (p = 0.05), despite all these children (30.6%) using an alternative feeding route for nutritional supplementation. Likewise, these children did not have a lower total intake of calories, grams of protein, fat, and carbohydrates. In addition, this same group had a lower lean mass in kg (p = 0.06); however, this difference disappeared when lean mass was corrected for height (p = 0.153).
Nutritional and dietary characteristics of 53 Brazilian children with cerebral palsy (CP).
| Gross motor function classification scale | ||||
|---|---|---|---|---|
| Characteristics | Mild to moderate (I, II, III) | Severe (IV e V) | N (%) | p |
| n = 17 (34%) | n = 36 (66%) | |||
| Height by aged - mean (SD) | -1.3 (1.0) | -2.6 (1.6) | – | < 0.01c |
| Weight by aged - mean (SD) | 0 (1.7) | -0.8 (1.9) | – | 0.21c |
| BMI by Aged - mean (SD) | 0.3 (1.6) | -1.0 (2.8) | – | 0.03c |
| Height / age classificationd n (%) | ||||
| Z score <-3 | 0 (0) | 15 (41.7) | 15 (28.3) | < 0.01b |
| Z escore ≥ -3 | 17 (100) | 21 (58.3) | 38 (71.7) | |
| BMI / age classificationd (n%) | ||||
| Low weight (< - 2) | 2 (11.8) | 9 (25) | 11 (20.8) | 0.02a |
| Eutrophic (-2 to 2) | 12 (70.6) | 27 (75) | 39 (73.7) | |
| Overweight (>2) | 3 (17.6) | 0 (0) | 3 (5.7) | |
| Body fat % mean (SD) | 18.1 (10.2) | 12.7 (9.0) | – | 0.05c |
| Fat free mass (kg) mean (SD) | 16.6 (6.7) | 14 (3.0) | – | 0.06c |
| Fat free mass / height / mean (SD) | 14.4 (4) | 13.2 (1.9) | – | 0.15c |
| Tube feeding n (%) | ||||
| Yes | 0 (0) | 11 (30.6) | 11 (22.4) | < 0.01b |
| Not | 17 (100) | 25 (69.4) | 45 (77.6) | |
| Kcal / day–mean (SD) | 1193.8 (301) | 1194 (304) | – | 0.99c |
| Kcal / kg / day–mean (SD) | 64.3 (28.5) | 76.5 (19.5) | – | 0.07c |
| Protein g / day–mean (SD) | 51.9 (18.4) | 52.9 (20.9) | – | 0.86c |
| Protein / kg / day-average (SD) | 2.7 (1.2) | 3.3 (1.3) | – | 0.11c |
| Carbohydrate g / day - mean (SD) | 162.4 (10.9) | 156.3 (7.8) | – | 0.65c |
| Lipid g / day - mean (SD) | 36.1 (2.8) | 37.7 (2.4) | – | 0.71c |
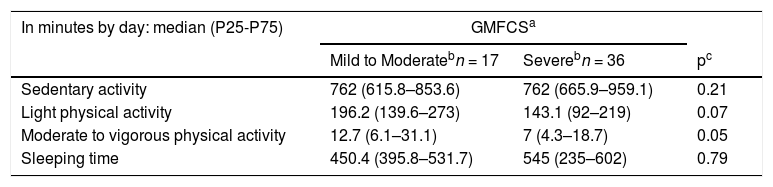
For all activity levels, the total time on PA (Table 3) was one hour longer among the children with mild/moderate CP compared to severe ones. Likewise, mild/moderate CP had more time on moderate to vigorous activity than severe ones (p = 0.059), however, both groups had, respectively, only 12 and seven min at this level of activity per day. No difference between groups was found regarding the time spent on sedentary activity (p = 0.21).
Physical activity, sedentary and sleeping time of 53 children with cerebral palsy according to motor severity.
| In minutes by day: median (P25-P75) | GMFCSa | ||
|---|---|---|---|
| Mild to Moderatebn = 17 | Severebn = 36 | pc | |
| Sedentary activity | 762 (615.8–853.6) | 762 (665.9–959.1) | 0.21 |
| Light physical activity | 196.2 (139.6–273) | 143.1 (92–219) | 0.07 |
| Moderate to vigorous physical activity | 12.7 (6.1–31.1) | 7 (4.3–18.7) | 0.05 |
| Sleeping time | 450.4 (395.8–531.7) | 545 (235–602) | 0.79 |
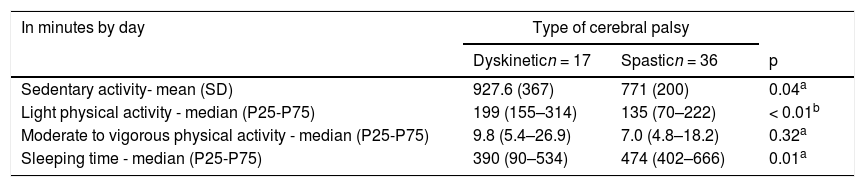
The children with Dyskinetic type CP spent more time on light PA than those with spastic CP (p = 0.005), whereas no difference between these groups was found regarding the time spent on moderate to vigorous PA. Likewise, the Dyskinetic children spent two more hours per day on sedentary activity (p = 0.049) and had 1.5 h less sleep (p = 0.012) than those with the spastic type (Table 4).
Physical activity, sedentary and sleeping time of 53 children according to type of cerebral palsy.
| In minutes by day | Type of cerebral palsy | ||
|---|---|---|---|
| Dyskineticn = 17 | Spasticn = 36 | p | |
| Sedentary activity- mean (SD) | 927.6 (367) | 771 (200) | 0.04a |
| Light physical activity - median (P25-P75) | 199 (155–314) | 135 (70–222) | < 0.01b |
| Moderate to vigorous physical activity - median (P25-P75) | 9.8 (5.4–26.9) | 7.0 (4.8–18.2) | 0.32a |
| Sleeping time - median (P25-P75) | 390 (90–534) | 474 (402–666) | 0.01a |
The time spent on sedentary activity and sleep was not associated with weight, BMI, lean mass, or body fat. Moreover, no association was found between the duration of physical activity and lean mass. Supplementary Material Fig. 1 displays the logarithmic regression between the time of light and moderate to vigorous PA and body fat, adjusted by age. For moderate to vigorous physical activity, the relationship observed was marginally significant, where accelerated decreases in fat were observed while moderated to vigorous PA increases up to 20 min per/day. For light PA the same pattern was observed, however not significant (p = 0.052).
Although the authors had a slightly smaller sample than estimated, this study had a power of 80.6% and a moderate size effect (0, 16) to correlate MVPA and fat mass % in children with CP.
DiscussionAn Australian cohort study in preschoolers with CP reports similar PA profile findings to those of the present study. In this cohort, however, sedentary activity increased according to motor impairment, which was not found in the present study.1 It is possible that, unlike the present study's group of low-income patients, in high-income countries, such as Australia, children with CP have greater access to care and a more adequate environment (educational, recreational and cultural activities), reducing their inactivity.
In neurotypical children, another study with preschoolers in Recife found a low percentage of daily time in physical activities, as the authors found in children with CP.17 However, a systematic review,18 identified the rates of preschoolers who achieve more than 60 min of moderate and vigorous PA by day.19 Unlike what occurs in the present study, in which no children achieved this level of activity. Considering the characteristics of the sample, socioeconomic aspects, profile of caregivers and the school, it is important to understand that these may be associated with behavioral habits in childhood and be determinants of physical activity.20,21
In terms of sedentary daily time, still considering the systematic review,18 the results of studies also carried with accelerometers were: 468.3 min (7.8 h)22 and 562.9 min (9.4 h)23 per day. Comparing with the present study, the authors identified that the children classified both as mild to moderate as severe had 762 min (12.7 h) per day. And dyskinetic children spent 928 min (15.5 h), while spastic children had 771 min (12.8 h) per day. These data indicate that children with CP spend 1/4 of the time that neurotypical children do in activities of moderate to vigorous intensity. Additionally, the authors found out that the children with CP spend more than 3 h in sedentary time than the neurotypical ones.
Regarding the severity of motor impairment, some factors can likely explain the lower PA among children with greater motor impairment, especially the spastic ones: reduction in muscle strength, high tone muscle, skeletal muscle deformities, the greater occurrence of seizures, more frequent use of medication and tube feeding.24,25 Besides, there is a consensus that spending more time in PA does not necessarily ensure that there is a reduction in the period of immobility at other times during the day.2Sedentary activity may be more related to the impossibility of performing activities involving mobility and participation in the home setting than PA, which, in turn, is more anchored on strength and motor function.
Children with more severe motor impairment were shorter, had a less lean mass in kg, and a greater percentage of fat mass when compared to children with mild to moderate motor impairment, which is similar to findings described in studies conducted at nutritional follow up and support centers for children with CP.1 In contrast, the fat mass was lower in children with severe CP, dysphagia, and feeding difficulties, and no previous nutritional intervention when compared to children without dysphagia.25 In addition, children with CP had a lower basal metabolic rate,26 and lower energy expenditure compared to neurotypical children.27 Likewise, a previous study was carried out on the same service of the present study, showed that children in the same social context and receiving similar nutritional support when started the treatment later had a tendency to preserve more body fat than weight, height and lean mass.28
Another aspect to consider is that the children spent the larger part of their day on sedentary activity and this time was even longer when compared to children with Dyskinetic. Interestingly, despite the higher severe motor impairment condition and they spent more time in light PA, and Dyskinetic children also spent two hours more per day on sedentary activity compared to those with spastic CP.
These findings can be discussed by raising some important aspects: 1) sedentary activity in children with CP have distinguished pattern regardless of the PA; 2) The combination of factors related to care may be more determinant to the amount of sedentary activity than the severity of motor impairment; 3) what is recorded as light PA by the accelerometer in children with Dyskinetic CP may actually be due to the uncoordinated movements (characteristic of this clinical type); 4) it is likely that some movements measured by the accelerometer were performed by caregivers or therapists rather than by children; 5) the accelerometer records time and intensity of movement without determining the intention nor the type of the activity.
Another interesting finding was the fact that the duration of sedentary activity was not associated with body composition or nutritional status. It is possible that the limitations of the present study, such as the size and heterogeneity of the sample, impeded the demonstration of such an association or that the relationship between sedentary activity, and it could be due that adiposity is less linear and more complex in children with CP compared to neurotypical children.29 One other limitation of this study was related to the cutoff point for PA and sedentary activity. In spite of that, there are already previous studies,14 in which the same cutoff point of the present study was used. In addition, the ROC curve for PC built by Clanchy et al.,30 showed a slightly lower cutting point and with similar precision. Thus, these cutoff points have already been validated for use in PC, allowing the estimation of PA time spent and intensity.
In either case, when considering the lower risk of adiposity in children with CP, PA seems to be an associated factor and should be considered for the improvement of health and reduction of diseases associated with excess body weight. The authors of the present study believe that even if the movements are performed by the caregivers, family, or therapists (instead of the children themselves), they indeed affect the body composition. This is an important issue because it highlights the importance of any movement in the context of PC. Thus, as recently described, in addition to therapists and health care, family, school, and social participation could provide more mobility and movements that should improve body composition and health.3
As the life expectancy of individuals with CP has been increasing, this increase needs to be associated with health, even if in the context of physical disability, and one must bear in mind that PA, stress reduction and healthy eating are the pillars of overall health. However, what the authors are considering to be PA in CP needs to be better understood to ensure that what is measured as PA is not actually stemming from movements that cause discomfort or pain. Even if this activity leads to a reduction in adiposity, its meaning with regard to improvements in health and quality of life in these individuals needs to be discussed.


