The present study aimed to evaluate the effects of GH treatment on the body composition of children born with SGA.
MethodsThis study is a systematic review of the literature. CINAHL, Embase; Medline/Pubmed, Scopus and Web of Science were searched from inception to March 2022.
ResultsFour studies met the inclusion criteria, with an intervention time of 1 to 3 years, using doses from 0.03 to 0.07 mg/kg/day of GH. Bone densitometry by dual-energy X-ray absorptiometry (DXA) with whole-body scans was the most used method to assess body composition. Most studies (n = 3) had SGA children as a control group with the same characteristics as the case group; the mean age was similar between the groups (minimum of 5.1 ± 1.4 years and maximum of 6.7 ± 1 0.8 years) and all participants had an average height ≤ -3DP. The Lean Mass (LM) and Fat Mass (FM) outcomes of the studies were not presented in a standardized manner; thus, they cannot be compared. There was a significant increase in LM in the group treated with GH in relation to the pre-treatment period and in comparison, to the untreated control group. Three studies showed a significant decrease in FM at the end of the intervention period, and in two studies, this decrease occurred in the control group.
ConclusionsDespite the differences in the presentation of results and in the evaluation periods, the results of the studies showed that growth hormone favors the gain and maintenance of lean mass, and it also affects fat mass reduction and redistribution.
Children born small for gestational age (SGA) are those whose birth weight and/or length are less than −2SD of the mean for gestational age.1 The birth rate of SGA children varies between countries: it is lower in developed countries such as Sweden and the Netherlands and higher in countries located in Asia, such as India and Bhutan.2 Countries such as Italy and China have a prevalence of SGA children between 3.6% and 12.3%, respectively.3,4
In Brazil, it was found that 7.8% to 8.7% of live newborns are classified as SGA according to the Intergrowth-21st reference curve. This range is strongly associated with demographic and maternal factors and prenatal care. The chance of being born SGA increases when two or more factors are associated, either at the beginning or during pregnancy.5-7
The growth and development of these newborns (NB) may be restricted during the intrauterine period, as a result of environmental, nutritional, and placental factors.8 Growth recovery can occur up to two years of age; however, a portion of approximately 10% of SGA children remains smaller than their peers of the same age and sex, resulting in short height in childhood and, consequently, in adulthood.9,10
On the other hand, these children may experience rapid body weight gain in the first few months of life, which in the long term may result in changes in metabolic programming, with increased insulin resistance, blood pressure, weight, abdominal fat, and blood pressure as well as a small amount of lean mass.11,12
These changes in body composition may occur in childhood and persist into adulthood,12 as shown in studies carried out with SGA children under 10 years of age, who have high-fat mass with predominantly abdominal distribution,13 and when adults, a lower proportion of lean mass compared to adults born with adequate weight and/or length for gestational age.14
Recombinant growth hormone (GH) has been used for decades to treat individuals with GH deficiency. In short, children born SGA, and GH have shown safe and positive results in height recovery, lipid metabolism, and blood pressure regulation, especially when treatment is started in prepuberty. In addition, GH treatment has shown favorable changes in body composition, with an increase in lean mass and a decrease in fat mass.12,15
The action of GH on the body composition of SGA children found in the literature is described by the amount of lean mass and total fat mass before and after a given intervention period, as well as the distribution of body fat and the relationship with metabolic and cardiovascular risk.16-19
Previous systematic reviews have addressed the action of GH in different conditions; for example, there was a study that evaluated the effects of GH in children and adolescents with idiopathic short stature,20 however, there is no systematization of the findings on the change that occurred in the body composition of SGA children without associated syndromes. To promote further knowledge of how this treatment has been carried out and of the results found for lean mass and fat mass, the present systematic review aimed to evaluate the effects of GH treatment on the body composition of children born SGA.
MethodsThis is a systematic review of effectiveness with a protocol registered and approved in PROSPERO (International Prospective Register of Systematic Reviews), under number CRD42020223292 (https://www.crd.york.ac.uk/prospero/display_record.php?RecordID=223292). The methodological approach followed PRISMA (Preferred Reporting Items for Systematic Reviews and Meta-Analysis) guidelines21 (Supplementary Table 1) and the PICO strategy (population, intervention, comparator and “outcomes”) was used for the formulation of the research question and for the bibliographic search (Table 1).
PICOS criteria used to define research question and literature search.
Data search was performed in March 2022 in the following electronic databases: CINAHL, Embase; Medline/Pubmed, Scopus and Web of Science, using specific descriptors and their synonyms, according to the MeSh terms and the Emtree terms: “Growth Hormone”, “Infant, Small for Gestational Age”, “SGA”, “Body Composition”, and their variations, combined with the Boolean operators OR or AND. The detailed search strategy with terms used for this study can be found in Supplementary Table 2. There was no restriction on language and date of publication.
The selection was performed separately by two researchers. After the exclusion of duplications, performed mechanically by the EndNote® version 8 reference manager and manually by the researchers, the documents were initially evaluated by title, later by abstracts, and then by reading the full text, while considering the eligibility criteria. Any disagreements were resolved through discussion with a third independent reviewer. A manual search was performed in the references of the articles included in the final analysis.
Randomized controlled trials (RCTs) that evaluated body composition through the outcomes of lean mass and/or total fat mass after GH treatment were included. The intervention should be a single therapy with GH, marketed under any brand, with subcutaneous administration, regardless of the administered dose, for a minimum period of one year.
The study population should consist of prepubescent children, who, according to the criteria of Marshall & Tanner22,23 are girls with infant breasts (B1) and boys with infant genitalia (G1); born SGA, with weight or height ≤ −2SD for gestational age and sex, as recommended by the World Health Organization.24 Studies that evaluated children with any associated syndrome, hormonal and/or metabolic changes, and who had the intrauterine chronic disease were excluded.
Data extraction was based on the recommendations of the PRISM checklist.21 Data on authorship, year, country, research design, intervention, participants, primary outcomes, and study characteristics were independently extracted by the two researchers using a data extraction spreadsheet in Excel® software.
The methodological quality of the selected studies was evaluated by the two researchers independently, according to the guidelines and criteria of the JBI (Joanna Briggs Institute), using the specific instrument for RCTs: “JBI Critical Appraisal Checklist for Randomized Controlled trials”.25
ResultsA total of 2184 documents were identified in the databases; after checking for duplications, there were 1785 documents left. First, they were independently evaluated by title, and 1706 documents were excluded; thus, 79 documents remained for abstract reading.
After reading the abstracts, 14 documents were selected for a full reading. At this stage, there was 80% agreement among the evaluators; 4 articles met the inclusion criteria and were classified as eligible for the study. The reasons for exclusion were: 1 presence of comorbidities, 2 follow-up periods of less than 12 months, 1 child in the pubertal phase, 2 non-randomized clinical trials, and 4 studies that required additional information, without feedback from the authors (Figure 1).
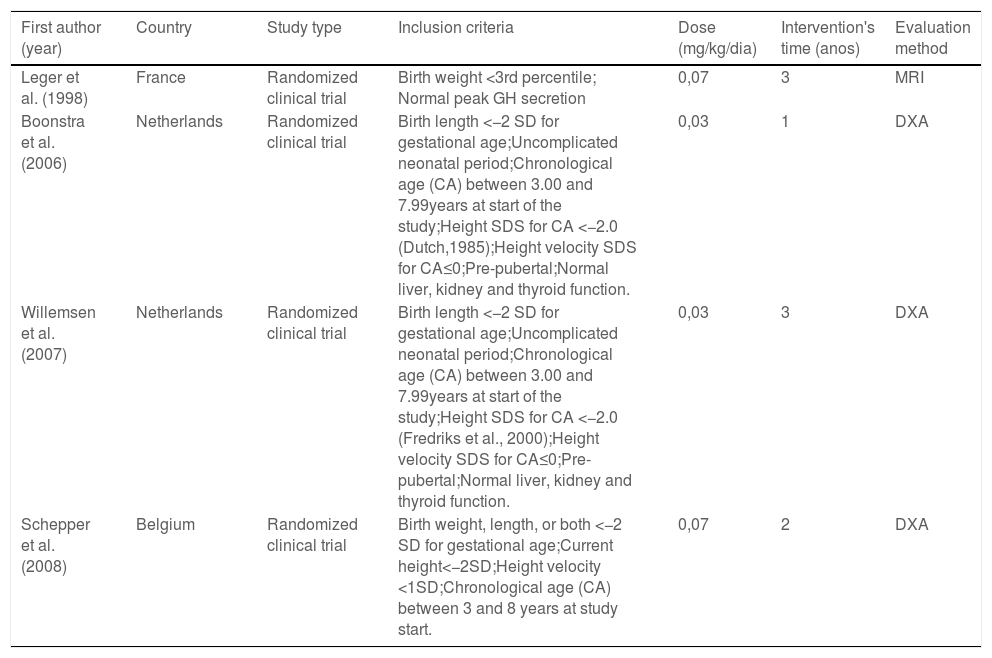
Table 2 shows that all studies were randomized clinical trials, carried out in Europe, with broadly similar inclusion criteria among them. Regarding the intervention, GH was used as a single therapy in all studies, at doses of 0.03 mg/kg/day and 0.07 mg/kg/day, administered once a day by subcutaneous injection. Intervention time ranged from 1 to 3 years and the most used method for assessing body composition was bone densitometry by double x-ray absorption (DXA) using whole-body scans.
Summary of the characteristics of the studies included in the systematic review.
SDS: standard deviation score; SD: standard deviation; MRI: magnetic resonance imaging; DEXA: dual-energy X-ray absorptiometry.
For the control group, one study compared the treatment group with prepubertal children born with adequate weight and/or height for gestational age without GH treatment.26 In the other studies,27-29 the control group consisted of SGA children with the same inclusion criteria as the case group who remained untreated during the study period, but who subsequently had the opportunity to receive treatment.
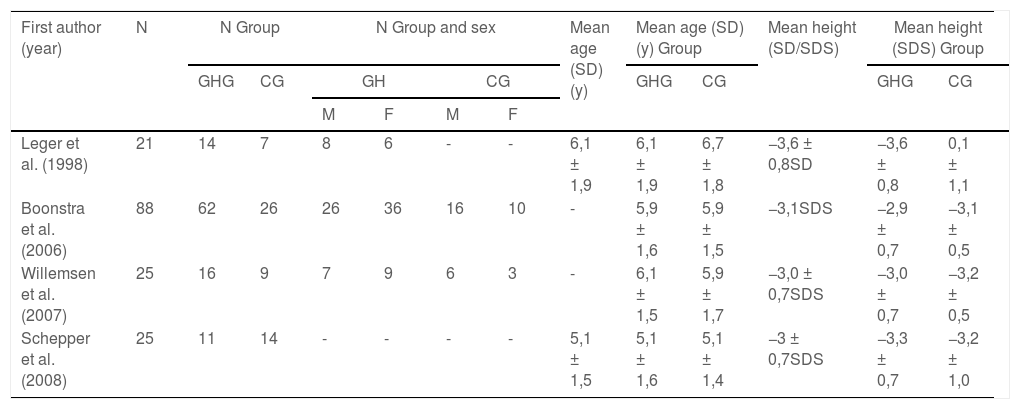
Table 3 shows the characteristics of the population, with similar ages at the beginning of treatment, both in the case group and in the control group, with a minimum age of 5.1 ± 1.4 years and maximum age of 6.7 ± 1.8 years. All children had average overall height ≤ −3DP. The number of participants varied widely, from 21 to 88.
Baseline characteristics of the population.
N: number; GHG: growth hormone group; CG: controls group; SDS: standard deviation score; SD: standard deviation.
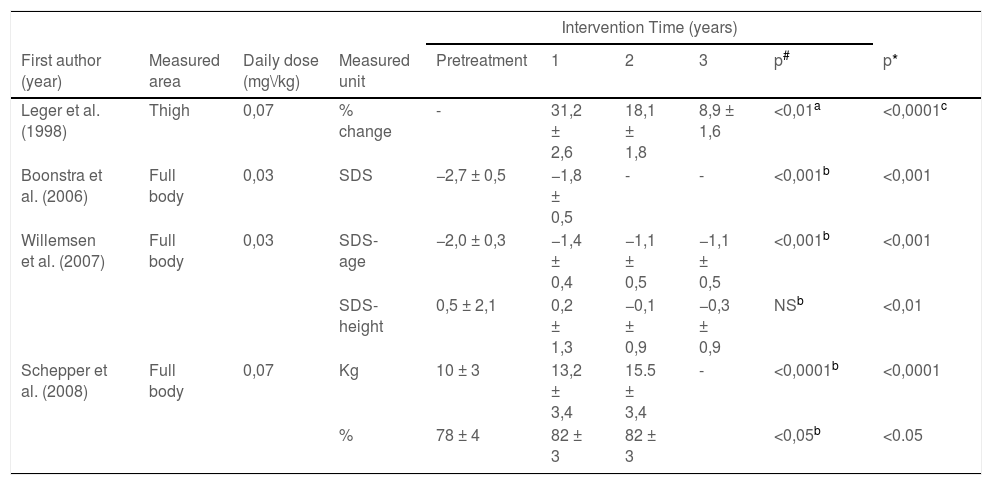
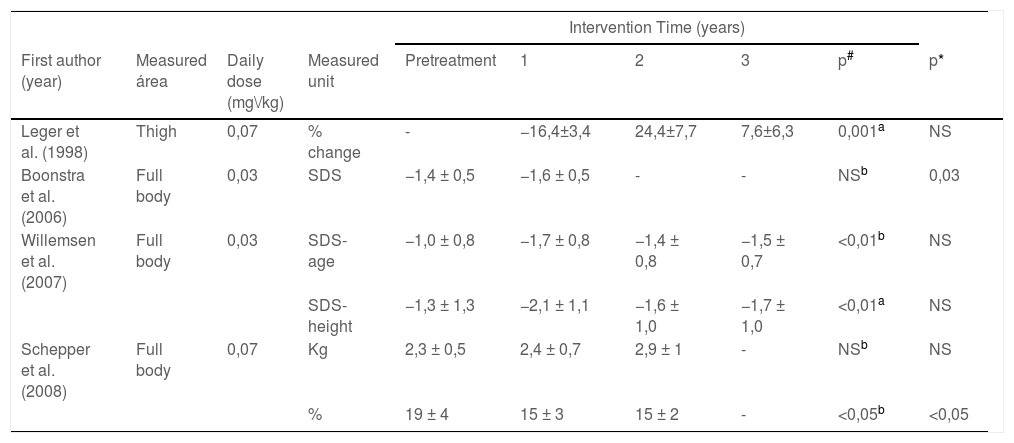
Tables 4 and 5 describe the results of the assessment of lean mass and fat mass, respectively. It can be seen that the presentation of outcomes is not standardized; the results are presented as percentage of change in body composition or standard deviation (SD), standard deviation adjusted for age (SD-age), standard deviation adjusted for height (SD-height), total kilograms (kg) and total percentage (%).
Results summary to Lean Mass (LM).
| Intervention Time (years) | |||||||||
|---|---|---|---|---|---|---|---|---|---|
| First author (year) | Measured area | Daily dose (mg\/kg) | Measured unit | Pretreatment | 1 | 2 | 3 | p# | p* |
| Leger et al. (1998) | Thigh | 0,07 | % change | - | 31,2 ± 2,6 | 18,1 ± 1,8 | 8,9 ± 1,6 | <0,01a | <0,0001c |
| Boonstra et al. (2006) | Full body | 0,03 | SDS | −2,7 ± 0,5 | −1,8 ± 0,5 | - | - | <0,001b | <0,001 |
| Willemsen et al. (2007) | Full body | 0,03 | SDS-age | −2,0 ± 0,3 | −1,4 ± 0,4 | −1,1 ± 0,5 | −1,1 ± 0,5 | <0,001b | <0,001 |
| SDS-height | 0,5 ± 2,1 | 0,2 ± 1,3 | −0,1 ± 0,9 | −0,3 ± 0,9 | NSb | <0,01 | |||
| Schepper et al. (2008) | Full body | 0,07 | Kg | 10 ± 3 | 13,2 ± 3,4 | 15.5 ± 3,4 | - | <0,0001b | <0,0001 |
| % | 78 ± 4 | 82 ± 3 | 82 ± 3 | <0,05b | <0.05 | ||||
% change: percent change; SDS: standard deviation score; SDS-age: SDS: standard deviation score for age; SDS-height: standard deviation score for height; SD: standard deviation; Kg: kilograms;%: percentage; NS: not significant.
Results summary to Fat Mass (FM).
| Intervention Time (years) | |||||||||
|---|---|---|---|---|---|---|---|---|---|
| First author (year) | Measured área | Daily dose (mg\/kg) | Measured unit | Pretreatment | 1 | 2 | 3 | p# | p* |
| Leger et al. (1998) | Thigh | 0,07 | % change | - | −16,4±3,4 | 24,4±7,7 | 7,6±6,3 | 0,001a | NS |
| Boonstra et al. (2006) | Full body | 0,03 | SDS | −1,4 ± 0,5 | −1,6 ± 0,5 | - | - | NSb | 0,03 |
| Willemsen et al. (2007) | Full body | 0,03 | SDS-age | −1,0 ± 0,8 | −1,7 ± 0,8 | −1,4 ± 0,8 | −1,5 ± 0,7 | <0,01b | NS |
| SDS-height | −1,3 ± 1,3 | −2,1 ± 1,1 | −1,6 ± 1,0 | −1,7 ± 1,0 | <0,01a | NS | |||
| Schepper et al. (2008) | Full body | 0,07 | Kg | 2,3 ± 0,5 | 2,4 ± 0,7 | 2,9 ± 1 | - | NSb | NS |
| % | 19 ± 4 | 15 ± 3 | 15 ± 2 | - | <0,05b | <0,05 | |||
% change: percent change; SDS: standard deviation score; SDS-age: SDS: standard deviation score for age; SDS-height: standard deviation score for height; SD: standard deviation; Kg: kilograms;%: percentage; NS: not significant.
There was a significant increase in lean mass in the pretreatment period in virtually all assessments, with the exception of the study carried out by Willemsen et al. (2007)29 using SD height. They found a reduction from 0.5 ± 2.1SD-height to −0.3 ± 0.9SD-height after three years of intervention. All studies found that the GH treatment resulted in additional lean mass gain at the end of treatment compared to the untreated control group (Table 4).
Three studies found a significant decrease in fat mass at the end of the intervention period in comparison to pre-treatment values, after one year of follow-up (−16.4 ± 3.4%; p = 0.001), after two years (19 ± 4 to 15 ± 2%, p < 0.05) and after three years of treatment with GH (−1.0 ± 0.8 to −1.5 ± 0.7 SD -age; p < 0.01). For the control group, only two studies (Boonstra et al.; 2006 and Schepper et al.; 2008) found significant differences (Table 5).
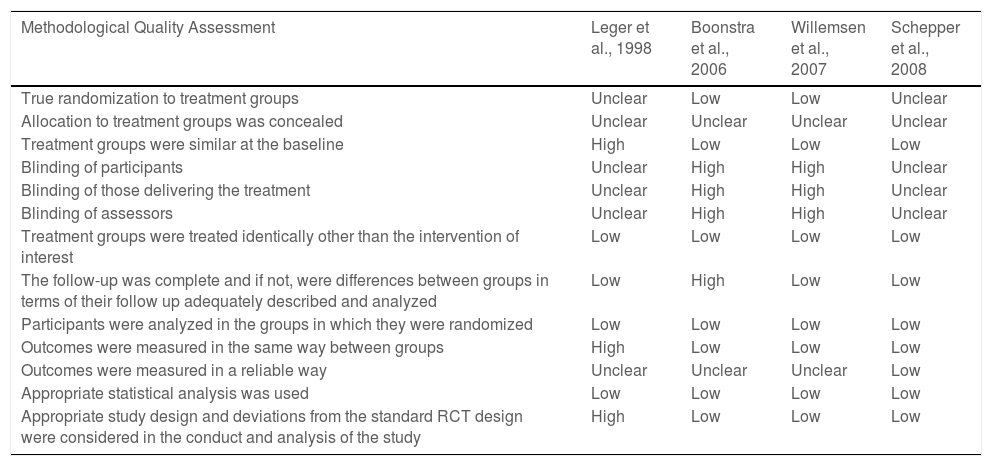
Table 6 shows the assessment of the risk of bias carried out in the studies. None of the studies presented a low risk of bias, as all of them presented uncertain or high risk in some of the items evaluated. The greatest risk of bias referred to blinding, as 2 studies were open-labeled,27,29 while this information was not adequately described in the other 2.26,28 There was also an uncertain risk of bias regarding allocation concealment because the method used to conceal the allocation sequence was not described in the studies.
Risk of bias summary.
This systematic review evaluated the effect of the GH intervention on the body composition of children born SGA and all included studies showed that GH treatment significantly increased lean body mass at the end of the follow-up period and also in comparison to the control group, while half of the studies found a decrease in fat mass.
In all studies, children started treatment with a lower proportion of fat mass than non-SGA children of the same age and sex, and SGA children remained with a proportion of truncal fat or visceral adipose tissue below the reference values even after the treatment with GH.16,19,29-31
The reduction in fat mass and the increase in lean mass were more evident in children who started treatment at younger ages and during the first year of treatment26,27,29 corroborating with the studies by Aurensanz Clemente et al. (2016)16 and Thankamony et al. (2016).31 However, the beneficial effects of GH on lean body mass were maintained in the long term, with a significant increase in all years of treatment.27,29
Previous studies have shown that this increase in lean mass after one year of treatment is positively correlated with gestational age,19 birth weight, sex, and lean body mass at baseline.17 According to Boonstra et al. (2006)27 the greater amount of lean mass is also due to the higher intake of calories and carbohydrates. This outcome signals that food components are used as energy to increase lean mass but not to increase fat mass.
Willemsen et al. (2007)29 found that the increase in lean mass occurred proportionally to height gain, which did not represent an additional increase in lean mass beyond what was expected for normal growth, and it was also reported later by Lem et al. (2013)32; however, untreated SGA children had a decrease in lean body mass, which was preserved in GH-treated children.29 Moreover, De Kort et al. (2009)17 found that SGA children born at term had an additional gain in lean mass beyond what was expected for normal growth during GH treatment compared to those born preterm.
For fat mass, the authors claimed that the significant reduction during the first year of treatment corroborates the action induced by GH administration on adipose tissue lipolysis.26 and that there is also an increase in basal energy expenditure, causing the body to use fat mass stores to obtain energy to assist in the production of lean mass.27
GH treatment affects several fat stores differently26 leading to a redistribution of fat mass with a possible reduction in the peripheral region and greater distribution in the trunk region.28,29 However, other studies have found that this increase in trunk fat mass is possibly related to a decrease in limb fat, increasing the limb fat to trunk fat zratio.17,31
According to Willemsen et al. (2007),29 this greater distribution of fat in the trunk region does not differ between SGA children treated with GH and those untreated, and it can only be linked to the process of growth and development expected for their age; this outcome is corroborated by the study by Leger et al. (1998)26 in which a progressive increase in body fat was found in SGA children after the first year of treatment, similar to the finding for the control group of non-SGA children. This change did not significantly alter the Body Mass Index (BMI).
Further studies are needed to determine whether the reduction in fat mass in SGA children is a factor resulting from the reduction in adipose tissue stores or just a consequence of the low weight at which they start treatment.26
Finally, it should be noted that the way in which the outcomes were presented influenced the findings, as the treatment with GH significantly reduced fat mass percentage, but the total fat mass was not affected. Previous studies have suggested that the reductions in fat mass percentage by the treatment with GH are not caused by the reduction of the total volume, but by the change in the total body composition, resulting in a lower percentage of fat in the whole body, limbs and trunk.19,31
The main limitations of this review were the variations across the studies in terms of the administered dose, follow-up time, and a number of evaluations, as well as the way in which the results were presented. This way, an adequate analysis could not be made to verify the effect of GH on the body composition of children born SGA. The methodological quality assessment pointed to an uncertain to high bias in all studies. However, a strong point to be highlighted is that this systematic review included only RCTs, e.g., studies that are considered the gold standard to assess health outcomes.
Evidence suggests that GH treatment has a positive effect on the body composition of children born SGA, with a significant increase in LM that is proportional to the gain in body height. Regarding FM, some studies described a reduction in body fat, but it is still unclear if it was a consequence of the decrease in total fat or the result of modification of total body composition. Some answers could be obtained with new ERC; however, as GH treatment of short stature in children born SGA is well established, it probably will be difficult to conduct new studies with an untreated group.


