
The aim of this study was to analyze the effects of fluid overload related to mechanical ventilation, renal replacement therapy, and evolution to discharge or death in critically ill children.
MethodsA retrospective study in a Pediatric Intensive Care Unit for two years. Patients who required invasive ventilatory support and vasopressor and/or inotropic medications were considered critically ill.
Results70 patients were included. The mean age was 6.8 ± 6 years. There was a tolerable increase in fluid overload during hospitalization, with a median of 2.45% on the first day, 5.10% on the third day, and 8.39% on the tenth day. The median fluid overload on the third day among those patients in pressure support ventilation mode was 4.80% while the median of those who remained on controlled ventilation was 8.45% (p = 0.039). Statistical significance was observed in the correlations between fluid overload measurements on the first, third, and tenth days of hospitalization and the beginning of renal replacement therapy (p = 0.049) and between renal replacement therapy and death (p = 0.01). The median fluid overload was 7.50% in patients who died versus 4.90% in those who did not die on the third day of hospitalization (p = 0.064). There was no statistically significant association between death and the variables sex or age.
ConclusionsThe fluid overload on the third day of hospitalization proved to be a determinant for the clinical outcomes of weaning from mechanical ventilation, initiation of renal replacement therapy, discharge from the intensive care unit, or death among these children.
The importance of fluid resuscitation in patients with circulatory shock and systemic inflammatory response syndrome is unquestionable, having an impact on reducing mortality and morbidity.1,2 However, new evidence shows that, after the initial management with intravenous volumetric expansion, the fluid overload (FO), frequently observed in patients admitted to the Intensive Care Units (ICU), has deleterious effects, it may contribute to unfavorable outcomes, such as longer time on mechanical ventilation, prolonged hospital stay, need for renal replacement therapy and increased risk of death.3-5 To avoid excess fluids, adequate monitoring is necessary, associated with the initiation of vasopressors and loop diuretics when indicated.6
In addition to such evidence, other studies have shown that FO was associated with damage to the myocardium, central nervous system, liver function, and digestive system with nutrient malabsorption syndrome, triggering malnutrition, difficulty in wound healing, and increased risk of intra-abdominal hypertension and compartment syndrome.7,8 In children on renal replacement therapy, FO of 10-20% by weight is an independent risk factor for increased mortality. Even patients who initially need more volume, such as in the postoperative period and trauma victims, have higher morbidity and mortality associated with excess fluid.6
In this context, several studies use the percentage of FO as a tool to estimate the amount of fluid retained about body weight and to verify its association with unfavorable outcomes.3,4,9
The present study aimed to analyze the effects of FO in critically ill patients: its interrelationship with ventilatory weaning (invasive mechanical ventilation time, evolution to pressure support ventilation (PSV), and extubation, with the use of medication vasopressors and/or inotropic agents (time of use, maximum dose used and suspension), with renal replacement therapy (initiation and suspension) and with a length of stay in the ICU and death.
MethodologyThis is a retrospective observational study. Data were extracted from ICU clinical records control sheets. All critically ill patients aged from 1 month to 17 years and 11 months, attended the Pediatric ICU of the Hospital das Clínicas of the Federal University of Minas Gerais (HC-UFMG/EBSERH), for over two years (2019 and 2020). Patients who required invasive ventilatory support and vasopressor or inotropic medications during hospitalization were considered critically ill. Patients with an ICU stay of more than ten days were excluded due to the positive influence of diet on FO.
The fluid administration strategy is individualized and based on the institutional clinical protocol of venous hydration that recommends maintenance fluid intake in critically ill patients a value of 400 ml/m2/dia plus the volume of diuresis. However, diuretic therapy is individualized and based on the patient's clinical presentation.
Fluid input included enteral and intravenous fluid administration and outputs included urine output, drain, and gastrointestinal losses.
The percentage of FO was calculated using the following formula, introduced by Goldstein et al.,10 being the fluids expressed in milliliters and the weight in grams:

Data collection included patient characteristics (gender, age, anthropometry, reason for clinical or surgical admission), Pediatric Index of Mortality (PIM 3), duration of mechanical ventilation, weaning from invasive ventilation and extubation; use of vasopressor or inotropic medications, including time of use, maximum dose, and suspension; creatinine clearance value by the formula of Schwartz, the need for renal replacement therapy and duration; length of stay in the ICU; outcome (discharge to the ward or death).
Statistical analyzes were performed using the SPSS 20.0 statistical package. The Kolmogorov-Smirnov normality test was used to test the hypothesis of the normal distribution of continuous variable values. The variables were correlated with the positive fluid balance value. For the comparison of parametric continuous numerical variables, the Student's t-test and the Mann–Whitney test were used for a non-parametric sample. The results were expressed as mean and standard deviation (± SD) when they were parametric or median and variation between the first and third quartiles (IQ) when not parametric. For analysis between FO and invasive mechanical ventilation and between death and medication, the non-parametric Mann-Whitey test was used. The significance of the correlation between FO and renal replacement therapy was evaluated by Spearman and Pearson correlation tests. A negligible relationship was considered if r < 0.3, presence of a mean relationship if r between 0.3 to < 0.5 and large values between 0.5 to 1. The relationship between death and renal replacement therapy was evaluated using the chi-square test. In all analyses, the probability of alpha error less than or equal to 0.05 was considered statistically significant.
This research project was approved by the Research Ethics Committee of UFMG –CAAE: 53411820.4.0000.5149.
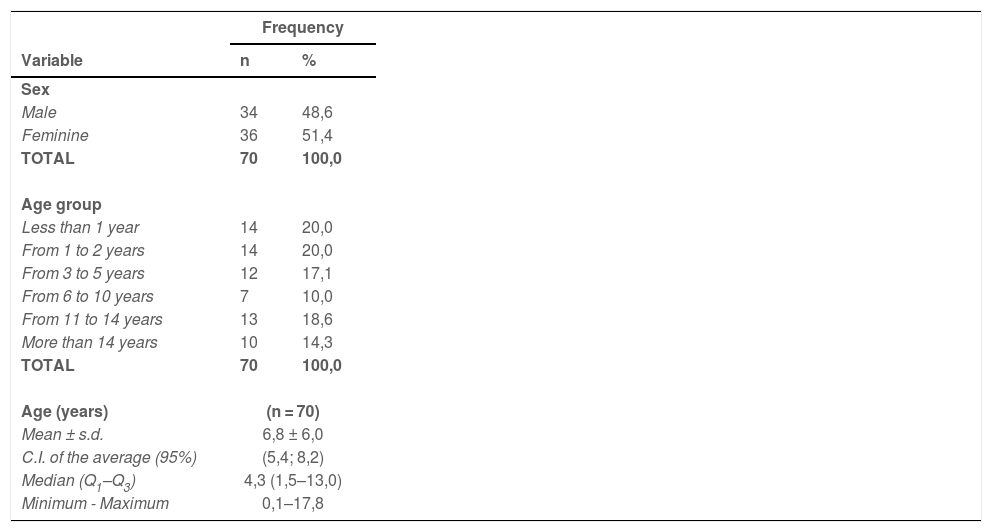
ResultsThe clinical characteristics of the patients included in the study are shown in Table 1. The predominant age group was 0 to 2 years (40%).
Characterization of patients regarding gender and age variables, in general.
n, number; s.d., standard deviation; C.I., confidence interval; Q1, first quartile; Q3; third quartile.
Patients who underwent surgery corresponded to 67.70% of the total sample. The surgical clinics responsible for most procedures were Neurosurgery (28%), Pediatric Surgery (26%), Cardiovascular Surgery (14%), and Vascular Surgery (14%). Clinical patients corresponded to 32.30%, and the three main causes of admission of clinical patients were related to respiratory (35.6%), cardiovascular (23.5%), and neurological (12%) problems.
The mean PIM 3 in the population studied was 4.59% (± 9.45%) and in patients who died, it was 8.12% (± 11.46), and in those who did not die it was 3.36 (± 8.32%).
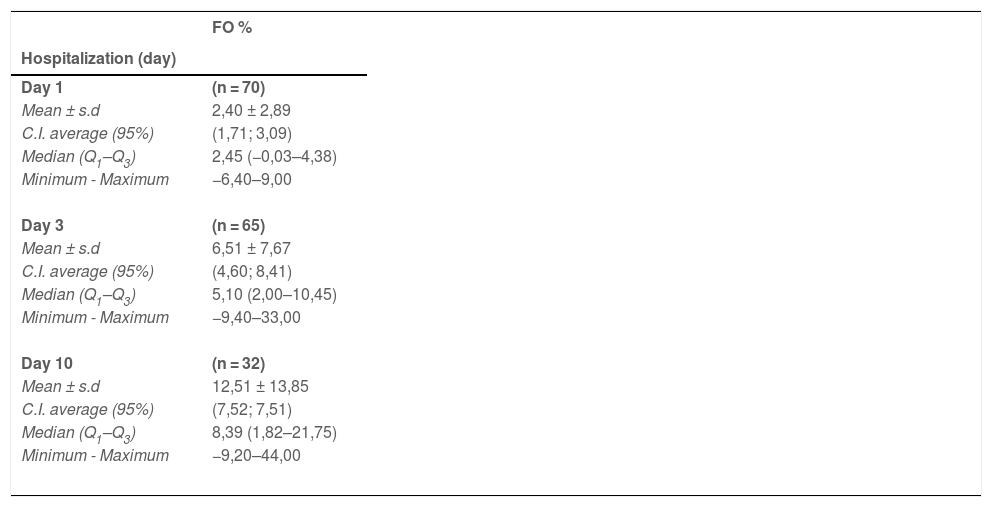
During hospitalization, there was a progressive increase in FO (Table 2). On the first and third days, the median burden was high, but tolerable at 2.45% (−0.03–4.38) and 5.10% (2.00–10.45), respectively. On the other hand, among patients who were still hospitalized on the tenth day, the median FO was 8.39% (1.82–21.75), and 9 (28.1%) of them had rates greater than 20%, reaching the maximum value of 44%. The number of patients analyzed, as shown in Table 2, decreased over the days as they progressed to death or discharge from the ICU.
Description of patients regarding the measures of Fluid Overload (FO%) on days 1, 3 and 10 of hospitalization.
n, number; s.d., standard deviation; C.I., confidence interval; Q1, first quartile; Q3, third quartile.
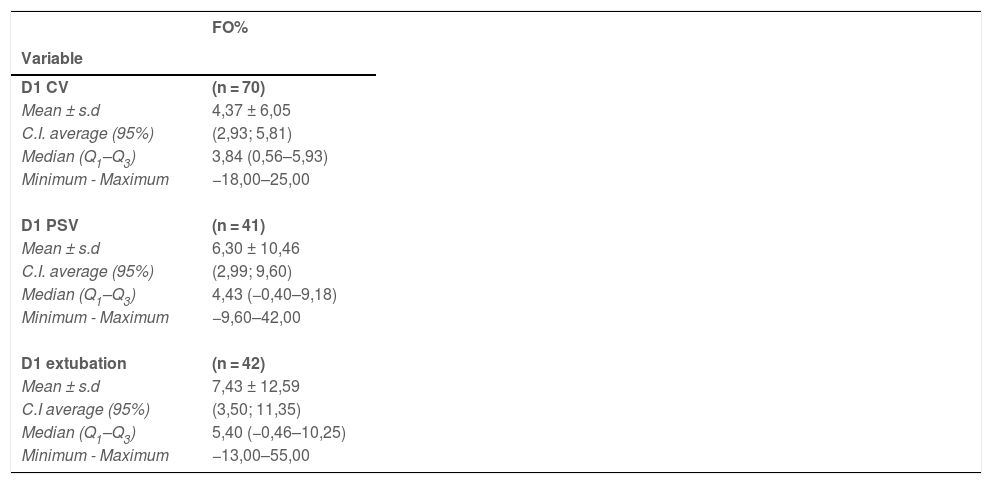
Table 3 shows the medians of FO according to the first day of controlled ventilation, change for pressure support ventilation (PSV), and extubation. All patients required invasive ventilatory support, with a mean of 4.8 ± 4.1 days. Of the 70 patients evaluated, 42 were extubated until the 10th day of admission to the ICU, and 41 (58.6%) had their ventilation mode changed to PSV before extubation. The 28 patients who were not extubated remained on invasive mechanical ventilation and died. On the day of extubation, the mean FO was 7.43% ± 12.59.
Description of Fluid Overload (FO) regarding variables 1st day of Controlled Ventilation (CV), Pressure Support Ventilation (PSV) and extubation.
n, number; s.d., standard deviation; C.I., confidence interval; Q1, first quartile; Q3; third quartile.
The FO measurements on the first, third, and tenth days of hospitalization were compared between the 41 patients who used the PSV and those who remained on controlled mechanical ventilation. The median FO on the third day of those who used PSV was 4.80% (0.89–8.05) while that of those who remained under controlled ventilation was 8.45% (3.08–15.53), p = 0.039. The medians on the first and tenth days in PSV patients were 2.50% (0.26–4.45) and 6.13% (1.23–16.90), in contrast, patients on controlled controlled mechanical ventilation were 1.80% (−0.28–4.60) and 19.00% (3.60–28.90), respectively. On the first and tenth days, there was no significant difference (p 0.551 and p 0.226, respectively).
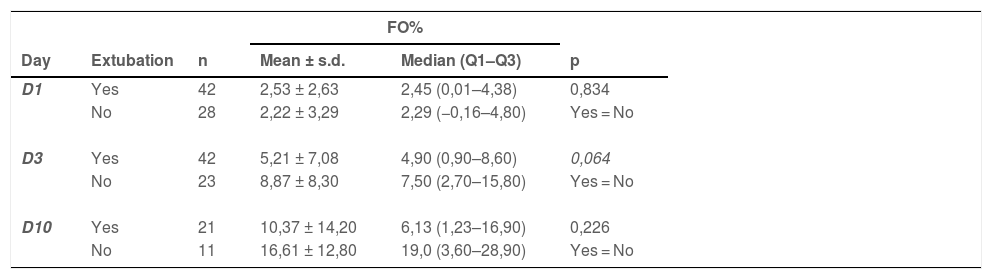
The comparison between FO and extubation is described in Table 4. The medians of FO on all days evaluated were higher among patients who remained intubated when compared to those who were extubated, however, no statistically significant difference was observed. On the third day of hospitalization, the results were at the limit of statistical significance (p = 0.064), using the non-parametric Mann-Whitey statistical test. The children who died were the same ones who were not extubated and had a median FO of 19.0% (3.60–28.90) on the tenth day.
Descriptive and comparative analysis between patients with or without extubation regarding the measures of Fluid Overload (FO) at admission according to the days evaluated.
n, number; s.d., standard deviation; Q1, first quartile; Q3, third quartile; p, probability of significance of Pearson's Correlation Analysis less than 0.05.
All patients used vasoactive drugs at some point during hospitalization. Of these, 53 (75.7%) used epinephrine and had a median FO of 4.40% (1.53–8.18) at the beginning of the drug and reached a maximum average dose of 1.01 ± 0.75 mcg/kg/min. As for norepinephrine, 35 patients (50%) used this drug and had a median FO of 1.76% (0.00 - 6.70) at the beginning of the drug, reaching a maximum dose of 1.05 ± 0.82 mcg /kg/min. Twenty-one patients (30%) used dobutamine and five (7.1%) used milrinone, with medians of FO at a baseline of 2.20% (0.34–10.50) and 4.20% (2.54–5 .35), respectively. Only 2 patients (2.9%) used vasopressin, so the measurements of the FO in the initial use of this drug were not sufficient to estimate its effect.
Aiming to optimize the treatment of hypervolemia, 55 (78.6%) patients used furosemide bolus and 14 (20%) evolved with the need for continuous infusion of this drug. Comparatively, the median FO in the use of bolus medication was 3.40% (0.50–7.46), while in continuous medication it was considerably higher, with a median of 6.08% (4.65–18.63). Of these patients, 9 (12.9%) required renal replacement therapy to control fluid overload, presenting an average creatinine clearance by the formula of Schwartz of 42.58 ml/min (SD ± 15.2) at the beginning of this therapy. The median FO at the onset of renal replacement therapy was 16.30% (2.25–32.00). The results indicated that there is an association between the use of renal replacement therapy and death (p = 0.01), through the chi-square test. Among the patients who required renal replacement therapy, only 2 survived. Statistical significance was observed in the evaluation of the correlation between the FO measurements on the first, third, and tenth days of hospitalization and the beginning of renal replacement therapy (p = 0.049) and direct correlation (r = 0.67) between the FO measurement on the third day of hospitalization and the subsequent need for renal replacement therapy.
Twenty-eight patients died after 7.6 days (SD ± 4.9) days of hospitalization, while forty-two were discharged from the ICU after 10.1 days (SD ± 5.1 days). The outcome of death was observed among those who had a median FO of 19.00% (3.60–28.90) on the tenth day of hospitalization and who remained intubated. Among the eleven patients who were discharged, the median FO on the tenth day was 6.13% (1.23–16.90). There was no statistically significant association between death and gender or age variables. A statistically significant difference (p = 0.015) was identified between death and the total number of medications used during hospitalization. Patients who evolved to death used a greater number of medications compared to those who were discharged. The mean of medications used was 2.96 medications (SD ± 0.96).
DiscussionThe relationship between FO and the worst clinical outcomes in critically ill patients is well established in the literature, corroborating the results observed in this study. Other authors have shown that FO values ≥ 10% are strongly associated with higher morbidity outcomes, such as worse oxygenation rates, longer mechanical ventilation, ICU stays, need for renal replacement therapy, and also with increased mortality.11-13 Arikan et al. demonstrated an increase in organ dysfunction associated with FO greater than or equal to 15% regardless of the day of hospitalization.14 The study by Díaz et al.15 obtained similar results by demonstrating excessive fluid administration during the first 72 hours of admission as the main responsible for fluid overload. In the present study, the median FO increased over the days of hospitalization, and values greater than 10%, especially after the third day, were associated with an increase in morbidity and mortality.
One of the outcomes evaluated was the stay on mechanical ventilation. As observed in this study, other publications show that greater fluid overload is correlated with a greater number of days of mechanical ventilation,16,17 including some systematic reviews by Silversides et al.18 and Alobaidi et al.19 In this study, the researchers could observe that the third day was more relevant in terms of fluid overload and duration of use of mechanical ventilation. The median FO of those who had the ventilation mode changed to PSV was significantly lower on that day compared to those who were kept on controlled mechanical ventilation (p = 0.039); in contrast, it was greater in those who were not extubated (p = 0.064), although at the limit of statistical significance. Furthermore, in other studies, a correlation was observed between FO and worse oxygenation indices in critically ill children.17
Regarding the use of vasoactive amines, the results showed that high doses of adrenaline (1.01 ± 0.75 mcg/kg/min) and noradrenaline (1.05 ± 0.82 mcg/kg/min) was used in the shock management of these patients, this fact can be attributed to the study population being composed of critically ill patients with also high PIM3 values at admission.
Pharmacological fluid removal, often with loop diuretics, is indicated in the stabilization phases after acute fluid resuscitation. However, few studies have evaluated post-resuscitation fluid management strategies in critically ill patients or the ideal time to introduce drug therapy. In a study by Franco Diaz et al.,15 a benefit was observed in the reduction of total fluid intake in the first 72 hours of admission, resulting in shorter ICU stay and less need for the use of vasoactive and/or inotropic drugs in these patients who had water restriction.
Studies carried out in the United States showed that high-dose furosemide, when administered to patients with established acute kidney injury and requiring dialysis, improved urinary output, but did not affect renal recovery, the number of dialysis sessions, or mortality.10 The continuous infusion of furosemide, which in theory would have better results because it eliminates the periods of compensatory sodium retention and maintains the drug's serum concentration, also showed no impact on renal recovery, despite the improvement in urinary output. In contrast, in the present study, 55 (78.6%) patients used bolus furosemide and 14 (20%) required continuous infusion of this drug, with continuous furosemide starting when FO was considerably high, ie, greater than 10%.
Among the various indications for the onset of renal replacement therapy in critically ill patients is the FO. Several pediatric studies demonstrate an independent association between FO at the time of initiation of continuous renal replacement therapy and mortality.20. A study by Sutherland et al.,21 analyzing 297 pediatric ICU patients with multiple organ dysfunction who received renal replacement therapy continuously, highlights that FO > 10% at the beginning of is associated with increased mortality (OR 1.03), with maximum risk when FO > 20% (OR 8.5, 95% CI 2.8–25.7). In the present study, 9 out of 70 patients (12.9%) required intermittent renal replacement therapy and had a median high FO at the time of indication for therapy of 16.30% (2.25–32.00). Furthermore, statistical significance was observed in the evaluation of the correlation between the FO measurements on the first, third, and tenth days of hospitalization and the onset of renal replacement therapy (p = 0.049) and direct correlation (r = 0.67) between the FO measurement on the third day of hospitalization and the subsequent need for renal replacement therapy. The observed results showed, again, that the third day was decisive for the most effective start of measures that reduce the volume overload to minimize the harmful effects of this accumulation. These observations indicated that the patient with FO on the third day of hospitalization had a greater chance of needing invasive measures to treat hypervolemia.
As for the relationship between mortality and renal replacement therapy, a study by Galasso et al.22 showed that patients undergoing renal replacement therapy have a mortality rate of around 38 to 58%, with FO > 10% being an independent risk factor. In the present study, among patients undergoing renal replacement therapy, only two patients survived, resulting in a mortality rate of 77%. The observation of the direct relationship between the use of renal replacement therapy and death (p = 0.01) reinforced the importance of this association.
Regarding mortality and increased FO, the main finding of the systematic review by Silversides et al.18 was the positive association between FO and higher mortality. In the present study, the patients who died had a median FO of 12.00% (3.68–24.03) on the tenth day of hospitalization, a high value as well as the median FO of 17.8% found in the study by Sampaio et al.23
A recent article by Gelbart et al.,24 in mechanically ventilated critically ill children, shows that when FO is visualized on a continuum, extreme values of greater than 20% are associated with prolonged duration of mechanical ventilation, intensive care, and hospital length of stay, and mortality; however, values of up to 10% are not and, in fact, may be associated with reduced mortality.
As limiting factors of the present study, it is worth noting that the sample is small but correlated with the number of beds in the authors’ service. This is a retrospective study, which could make data collection difficult. This issue was minimized by adequate planning of data collection and constant recording of FO in the patients' clinical records. On the other hand, the data presented here contribute to the literature by reiterating FO as a factor for unfavorable clinical outcomes.
ConclusionFluid resuscitation is an important phase of fluid therapy for the management of critically ill patients, but accumulated fluid overload is associated with deleterious outcomes. Fluid accumulation is related to a longer duration of mechanical ventilation, the need for renal replacement therapy, and death. The third day of hospitalization is a crucial time for intervention to reduce the accumulated fluid overload and morbidity and mortality of critically ill pediatric patients.
The authors thank the entire ICU team especially Dr. Adrianne Mary Leão Sette e Oliveira for their efforts to provide the best patient care and for contributing to the data records.
Institution: Departamento de Pediatria da Faculdade de Medicina da UFMG /Hospital das Clínicas UFMG/EBSERH.


