

The aim of this study was to analyze the relationship between body adiposity and physical fitness with performance in the Supine-to-Stand test (STS-test) in sedentary adolescents.
MethodsSixty-two adolescents, of both sexes, between 10 and 16 years old, participated in the study. Body mass (BM), height, waist circumference (WC), fat mass (FM), fat-free mass (FFM), right and left handgrip strength (HGS-right, HGS-left), abdominal resistance (ABDO), flexibility (FLEX), and cardiorespiratory fitness (VO2peak) were measured. Body mass index (BMI), z-score BMI (BMI-z), tri-ponderal mass index (TMI) and waist-to-height ratio (WHtR) were calculated. The STS-test was applied to evaluate the STS-MC by the movement patterns in the execution of the test. The STS-time in seconds (s) was categorized into terciles: fast (FG < 2.0 s), intermediate (IG = 2.0–2.6 s) and slow (SG > 2.6 s). One-way ANOVA, Chi-square, Spearman's correlation coefficient as well as non-parametric tests were used, with significance p ≤ 0.05.
ResultsThe SG presented higher BMI, BMI-z, TMI, WHtR, FM, %FM, as well as lower averages for %FFM, HGS-right, HGS-left, FLEX, ABDO, VO2peak, VO2peak relative to BM (VO2peakBM) in relation to GF. The BMI, BMI-z, TMI, WC, WHtR and FM showed moderate and direct correlations with STS-time and inverse with STS-MC (p < 0.01). HGS-right, HGS-left, ABDO, and VO2peakBM showed moderate and an inverse correlation with STS-time (p < 0.05). The VO2peakBM was moderate and with direct correlations to STS-MC (p < 0.01).
ConclusionIt is concluded that excess fat and low physical fitness hamper STS-test performance. Therefore, the STS-test can be used for screening students to assess MC.
In the last decades, social and cultural transformations, mainly changes in the field of technology, where innovation led to greater efficiency in the use of energy and human time, provided changes to the habits of many adolescents, which have increased the time spent in sedentary entertainment activities.1 As a collateral effect, the regular practice of physical activities has been reduced,2 and the prevalence of obesity and other comorbidities increased.1 Pediatric obesity has been associated with cardiometabolic disorders and detection with accurate and reliable techniques can be effective in its prevention and treatment. The most used indicator for screening is the z-score body mass index (BMI-z). However, the tri-ponderal mass index (TMI), a simple tool that does not involve complicated percentiles, has been considered similar to the BMI-z3 and higher than the BMI4 in screening Brazilian children and adolescents.
Increases in sedentariness result in a decline in physical performance5 and levels of physical fitness6 and may lead to changes in the motor competence (MC) in all periods of life, especially in adolescents,7 which in turn, can be more involved in sedentary activities for lack of motor skills. Physical fitness impacts physical and functional performance and is an important health status component of adolescents.6 Low physical fitness can compromise the MC, mobility, and agility, with reduced participation in spontaneous physical activities in the presence of overweight.8 Adequate levels of MC have been proposed as a fundamental aspect in enabling adolescents to engage in physical activity for health benefits.9 Consequently, monitoring MC has been recommended as an essential preventive strategy in identifying children with specific intervention needs to enable the development of positive health trajectories. One key barrier, while assessing the MC is the ability of teachers and public health professionals to accurately apply and interpret MC tests. Generally, most tests require trained observers to score performance and are times consuming which precludes broad use. As a result, researchers and practitioners have sought alternative MC tests that may be used in school settings.
The Supine-to-Stand test (STS-test) has been proposed as an alternative for functional MC analysis.10 The test is simple, straightforward, low-cost, and consists of assuming an upright position from the lying position.11 Studies have described different strategies and patterns in moving from supine to standing for young adults,11,12 for children between 4 and 7 years old,13 and children over 8 years old.12 These studies suggest that performance on the STS-test is related to MC in preschool children14 and performance in physical tests in schoolchildren15 and inversely correlated with age.16 The STS-test provides a measure of the product (i.e., movement outcome) and process (i.e., movement quality) MC which has been identified as key for researchers wishing to evaluate MC holistically.17
Prior studies have been conducted with young populations were designed to determine motor patterns for assessing and studying the evolution of motor learning in the early stages of life.13,14,16 On the other hand, studies that have related STS-test performance and anthropometrics, body composition as well as physical fitness measures in the pediatric population are scarce.18 Understanding how MC is related to health-related parameters in adolescents is important due to the recent increases in sedentariness levels since the prevalence of sedentarism in adolescents in the country and the world be increased.19 However, the extent to which STS-test relates to adiposity and fitness in sedentary adolescents has been little explored and may provide an understanding of how MC is related to health parameters. This study was designed to examine the relationship between body adiposity and physical fitness with STS-test performance in sedentary adolescents.
Materials and methodsThis is a cross-sectional study carried out at the Federal University of Paraná in 2019. Eutrophic and overweight adolescents from Curitiba and the Metropolitan Region - Paraná were selected. The sample power was calculated in the software G*Power (v. 3.1.9.2), using the ANOVA one-way, one measurement, and three groups. It was attributed a power of 0.90, α of 0.05 and ES of 0.5, and an estimated sample size of 54 participants. The study included 62 adolescents.
The criteria for inclusion in the study were: (a) signed the free and informed consent form (guardians) and the assent form (adolescents), to participate in all assessments; (b) age between 10 and 16 years; (c) not participating in other regular physical activity in the last six months, in addition to school physical education (≅120 min/week); and (d) stay more than two hours a day in screen time (television, smartphones, tablets, computers, and videogames). The exclusion criteria were: (a) muscle injury or physical limitation that could interfere with the performance in any of the testing procedures. The Ethics committee (no CAAE 62963916.0.0000.5223) previously approved all the procedures of the study.
Height was measured using a portable stadiometer (Avanutri®) and body mass (BM) was measured using a digital scale (Welmy®, model W200/50A). The body mass index (BMI) and the z-score BMI (BMI-z) were calculated using the WHO Anthro Plus® program.20 The trunk-cephalic height was measured using a 50 cm bench, coupled to the stadiometer. Waist circumference (WC) was assessed using a tape with a resolution of 0.1 cm (Sanny®). The waist-to-height ratio (WHtR) was calculated by the ratio between WC and height. Tri-ponderal mass index (TMI) was calculated as the ratio between body mass and height cubed.3
Body composition was assessed using tetrapolar Bioelectrical Impedance Analysis (Biodynamics 450®), was performed in the morning, with those evaluated in the supine position for about ten minutes. They were previously instructed to follow the recommendations: (a) abstain from food and drinks the past 12 h; (b) avoid vigorous physical efforts the past 12 h; (c) abstain from alcohol and caffeinated drinks over the past 48 h; (d) not using diuretics over the past seven days; (e) urinate about 30 min before the exam; (f) do not use metallic objects during the exam. Fat-free mass (FFM) and fat mass (FM) was calculated using equation validated.21
Biological maturity was estimated by using the somatic maturation by determining the distance an individual is from Peak Height Velocity (PHV).22 This approach is structured on a mathematical model based on anthropometrics, age, and sex. Subsequently, the prediction of age at peak height velocity (APHV) was determined by subtracting the maturity-offset from the chronological age. They were classified: time (APHV between 13.1 and 14.6 years); late (APHV > 14.6 years) and early (APHV < 13.1 years).
Muscular fitness was measured using the handgrip strength test, obtained by means of a handheld hydraulic dynamometer (Saehan®). The grip was adjusted individually, where the patient remained standing, with their elbow flexed at 90° and forearm sustained in a neutral position. Participants were instructed to gradually and continuously tighten the hand loop to maximum strength. In addition, abdominal muscle endurance was obtained from the maximum number of repetitions obtained in the one-minute abdominal push-ups test.23 Flexibility was assessed using the sit and reach test, using the Wells bench test.24
Cardiorespiratory fitness was assessed using a maximum incremental test, performed on a treadmill (Movement®) and using a K4b² metabolic analyzer (Cosmed®). A heart rate monitor (Polar® A300) was used to determine the maximum heart rate (HRmax). The test started with a speed of 4.0 km/h−1, with increases of 0.6 km/h imposed each minute. The test was terminated when at least two of the following criteria were observed: (a) exhaustion or inability to maintain the required speed; (b) respiratory exchange ratio ≥1.0; (c) achieve the HRmax predicted.25 The HRmax and the peak oxygen consumption (VO2peak) were recorded and normalized with respect to BM (VO2peakBM).
Participants were instructed to move from the lying supine with arms and hands extended at the side of the body and lower limbs joined to a full standing position as fast as they could. Three attempts were made, but the first was used for familiarization purposes. Thus, the best STS-test performance was selected for further analysis. The tests were filmed in the sagittal plane with an acquisition frequency of 30 Hz. The videos were used to determine the total test time using specific software (Kinovea®).14,15 The STS-test was analyzed to obtain the product (STS-time) and process (motor patterns) of motor competence (STS-MC). The actions used were classified according to the sequence of movements presented by Vansant.13 Each category received a numerical score and the sum of the scores (ranging from 1 to 13 points), were used to determine the MC.15
The Shapiro-Wilk test confirmed the normality of the data. Standard descriptive statistics procedures were applied to characterize the groups. For analysis purposes, three groups were defined from the results of the STS-time, stratified in terciles: Fast group (FG) time below 2.0 s, Intermediate group (IG) time between 2.0 and 2.6 s; Slow group (SG) time above 2.6 s. A One-way ANOVA test and the Kruskal-Wallis test were applied to multiple comparisons between the groups and the Scheffé test was used to determine where differences occurred. For the differences in the proportions, the Chi-square test was used. Spearman's correlation coefficient was applied to verify the association between variables and adjusted for sex, age, and somatic maturation. Correlations were considered as weak (r = 0.10 to 0.30), moderate (r = 0.40 to 0.60) and strong (r ≧ 0.70).26 Statistical analysis was performed using SPSS software version 24.0 and the significance level was set at p ≤ 0.05.
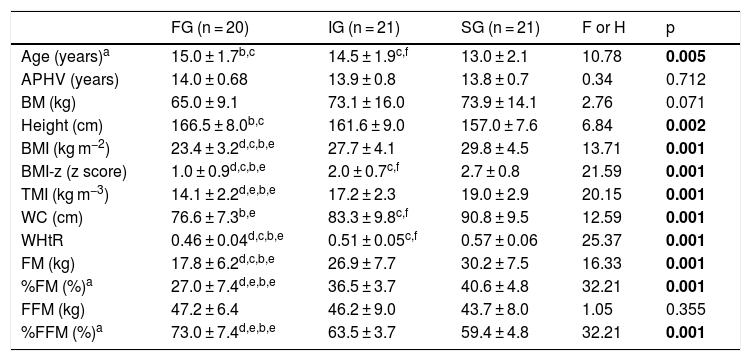
ResultsThe study included 62 adolescents (30 girls and 32 boys), aged between 10 and 16 years. Table 1 presents the anthropometrics and body composition for each group according to the STS-time. The FG and IG were older in comparison to SG (p < 0.01). However, no differences were found between groups regarding APHV (p > 0.05). The FG showed lower BMI, BMI-z, WHtR, FM and %FM than the IG (p < 0.05) and the SG (p < 0.01). The FG had a lower WC than the SG (p < 0.01) and higher %FFM in comparison to the other groups (p < 0.01). The proportion of somatic maturation was similar among the STS-time groups (X2 = 0.788, p = 0.375). However, the proportion of boys and girls was different among the STS-time groups, with a higher proportion of boys in the fast group (X2 = 12.958, p = 0.002).
Anthropometrics and body composition (mean ± sd) of the fast (FG), intermediate (IG), and slow (SG) groups, according to performance in the STS-time.
| FG (n = 20) | IG (n = 21) | SG (n = 21) | F or H | p | |
|---|---|---|---|---|---|
| Age (years)a | 15.0 ± 1.7b,c | 14.5 ± 1.9c,f | 13.0 ± 2.1 | 10.78 | 0.005 |
| APHV (years) | 14.0 ± 0.68 | 13.9 ± 0.8 | 13.8 ± 0.7 | 0.34 | 0.712 |
| BM (kg) | 65.0 ± 9.1 | 73.1 ± 16.0 | 73.9 ± 14.1 | 2.76 | 0.071 |
| Height (cm) | 166.5 ± 8.0b,c | 161.6 ± 9.0 | 157.0 ± 7.6 | 6.84 | 0.002 |
| BMI (kg m−2) | 23.4 ± 3.2d,c,b,e | 27.7 ± 4.1 | 29.8 ± 4.5 | 13.71 | 0.001 |
| BMI-z (z score) | 1.0 ± 0.9d,c,b,e | 2.0 ± 0.7c,f | 2.7 ± 0.8 | 21.59 | 0.001 |
| TMI (kg m−3) | 14.1 ± 2.2d,e,b,e | 17.2 ± 2.3 | 19.0 ± 2.9 | 20.15 | 0.001 |
| WC (cm) | 76.6 ± 7.3b,e | 83.3 ± 9.8c,f | 90.8 ± 9.5 | 12.59 | 0.001 |
| WHtR | 0.46 ± 0.04d,c,b,e | 0.51 ± 0.05c,f | 0.57 ± 0.06 | 25.37 | 0.001 |
| FM (kg) | 17.8 ± 6.2d,c,b,e | 26.9 ± 7.7 | 30.2 ± 7.5 | 16.33 | 0.001 |
| %FM (%)a | 27.0 ± 7.4d,e,b,e | 36.5 ± 3.7 | 40.6 ± 4.8 | 32.21 | 0.001 |
| FFM (kg) | 47.2 ± 6.4 | 46.2 ± 9.0 | 43.7 ± 8.0 | 1.05 | 0.355 |
| %FFM (%)a | 73.0 ± 7.4d,e,b,e | 63.5 ± 3.7 | 59.4 ± 4.8 | 32.21 | 0.001 |
APHV, age of peak height velocity; BM, body mass; BMI, body mass index; BMI-z, body mass index z score; TMI, tri-ponderal mass index; WC, waist circumference; WHtR, waist/height ratio; FM, fat mass; FFM, fat-free mass.
aKruskal-Wallis test.
bDifferent from the SG.
cp < 0.05.
dDifferent from the IG.
ep < 0.01.
f Different than the SG.
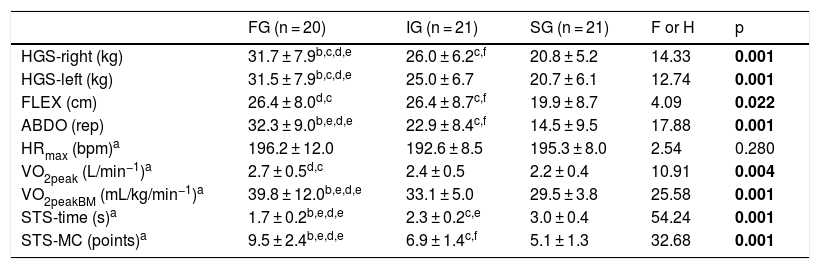
The results of physical fitness are shown in Table 2. The FG had HGS-right and HGS-left (p < 0.05), ABDO and VO2peakBM (p < 0.01) compared to the IG and SG. The FG presented the best MC than the other groups (p < 0.01). The FG also presented greater VO2peak and FLEX than the SG (p < 0.05). The IG showed higher values of HGS-left, FLEX, ABDO (p < 0.05) and STS-MC (p < 0.01) when compared to the SG, as well as lower on STS-time (p < 0.01).
Physical fitness variables, presented as the mean and standard deviation of the fast (FG), intermediate (IG), and slow (SG) groups, according to performance in the STS-time.
| FG (n = 20) | IG (n = 21) | SG (n = 21) | F or H | p | |
|---|---|---|---|---|---|
| HGS-right (kg) | 31.7 ± 7.9b,c,d,e | 26.0 ± 6.2c,f | 20.8 ± 5.2 | 14.33 | 0.001 |
| HGS-left (kg) | 31.5 ± 7.9b,c,d,e | 25.0 ± 6.7 | 20.7 ± 6.1 | 12.74 | 0.001 |
| FLEX (cm) | 26.4 ± 8.0d,c | 26.4 ± 8.7c,f | 19.9 ± 8.7 | 4.09 | 0.022 |
| ABDO (rep) | 32.3 ± 9.0b,e,d,e | 22.9 ± 8.4c,f | 14.5 ± 9.5 | 17.88 | 0.001 |
| HRmax (bpm)a | 196.2 ± 12.0 | 192.6 ± 8.5 | 195.3 ± 8.0 | 2.54 | 0.280 |
| VO2peak (L/min−1)a | 2.7 ± 0.5d,c | 2.4 ± 0.5 | 2.2 ± 0.4 | 10.91 | 0.004 |
| VO2peakBM (mL/kg/min−1)a | 39.8 ± 12.0b,e,d,e | 33.1 ± 5.0 | 29.5 ± 3.8 | 25.58 | 0.001 |
| STS-time (s)a | 1.7 ± 0.2b,e,d,e | 2.3 ± 0.2c,e | 3.0 ± 0.4 | 54.24 | 0.001 |
| STS-MC (points)a | 9.5 ± 2.4b,e,d,e | 6.9 ± 1.4c,f | 5.1 ± 1.3 | 32.68 | 0.001 |
HGS-right, right handgrip strength; HGS-left, left handgrip strength; FLEX, flexibility; ABDO, abdominal resistance; rep, repetitions; HRmax, maximum heart rate; VO2peak, peak oxygen consumption; VO2peakBM, peak oxygen consumption relative to body mass; STS-time, supine-to-stand; s, seconds; STS-MC, motor competence.
aKruskal-Wallis test.
bDifferent from the IG.
cp < 0.05.
dDifferent from the SG.
ep < 0.01.
fDifferent than the SG.
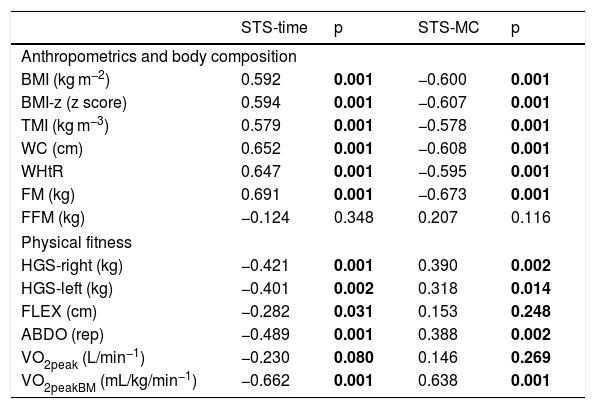
The correlations between anthropometric variables, body composition, physical fitness, and STS-time and STS-MC adjusted for sex, age, and somatic maturation (PHV) are shown in Table 3. Our data showed direct and moderate correlations between STS-time and BMI, BMI-z, TMI, WC, WHtR, and FM and moderate and inverse correlation with HGS-right, HGS-left, ABDO, and VO2peakBM. A strong and inverse correlation was found between STS-time and STS-MC (ρ = −0.70; p < 0.01). Fig. 1 shows the analysis of the correlations by each group. The greater the adiposity (BMI-z, WC and WHtR) the greater the STS-time. Muscle strength and cardiorespiratory conditioning were negatively correlated with STS-time.
Correlations of anthropometric variables, body composition, physical fitness, and performance in the STS-test (STS-time and STS-MC), adjusted for sex, age, and somatic maturation (PHV).
| STS-time | p | STS-MC | p | |
|---|---|---|---|---|
| Anthropometrics and body composition | ||||
| BMI (kg m−2) | 0.592 | 0.001 | −0.600 | 0.001 |
| BMI-z (z score) | 0.594 | 0.001 | −0.607 | 0.001 |
| TMI (kg m−3) | 0.579 | 0.001 | −0.578 | 0.001 |
| WC (cm) | 0.652 | 0.001 | −0.608 | 0.001 |
| WHtR | 0.647 | 0.001 | −0.595 | 0.001 |
| FM (kg) | 0.691 | 0.001 | −0.673 | 0.001 |
| FFM (kg) | −0.124 | 0.348 | 0.207 | 0.116 |
| Physical fitness | ||||
| HGS-right (kg) | −0.421 | 0.001 | 0.390 | 0.002 |
| HGS-left (kg) | −0.401 | 0.002 | 0.318 | 0.014 |
| FLEX (cm) | −0.282 | 0.031 | 0.153 | 0.248 |
| ABDO (rep) | −0.489 | 0.001 | 0.388 | 0.002 |
| VO2peak (L/min−1) | −0.230 | 0.080 | 0.146 | 0.269 |
| VO2peakBM (mL/kg/min−1) | −0.662 | 0.001 | 0.638 | 0.001 |
STS-time, supine-to-stand in seconds; STS-MC, motor competence; BMI, body mass index; BMI-z, body mass index z score; TMI, tri-ponderal mass index; WC, waist circumference; WHtR, waist/height ratio; FM, fat mass; FFM, fat-free mass; HGS-right, right handgrip strength; HGS-left, left handgrip strength; FLEX, flexibility; ABDO, abdominal resistance; VO2peak, peak oxygen consumption; VO2peakBM, peak oxygen consumption relative to body mass.

Correlations between anthropometrics, body composition, muscular function, cardiorespiratory fitness and STS-time. FG, fast group; IG, intermediate group; SG, slow group; STS-time, supine-to-stand in seconds; BMI-z, body mass index z score; TMI, tri-ponderal mass index; WC, waist circumference; WHtR, waist/height ratio; FM, fat mass; ABDO, abdominal resistance; HGS-right, right handgrip strength; HGS-left, left handgrip strength; VO2peakBM, peak oxygen consumption relative to body mass.
The STS-test has been proposed as an option to assess MC and physical capacity in different age groups,10–16,18 which makes it possible to detect development, stability and physical and motor decline in different age groups.11,13 Despite its broad use, the relationship between STS-test, body adiposity, and physical fitness in sedentary adolescents has been little explored.18 The current study addressed this issue by providing evidence, for the first time, that STS-test performance is related to adiposity and physical fitness in Brazilian adolescents. The main findings indicated the time taken to move from supine to standing and the movement pattern undertaken to do so, reflecting product and process MC respectively were associated with the excess of adipose tissue and low physical fitness in adolescents.
In regards to body adiposity, the results presented in this work reinforce differences between the performance groups in the STS-test for all variables that evaluated adiposity, as well as in body composition, except in FFM. The slow group showed the worst results regarding these variables when compared to adolescents who performed a faster STS-test. Despite the differences in the BMI-z, TMI, WHtR, age, and height of the sample, there are similarities of FFM between the groups. The FFM is composed of three components of the body composition (bone, residual and muscular mass), fractions that dependent on the age and height of the adolescents, variables that represent pubertal growth and development.27 However, in the present study, the FFM may not represent greater strength of muscle recruitment in individuals with shorter execution time in the STS-test. The differences seem in the STS-test performance to be related to overload exerted by excess body fat, in order to hamper the movement performed in the STS-test.
The results of the present study are, however, different from work conducted by Ng et al.16 who reported no significant relationships between BMI and STS-test in children aged three to eight years. The discrepancy may be due to differences in the sample population, e.g., children versus adolescents, or because there was a lower proportion of overweight children, as compared to the current study. The difference in the age range of the studies is important because in adolescence the increase in body adiposity, which occurs in the pre-stretch period, is a favorable factor for growth.27 However, if this accumulation is exaggerated it can result in excess weight at the end of the growth process in some adolescents, which contributes to less spontaneous participation in physical activities,28 a situation that leads to less development of physical fitness and it may cause delays in motor development.29
In the present study, we observed direct and moderate correlations between STS-time and BMI, BMI-z, TMI, WC, WHtR, and FM, which reflects that the greater the body adiposity, regardless of the evaluation used, the longer the execution time of the STS-test. Different results from Duncan et al.,15 who reported an inverse and moderate correlation between the duration of the STS-test and BMI in children. These differences, like those with the work of Ng et al.16 are expected given the lower age range and lower adiposity of the sample of the referred authors.
Participants allocated execution time showed lower values of (i.e. poorer performance) muscular strength, flexibility, and cardiorespiratory fitness compared to their peers allocated to the fast performer. The individuals in the three groups were similar in terms of mean HRmax, a variable that is predictive equations depends only on age.25 These observed results reinforce the argument that the groups evaluated differed by the level of physical fitness and not by the maturation phase. Duncan et al.15 conducted a study with five to nine-year-old children and reported an inverse and moderate correlation between STS-time and distance in horizontal jump, as well as a direct, moderate, and significant correlation between STS-time and the 10-meter run time. Duncan et al.15 suggested that these results demonstrated construct validity of the STS-test in a child population and corroborate with the results presented in the present research study supporting the assertion that the STS-test is reflective of functional motor performance.
In addition, abdominal resistance strength and cardiovascular conditioning were the physical fitness variables that most strongly correlated inversely with the STS-test performance. The abdominal resistance test aims to assess the maximum amount of trunk flexion for one minute, therefore to obtain a desirable result, the individual needs to be agile and present good muscle resistance. Agility is essential in the STS-test performance, which requires getting up as quickly as possible and activating the abdominal muscles as a priority to start the movement of ascent to the upright position. However, this factor can be affected by excessive body weight, because the body dimensions can influence the development of the STS-test movement.14
In addition, we verified differences in chronological age between the groups allocated according to the performance in the STS-test, where the slow STS-test group were younger than their faster peers, as well as presenting lower scores in process MC. Differences can be justified by the fact that younger adolescents present less refined motor patterns in the execution of the movements.30 This argument is in agreement with results presented by Ng et al.,16 who found an inverse correlation between test time and age. However, the authors only looked at the time taken, the product dimension in MC, where the current study has both process and product data, thus we extend understanding. The performance in the STS-test might depend on the motor repertoire of each individual and not only on the chronological age. Indeed, there are environmental factors that provide the construction and maturation of the motor collection, which act as stimuli according to the time of exposure and motor experiences.31
It is also important to note that there is variability among individuals of the same chronological age, due to differences in somatic and biological growth, becoming accentuated in the adolescence phase. Therefore, chronological age is of limited use in verifying relationships with growth and maturation variables.31 To minimize differences in chronological aspect, our study analyzed the APHV. The comparison with APHV did not show differences between the groups of STS-test, results might suggest that the acquisition of moving from STS-test has matured prior to adolescence. Therefore, the three groups of the STS-test are similar in terms of somatic age and maturation level, which suggests interferences from other variables, such as physical fitness and body composition in these adolescents.
This study demonstrated that individuals who presented the best performance in the STS-test also demonstrated superior physical fitness and healthier body composition. The current study, therefore, supports the assertion that the STS-test can be used as an alternative to measuring functional motor competence in adolescents, however, studies designed specifically for this purpose are needed to substantiate this claim. It is concluded that excess fat and low physical fitness decrease performance in the STS-test, a tool that can be used for screening in students to assess MC, reflecting the importance of early diagnosis for the development of better health standards in adolescents.
The strength of the current study is in examining the relationship of STS-test performance with multiple measures of body adiposity and physical fitness in Brazilian adolescents for the first time, demonstrating evidence of the validity of the STS-test as a measure of functional MC in this population. However, we are conscious that the sample size used in the present study does not make it possible to verify the specific STS-test normative standards for adolescents, which led to the use of the pattern described for adults. Likewise, the cross-sectional design employed does not allow causality to be inferred. Additional research corroborating the results presented in the current study would therefore be useful in establishing the utility of the STS-test in adolescents, a factor that will help in the construction of movement patterns in the adolescent age group.
FundingThis study was financed in part by the Coordenação de Aperfeiçoamento de Pessoal de Nível Superior - Brasil (CAPES) - Finance Code 001. This work and authors were supported by Brazilian funding agencies: CAPES, CNPq and Araucaria Foundation - PR/SESA-PR/CNPq/MS-Decit (PPSUS edital CP 01/2016). JM was supported by grants: FCT: SFRH/BSAB/142983/2018 and UID/DTP/00617/2019 as well as Santander University Program (2018).
Conflicts of interestThe authors declare no conflicts of interest.


