
To investigate the association between serum uric acid concentration according to the presence or absence of non-alcoholic fatty liver disease (NAFLD) and/or metabolic syndrome (MS) in overweight or obese children and adolescents.
MethodsThis was a cross-sectional study conducted from April of 2009 to March of 2010, including 129 children and adolescents treated at the Center for Childhood Obesity. Anthropometric data, blood pressure measurements, and laboratory test results were obtained, and NAFLD diagnosis was made by ultrasound. The diagnosis of MS was made using the criteria of the National Cholesterol Education Program/Adult Treatment Panel III, adapted to age range. The chi-squared test or or Fisher's test were used to evaluate the association of uric acid with the groups, with a 95% confidence interval. One-way analysis of variance (ANOVA) was used for comparison of means. Multiple logistic regression was used for adjustment of variables. The data were analyzed with the Statistical Package for Social Sciences (SPSS), release 17.
ResultsHigh levels of uric acid were significantly associated with adolescence, MS, and systolic blood pressure. The highest quartile of uric acid showed significantly higher values of body mass index, waist circumference, systolic blood pressure, diastolic blood pressure, triglycerides, total cholesterol, and homeostatic model assessment index (HOMA-IR), and lower mean values of HDL cholesterol. In the final model, only age range and the presence of MS remained associated with uric acid levels.
ConclusionsHigh levels of uric acid were associated with MS and adolescence, which was not observed with NAFLD.
Verificar a relação entre a concentração de ácido úrico sérico de acordo com a presença ou não de esteatose hepática não alcoólica e/ou síndrome metabólica (SM) em crianças e adolescentes com sobrepeso ou obesidade.
MétodosEstudo transversal desenvolvido no período de abril/2009 a março/2010, incluindo 129 crianças e adolescentes atendidos no Centro de Obesidade Infantil. Foi realizada antropometria, aferição da pressão arterial, dosagem dos exames laboratoriais e o diagnóstico de esteatose hepática por exame ultrassonográfico. Para o diagnóstico de SM, foram utilizados os critérios da National Cholesterol Education Program/Adult Treatment Panel III adaptados para faixa etária. Para avaliação da associação do ácido úrico com os grupos, foi realizado o teste do Qui-quadrado ou Fisher, adotando-se o intervalo de confiança de 95%. Para comparação de médias, utilizou-se o ANOVA One Way. Para o ajuste das variáveis foi utilizada a regressão logística múltipla. Os dados foram processados no SPSS versão 17.
ResultadosNíveis elevados de ácido úrico associaram-se significativamente à adolescência, SM e pressão arterial sistólica. O maior quartil de ácido úrico apresentou valores médios significativamente mais elevados de índice de massa corpórea, circunferência abdominal, pressão arterial sistólica, pressão arterial diastólica, triglicerídeos, colesterol total e HOMA-IR, e menor média do colesterol HDL. No modelo final só permaneceram associadas aos níveis de ácido úrico a faixa etária e a presença de síndrome metabólica.
ConclusõesNíveis elevados de ácido úrico estiveram associados à síndrome metabólica e à adolescência, o que não foi observado com a esteatose hepática.
Uric acid at normal plasma levels has been known to exert a neuroprotective effect, by acting as a free-radical scavenger; however, several observational studies have indicated that high levels of serum uric acid are associated with the risk of cardiovascular disease and may be useful in the assessment of individual cardiovascular risk. Furthermore, high uric acid levels have also been associated with insulin resistance (IR), diabetes mellitus type 2 (DM2), and metabolic syndrome (MS).1,2
Among these cardiometabolic alterations, MS has been stressed, as it represents a set of risk factors, which consists of alterations in the metabolism of carbohydrates – hyperinsulinemia, IR, glucose intolerance or DM2, lipid metabolism alterations (increased triglycerides (TG) and/or decreased cholesterol bound to high-density lipoprotein [HDL]), abdominal obesity, and high blood pressure.3
The hepatic expression of MS is nonalcoholic fatty liver disease (NAFLD), which is characterized by fat deposition in the hepatocytes of patients with little or no alcohol ingestion.4 In a study of 102 adults diagnosed with diabetes, it was observed that almost half NAFLD, and they also presented higher BMI and uric acid levels than individuals without NAFLD.5
Despite evidence that uric acid is considered a cardiometabolic risk factor,6 there is no reference in the literature to the association between this biochemical variable and steatosis in the pediatric population, especially among obese or overweight children and adolescents. Thus, this study aimed to investigate the association between serum uric acid levels according to the presence or absence of NAFLD and/or MS in overweight or obese children and adolescents.
MethodsThis was a cross-sectional study with a quantitative approach performed between July of 2009 and March of 2010, as part of a larger project entitled “Prevalence of cardiometabolic risk factors in overweight or obese children and adolescents”, approved by the Ethics Research Committee of the Universidade Estadual da Paraíba, under process No. 0040.0.133.000-08.
A convenience sample was used, consisting of overweight or obese children and adolescents aged between 2 and 18 years who were referred by health teams to the Childhood Obesity Center (Centro de Obesidade Infantil – COI), implemented at the Instituto de Saúde Elpídio de Almeida (ISEA), located in Campina Grande, state of Paraíba, Brazil, The enrollment was carried out at the Basic Health Units under the supervision of the health department of that municipality. The COI consists of researchers and a multidisciplinary team comprising endocrinologists, nutritionists, psychologists, nurses, pharmacists, social workers, and physical trainers.
A total of 131 patients were evaluated during this period; those who, at the time of data collection, had any chronic disease such as secondary hypertension, diabetes mellitus type 1, diagnosis of liver disease or inflammatory process, alcoholism, smoking, or who were using medication that interfered with glucose metabolism or lipids, such as steroids, were excluded. Two individuals were excluded due to corticosteroid use; thus, a total of 129 individuals were evaluated.
Parents or guardians who agreed to let their children participate in the study signed an informed consent, after being informed of the goals, methods, and procedures to be followed.
Data on socioeconomic status and personal and family history were obtained; anthropometric measurements were assessed by previously trained students, and laboratory testing and ultrasound examination were scheduled. Two measurements of anthropometric data (weight, height, and waist circumference) were performed on the same day, and the mean value was used in the analysis. Nutritional status was classified using the World Health Organization (WHO) Anthro (for children younger than 5 years) and AnthroPlus (≥ 5 years) software, obtaining the z-score related to body mass index (BMI) for age.
For children younger than 5 years, the use of the international reference by the WHO published in 2006 is recommended, classifying them as: at risk for overweight (z score+1<BMI ≤ z score+2), overweight (z score+2<BMI ≤ z score+3), and obesity (BMI>z score+3). For children aged 5 to 19 years, the use of the reference published by the WHO in 2007 is recommended, considering the following categories: overweight (z score+1<BMI ≤ z score+2), obesity (z score+2<BMI ≤ z score+3), and severe obesity (BMI>z score+3).7
For statistical analysis, the nutritional status was categorized into two groups, considering children younger than 5 years to be overweight when z score+1<BMI ≤ z score+3 and obese, when BMI>z score+3; those aged 5 years or older were considered to be overweight when z score+1<BMI<z score+2 and obese, when BMI ≥ z score+2.
The waist circumference (WC) was measured using an inelastic tape at midpoint between the superior border of the iliac crest and the inferior costal margin. Values >90th percentile were considered increased. However, girls with WC ≥ 88cm and boys with WC ≥ 102cm were considered as having altered results regardless of the percentile.8
Three blood pressure measurements were performed with a two-minute interval between them, according to the method established in the V Brazilian guidelines on hypertension.9 The mean of the last two measurements was considered as the systolic (SBP) and diastolic (DBP) blood pressure values.
The diagnosis of steatosis was based on the results of ultrasonography of the upper abdomen, performed at the Hospital Universitário Alcides Carneiro (HUAC), by a single radiologist blinded to clinical data and laboratory test results. The equipment used was a MedisonSonoAce Prime 8000EX, with a multifrequency convex transducer of 5MHz. Alterations in liver parenchyma were classified as normal, mild, moderate, and severe diffuse steatosis.10 This classification uses as parameters the liver echogenicity in comparison with the renal cortex, the echo penetration intensity in the liver parenchyma, the diaphragm visibility, and the echogenicity of the liver vascular structures.11
Blood collection was performed after a 10 to 12 hour fast, at the Clinical Analysis Laboratory of the Universidade Estadual da Paraíba (LAC/UEPB).
The measurements of uric acid, HDL-C, TG, and glucose were performed by the enzymatic colorimetric method in automated equipment (BioSystems 310 model), according to the recommendations of the Labtest® kit manufacturer. Insulin was measured by chemiluminescence in automated equipment (IMMULITE 1000 - SIEMENS®). Hyperuricemia was considered with values >5.5mg/dL.12 The homeostatic model assessment index (HOMA-IR) was used as the criterion for the diagnosis of IR. The cutoff used was HOMA-IR ≥ 2.5.13
The diagnosis of MS was attained using the criteria recommended by the National Cholesterol Education Program/Adult Treatment Panel III14 adapted to the age group, which considers as MS the presence of at least three of the following items: WC ≥ 90th percentile for age, gender, and ethnicity; TG ≥ 130mg/dL and/or HDL-C<45mg/dL, fasting glucose ≥ 100mg/dL, SBP and/or DBP>90th percentile for gender, height, and age. The cutoffs for TG, HDL-C, and fasting glucose followed the values recommended in the I guideline for atherosclerosis prevention in childhood and adolescence.15
The following groups were considered according to the presence and/or absence of MS and NAFLD: G1 - presence of MS and steatosis; G2 - presence of MS without steatosis; G3 - absence of MS and presence of steatosis; G4 – absence of MS and steatosis.
The data were presented as proportions, means, and standard deviations (SD). After applying the Kolmogorov-Smirnoff test to assess for normality, the association of uric acid levels with gender, age range, ethnicity, nutritional status, WC, SBP, DBP, TG, fasting glucose, IR, MS, and hepatic steatosis was verified using the chi-squared or Fisher's exact test, when necessary, with a 95% confidence interval (95% CI) and prevalence ratio (PR). One way analysis of variance (ANOVA) was used for comparison of the means of MS components according to quartiles of uric acid and, when necessary, using Bonferroni's post hoc test.
Multiple logistic regression was used for variable adjustment, whose criterion for variable inclusion was the association with the dependent variable in the bivariate analysis with p-value<0.20. The variables were included in the regression analysis using the ‘enter’ method, according to the decreasing value of odds ratio. The Hosmer-Lemeshow test was used as a measure of quality-of-fit for the logistic regression models, in which a p-value ≥ 0.05 indicates that the model is adjusted.
All analyses were two-tailed and were performed using the Statistical Package for Social Sciences (SPSS), release 17.0 (SPSS Inc, Chicago, USA) with the significance level set at 5%.
ResultsOf the 129 children and adolescents evaluated, 62.8% (81/129) were females and 65.9% (85/129) were non-white. The mean age was 11.27 (SD=±3.72) and age distribution indicated that 61.4% (86/129) were adolescents (10 to 18 years). Regarding the socioeconomic characteristics, 56.6% (69/122) had a family income of up to two Brazilian minimum wages. With regard to maternal education, 57.5% (73/127) had completed high school.
The mean uric acid level found was 4.191mg/dL (± SD=2.32). Hyperuricemia was observed in 12.4% (16/129) of assessed individuals, MS in 49.6% (64/129), and RI was diagnosed in 44.2% (57/129) of them. NAFLD was diagnosed in 28.7% (37/129) of children and adolescents.
Low levels of HDL-C were observed in 85.3% (110/129) of the assessed individuals, and 39.5% (51/129) had hypertriglyceridemia. Hyperglycemia was observed in only 0.8% (1/129) of the assessed individuals. SBP was high in 34.1% (44/129) and DBP in 64.3% (83/129) of the individuals.
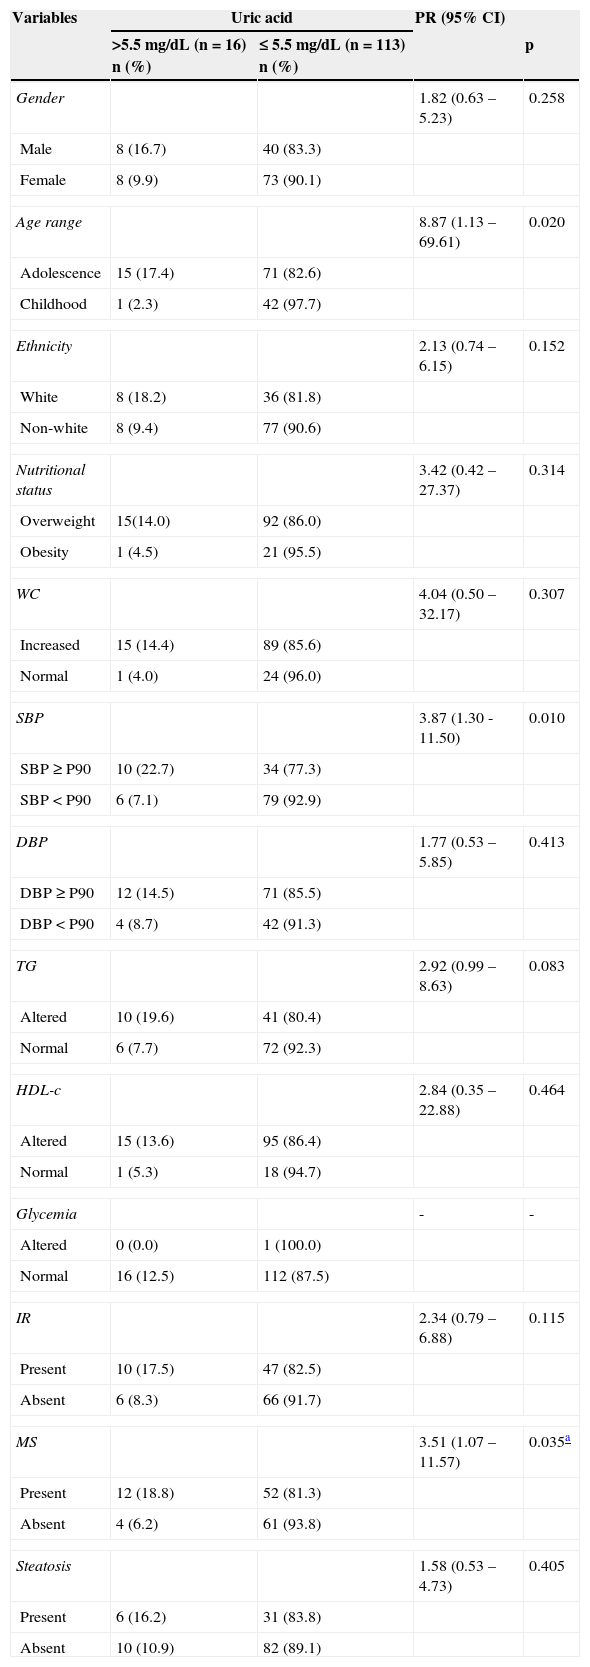
Table 1 shows that higher values of uric acid were significantly associated with adolescence, altered SBP, hypertriglyceridemia, and MS. No significance was observed when correlating levels of uric acid with the presence of steatosis. The chance of having hyperuricemia was higher in the following groups: adolescence (PR=8.87), high SBP (PR=3.87), and those with MS (PR=3.51).
Social, anthropometric, clinical and laboratory variables according to serum levels of uric acid in 129 overweight or obese children and adolescents. Centro de Obesidade Infantil, ISEA, Campina Grande-PB, 2009-2010.
| Variables | Uric acid | PR (95% CI) | ||
|---|---|---|---|---|
| >5.5 mg/dL (n=16) n (%) | ≤ 5.5 mg/dL (n=113) n (%) | p | ||
| Gender | 1.82 (0.63 – 5.23) | 0.258 | ||
| Male | 8 (16.7) | 40 (83.3) | ||
| Female | 8 (9.9) | 73 (90.1) | ||
| Age range | 8.87 (1.13 – 69.61) | 0.020 | ||
| Adolescence | 15 (17.4) | 71 (82.6) | ||
| Childhood | 1 (2.3) | 42 (97.7) | ||
| Ethnicity | 2.13 (0.74 – 6.15) | 0.152 | ||
| White | 8 (18.2) | 36 (81.8) | ||
| Non-white | 8 (9.4) | 77 (90.6) | ||
| Nutritional status | 3.42 (0.42 – 27.37) | 0.314 | ||
| Overweight | 15(14.0) | 92 (86.0) | ||
| Obesity | 1 (4.5) | 21 (95.5) | ||
| WC | 4.04 (0.50 – 32.17) | 0.307 | ||
| Increased | 15 (14.4) | 89 (85.6) | ||
| Normal | 1 (4.0) | 24 (96.0) | ||
| SBP | 3.87 (1.30 -11.50) | 0.010 | ||
| SBP ≥ P90 | 10 (22.7) | 34 (77.3) | ||
| SBP<P90 | 6 (7.1) | 79 (92.9) | ||
| DBP | 1.77 (0.53 – 5.85) | 0.413 | ||
| DBP ≥ P90 | 12 (14.5) | 71 (85.5) | ||
| DBP<P90 | 4 (8.7) | 42 (91.3) | ||
| TG | 2.92 (0.99 – 8.63) | 0.083 | ||
| Altered | 10 (19.6) | 41 (80.4) | ||
| Normal | 6 (7.7) | 72 (92.3) | ||
| HDL-c | 2.84 (0.35 – 22.88) | 0.464 | ||
| Altered | 15 (13.6) | 95 (86.4) | ||
| Normal | 1 (5.3) | 18 (94.7) | ||
| Glycemia | - | - | ||
| Altered | 0 (0.0) | 1 (100.0) | ||
| Normal | 16 (12.5) | 112 (87.5) | ||
| IR | 2.34 (0.79 – 6.88) | 0.115 | ||
| Present | 10 (17.5) | 47 (82.5) | ||
| Absent | 6 (8.3) | 66 (91.7) | ||
| MS | 3.51 (1.07 – 11.57) | 0.035a | ||
| Present | 12 (18.8) | 52 (81.3) | ||
| Absent | 4 (6.2) | 61 (93.8) | ||
| Steatosis | 1.58 (0.53 – 4.73) | 0.405 | ||
| Present | 6 (16.2) | 31 (83.8) | ||
| Absent | 10 (10.9) | 82 (89.1) | ||
CI, confidence interval; DBP, diastolic blood pressure; HDL-C, high-density lipoprotein; IR, insulin resistance; MS, metabolic syndrome; PR, prevalence ratio; SBP, systolic blood pressure; TG, triglycerides; WC, waist circumference.
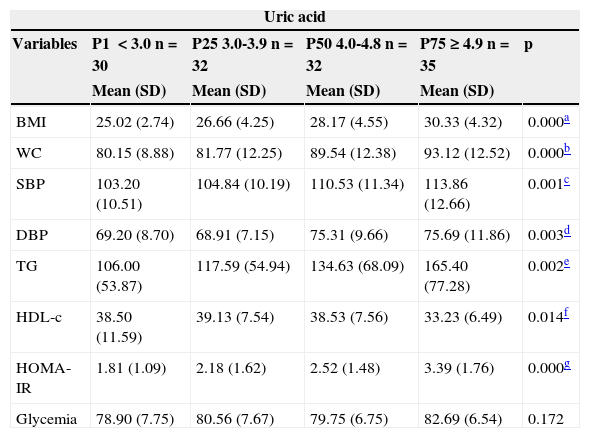
The quartiles of uric acid observed were:<3.0; 3.0-3.9; 4.0-4.8; and ≥ 4.9. Table 2 shows that the group consisting of individuals from the 4th quartile (percentile>75th for uric acid values) showed significantly higher values of BMI, WC, SBP, DBP, TG, and HOMA-IR, and lower mean of HDL-C (Table 2).
Mean values of BMI, blood glucose, WC, SBP, DBP and HOMA-IR quartiles according to uric acid of 129 overweight or obese children and adolescents. Centro de Obesidade Infantil, ISEA, Campina Grande-PB, 2009-2010.
| Uric acid | |||||
|---|---|---|---|---|---|
| Variables | P1 <3.0 n=30 | P25 3.0-3.9 n=32 | P50 4.0-4.8 n=32 | P75 ≥ 4.9 n=35 | p |
| Mean (SD) | Mean (SD) | Mean (SD) | Mean (SD) | ||
| BMI | 25.02 (2.74) | 26.66 (4.25) | 28.17 (4.55) | 30.33 (4.32) | 0.000a |
| WC | 80.15 (8.88) | 81.77 (12.25) | 89.54 (12.38) | 93.12 (12.52) | 0.000b |
| SBP | 103.20 (10.51) | 104.84 (10.19) | 110.53 (11.34) | 113.86 (12.66) | 0.001c |
| DBP | 69.20 (8.70) | 68.91 (7.15) | 75.31 (9.66) | 75.69 (11.86) | 0.003d |
| TG | 106.00 (53.87) | 117.59 (54.94) | 134.63 (68.09) | 165.40 (77.28) | 0.002e |
| HDL-c | 38.50 (11.59) | 39.13 (7.54) | 38.53 (7.56) | 33.23 (6.49) | 0.014f |
| HOMA- IR | 1.81 (1.09) | 2.18 (1.62) | 2.52 (1.48) | 3.39 (1.76) | 0.000g |
| Glycemia | 78.90 (7.75) | 80.56 (7.67) | 79.75 (6.75) | 82.69 (6.54) | 0.172 |
BMI, body mass index; DBP, diastolic blood pressure; HDL-C, high-density lipoprotein; HOMA-IR, homeostatic model assessment index; SBP, systolic blood pressure; SD, standard deviation; TG, triglycerides; WC, waist circumference.
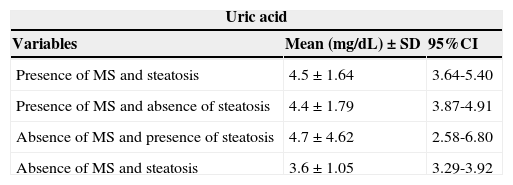
There was no association between levels of uric acid and the combined groups according to the presence/absence of MS and nonalcoholic hepatic steatosis (Table 3).
Uric acid values according to the presence and/or absence of metabolic syndrome and liver steatosis in 129 overweight or obese children and adolescents. Centro de Obesidade Infantil, ISEA, Campina Grande-PB, 2009 - 2010.
| Uric acid | ||
|---|---|---|
| Variables | Mean (mg/dL)±SD | 95%CI |
| Presence of MS and steatosis | 4.5±1.64 | 3.64-5.40 |
| Presence of MS and absence of steatosis | 4.4±1.79 | 3.87-4.91 |
| Absence of MS and presence of steatosis | 4.7±4.62 | 2.58-6.80 |
| Absence of MS and steatosis | 3.6±1.05 | 3.29-3.92 |
CI, confidence interval; MS, metabolic syndrome; SD, standard deviation.
p=0.220.
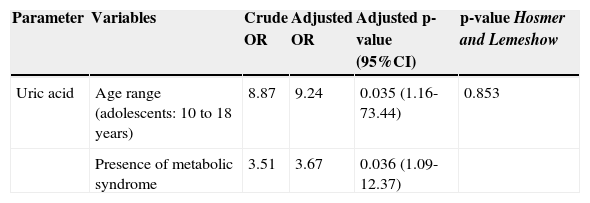
Through multiple logistic regression analysis, it was observed that in the final model, only age and the presence of MS remained associated with uric acid levels. It was observed that, among adolescents, the odds of having increased uric acid levels was approximately nine times higher than among children; when compared with patients with MS, this probability was 3.7 times greater. As demonstrated by the results of the Hosmer and Lemeshow test, the model showed a good fit (Table 4).
Crude and adjusted odds ratio (95% confidence interval) of alterations in uric acid in 129 overweight or obese children and adolescents. Centro de Obesidade Infantil, ISEA, Campina Grande-PB, 2009 – 2010.
| Parameter | Variables | Crude OR | Adjusted OR | Adjusted p-value (95%CI) | p-value Hosmer and Lemeshow |
|---|---|---|---|---|---|
| Uric acid | Age range (adolescents: 10 to 18 years) | 8.87 | 9.24 | 0.035 (1.16-73.44) | 0.853 |
| Presence of metabolic syndrome | 3.51 | 3.67 | 0.036 (1.09-12.37) |
Serum uric acid is the primary end product of purine metabolism in humans, and its levels are strictly controlled by the balance between production and excretion.16 In this study, high levels of uric acid were associated with adolescence and MS. It is noteworthy that there was no association between increased levels of uric acid with the diagnosis of overweight and obesity and with the presence of NAFLD.
In this study, the prevalence of MS was higher than that found by other authors who evaluated obese children and adolescents,17,18 and confirms previous results from a sample of hypertensive adults from Cuiabá, state of Mato Grosso, in which the prevalence of high levels of uric acid was significantly higher in patients with MS.19
The evidence that explains the association of uric acid with MS is based on two mechanisms. The first mechanism is related to the fact that glucose uptake in skeletal muscle partially depends on the increase in insulin-mediated blood flow, stimulating the release of nitric oxide from endothelial cells. Components of MS developed in mice with endothelial nitric oxide synthesis. The second mechanism is related to the fact that uric acid induces oxidative and inflammatory alterations in adipocytes, since xanthine oxidoreductase (the enzyme that generates uric acid from xanthine) is expressed in adipocytes and is critical to the adipogenesis process.20
Pacifico et al.,21 in a study performed in Italy to verify the association of hyperuricemia with MS and atherosclerosis in obese children and adolescents, concluded that patients with high uric acid levels had a higher incidence of carotid atherosclerosis as demonstrated by the thickening of the carotid intima-media, assessed by Doppler ultrasonography of this region.
It was observed that individuals with high SBP were approximately four times more likely to have hyperuricemia; a biological explanation for this fact is supported by a study performed in an animal model with rats, which demonstrated that after induction of hyperuricemia there was development of hypertension, probably due to reduction in nitric oxide in renal macula densa and by direct stimulation of the renin-angiotensin system, as both mechanisms cause vasoconstriction and therefore increase blood pressure.22
Regarding the variables of lipid metabolism an association between uric acid levels and the means of TG and HDL (inversely associated with the latter) has been demonstrated,1,23 confirming the findings of the present study.
The finding of hyperglycemia in this age group is unusual, as the more frequent manifestation of glucose metabolism is IR, which is a compensatory mechanism, while glucose tolerance remains normal.24
Although no association with hepatic steatosis was observed in this sample, recent studies have described a significant association between high levels of uric acid and NAFLD, representing an independent risk factor for liver disease.25–27
The most plausible explanation for this association, which has been inferred from the current understanding of NAFLD progression, would be the “two-hit” theory. According to this theory, the accumulation of fat in the liver is the first “hit”, which makes the hepatocytes more vulnerable to further damage due to certain triggers, such as IR, excess inflammation, alcohol consumption, and obesity. In this process, IR plays a central role in the vicious circle, which promotes lipolysis of the peripheral adipose tissue and increases the influx of free fatty acids into the liver. This IR leads to hyperinsulinemia, which increases the synthesis of uric acid and decreases its renal excretion.24
Oxidative stress appears to be involved in the “hit” process, which promotes lipid peroxidation and the inflammatory response. Uric acid reflects the rate of cell renewal, which in itself can be a part of the inflammatory process, making it a pro-inflammatory factor. Uric acid increases interleukin (IL)-6 and tumor necrosis factor alpha (TNF-α) levels. Thus, high levels of uric acid in blood are due to oxidative stress that occurs in response to metabolic disorders.28
A study by Roberts et al.29 demonstrated that uric acid clearance in the obese group was lower than in the control group, suggesting that hyperuricemia in the obese population would be mainly attributed to a decrease in the clearance of uric acid, rather than to an overproduction of urates.
The method used to diagnose NAFLD was considered a limitation of the present study, as the gold standard is biopsy, an invasive and expensive technique. Thus, the ultrasound technique was chosen, which has been widely used in public health studies due to its easy accessibility, safety, and excellent sensitivity, especially when evaluating the pediatric population.
In conclusion, high levels of uric acid were associated with MS and adolescence, which was not observed with NAFLD. The possibility of cardiovascular complications does not depend on a particular factor, rather on the concomitant presence of individual characteristics capable of increasing this possibility – symptomatic or not – in target organs and associated clinical complications. Thus, the inclusion of measurement of uric acid levels in the assessment protocols for obese or overweight children and adolescents is suggested, in order to verify possible complications of early cardiovascular alterations.
FundingThis study received financial support from the Fundação de Apoio à Pesquisa do Estado da Paraíba (FAPESQ) through Edict 01/2008 (FAPESQ/PB-MCT/CNPq Termo de Concessão No. 198/08) and from Universidade Estadual da Paraíba, through Programa de Incentivo à Pós-Graduação e Pesquisa (PROPESQ) Edict 01/2008 (PRPGP/UEPB Termo de Concessão No. 98/2008).
Conflicts of interestThe authors declare no conflicts of interest.
Please cite this article as: Cardoso AS, Gonzaga NC, Medeiros CC, de Carvalho DF. Association of uric acid levels with components of metabolic syndrome and non-alcoholic fatty liver disease in overweight or obese children and adolescents. J Pediatr (Rio J). 2013;89:412–8.


