


To study the association between placental efficiency with anthropometry and nutritional phenotypes in full-term newborns from a birth cohort.
MethodThis was a secondary cross-sectional analysis of data obtained in a cohort study (Brazilian RibeirãoPreto and São Luís Birth Cohort Studies - BRISA), whose deliveries were performed between 2010 and 2011. Standardized questionnaires were applied to mothers, and placentas and newborns were evaluated shortly after delivery. Placental efficiency was assessed using the ratio between birth weight and placental weight (BW/PW ratio); values below the lower quartile (25th percentile for gestational age) were considered to have low placental efficiency. Newborn phenotypes were small and large for gestational age, stunted and wasted, evaluated using the INTERGROWTH-21 growth standard. To identify the confounding variables theoretical model was constructed using Directed Acyclic Graphs, and unadjusted and adjusted logistic regression were performed. Placental measurements were obtained blindly from pregnancy and delivery data.
Results723 mother-placenta-child triads were studied. 3.2 % of newborns were small-for-gestational-age (SGA), 6.5 %large-for-gestational-age (LGA), 5.7 %had stunting, and 0.27 % wasting. A significantly higher risk was found between low placental efficiency and SGA (OR 2.82;95 % CI 1.05–7.57), stunting (OR 2.23; 95 % CI 1.07–4.65), and wasting (OR 8.22; 95 % CI 1.96–34.37). No relationship was found between LGA and placental efficiency.
ConclusionsLow placental efficiency was associated with increased risk for small-for-gestational-age, stunting, and wasting. Placental morphometry can provide valuable information on intrauterine conditions and neonatal health, helping to identify newborns at higher risk of future comorbidities.
The placenta plays a central role in fetal growth and development during the intrauterine period. It is a multifunctional organ that grows continuously with the fetus and its structure and function evolve progressively and temporarily assuming respiratory, nutritional, excretory, immunological and endocrine functions.1
Abnormal placental function affects the health of the mother and fetus, with impaired nutrient supply and increased risk of fetal growth restriction (FGR) and premature birth with increased perinatal morbidity and mortality and possible impact on health even after the neonatal period.
There is increasing evidence that features of placental gross morphology are linked biologically to the functional capacity of the placenta,2 but it has received little clinical interest. The morphological evaluation of the placenta immediately after birth can provide information about the intrauterine conditions and the fetal-placental adaptations that have taken place to meet the demands of fetal growth.
In addition to placental measurements -weight, diameter, and thickness-, different ratios involving birth weight (BW) and placental weight (PW) have been proposed as possible indicators of placental function and susceptibility to adverse perinatal outcomes and chronic diseases in childhood and adulthood.2–3
Morphological characteristics of the placenta were associated with FGR, lower birth weight4 and decreased head circumference (HC) at birth, with reduced cerebral cortical gray matter and hippocampal volume,5 in addition to a decreased intelligence quotient in schoolchildren6 and increased risk of developing chronic diseases in early adulthood.7
The term placental insufficiency is used to describe the abnormal transport of nutrients with repercussions on maternal and fetal health. The underlying causes of placental insufficiency remain poorly understood, but most investigators agree that a common mechanism is abnormal remodeling of the uterine spiral arteries, most likely caused by an imbalance in maternal angiogenic factors, leading to superficial invasion of the placenta into the vascular wall. Regardless of the mechanism, remodeling of the spiral arteries in the first and early second trimesters leads to abnormal blood flow and damage to the placenta, leading to complications in pregnancy. However, to date, it has not been possible to fully understand the relationship between placental function and adverse outcomes, nor to establish reliable parameters for its assessment and application in clinical practice.28
Nevertheless, after birth, size at birth is an important tool for the clinical evaluation of the newborn (NB) by abnormal nutritional phenotypes, one of the main parameters for predicting the risk of neonatal mortality and childhood morbidities.9
Thus, this study aimed to evaluate the birth weight/placental weight ratio (BW/PW) as a proxy for placental efficiency and its association with anthropometry and nutritional phenotypes of full-term newborns in a birth cohort in Ribeirão Preto, SP, Brazil.
MethodsStudy designSecondary cross-sectional data was obtained from a prenatal cohort study, with a descriptive and analytical approach.
Study populationThis study was part of the ‘‘Etiological Factors of Preterm Birth and Consequences of Perinatal Factors in Child Health: Birth Cohorts in Two Brazilian Cities’’, known as BRISA (Brazilian Ribeirão Preto and São Luis Birth Cohort) study.10 The study population consisted of a convenience sample of 1067 trios of mothers, newborns, and placentas, whose delivery was performed at the Hospital das Clínicas of the Faculty of Medicine of Ribeirão Preto (HCFMRP), from January 1, 2010, to June 28, 2011. Cases of multiple pregnancies and absence of placental information were excluded, as well as preterm newborns (NBs) (< 37 weeks) and those with major malformations.
Mother and newborn evaluationInformation on demographic and social data, maternal health, pregnancy and prenatal care characteristics, and mother's lifestyle habits were obtained through a standardized questionnaire addressed to postpartum women.
Data on newborns, BW in grams, length in centimeters, gestational age (GA) at birth in completed weeks, sex, presence of malformations, and Apgar scores were obtained from the medical records.
To evaluate the parameters of BW, length, and BMI, the Intergrowth-21(IG21) standard for GA and sex was used.11 The following nutritional phenotypes were defined: for BW, newborns below the 3rd percentile (p3) were considered small for gestational age (SGA), and those above the 97th percentile (p97) were considered large for gestational age (LGA). Newborns' length below p3 was considered stunted, whereas BMI below p3 was classified as wasted.
Placental evaluationPlacentas were weighed in grams (g) on an electronic scale after cutting the cord and membranes by the Department of Pathology of HCFMRP according to standardized procedures;12 measurements were obtained blindly from pregnancy and delivery data.
The ratio between BW and PW in grams (BW/PW, independent variable) was used as a proxy for placental efficiency. The values were distributed according to gestational age (GA), and BW/PW ratio values below the lower quartile were considered indicators of low placental efficiency.13
Statistical análisisNormally distributed data were presented as means and standard deviations (SD), and categorical variables were described as numbers and frequencies. To identify the confounding variables, a theoretical model was built using Directed Acyclic Graphs (DAG),14 and the following confounding variables were identified: maternal age (< 20, 20–34, ≥ 35 years), pre-gestational BMI (underweight, adequate, overweight and obesity), parity (1, 2–3, ≥ 4 children) and presence of tobacco, alcohol, diabetes, hypertension and anemia during pregnancy (Figure 1, Supplemental Material). Unadjusted and adjusted logistic regression analyses were applied, with a significance level of 5 %, using the Stata 14.0 software.
Sample size: Considering a placental insufficiency prevalence of 24,6 %, absolute error of 1 %, and confidence interval of 95 % the authors needed 658 newborns.
The project was approved by the ethics committee of the HCFMRP (process No. 11,157/2008) and all mothers were instructed about the study, agreed to participate, and signed an informed consent form.
This article followed the STROBE recommendations for observational epidemiological studies.
ResultsPopulationFrom the original sample of 1067 participants, 238 preterm, 6 post-term (over 42 weeks GA) NBs, 25 with major malformations, 14 multiple pregnancies, and 61 with lack of placental information were excluded, resulting in a final population of 723 triads of mothers, NBs and placentas (Figure 2, Supplemental material).
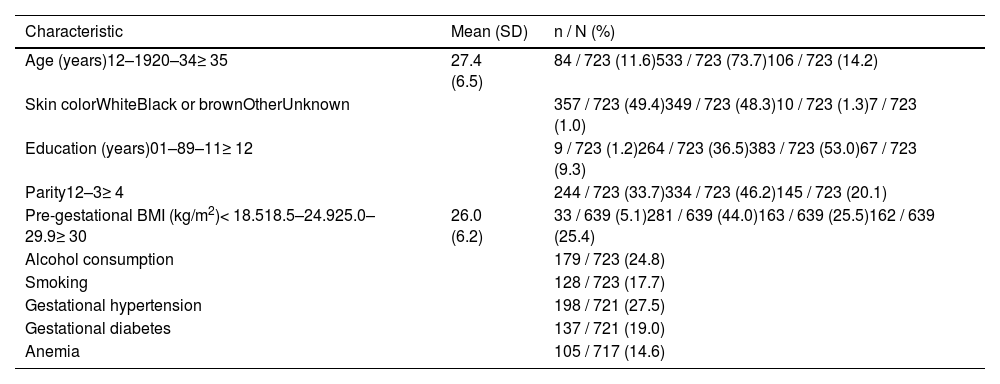
Maternal and newborn characteristicsThe mean maternal age was 27.4 years, 11.6 % were adolescents and 14.2 % were 35 years or older. Almost half of the mothers were white, 98.8 % attended school, 33.7 % were primiparous, 30,5 % were overweight or obese, 27.5 % had hypertension, and 19 % had diabetes (Table 1).
Maternal characteristics. BRISA-HCFMRP cohort, 2010–2011.
SD, standard deviation; BMI, body mass index.
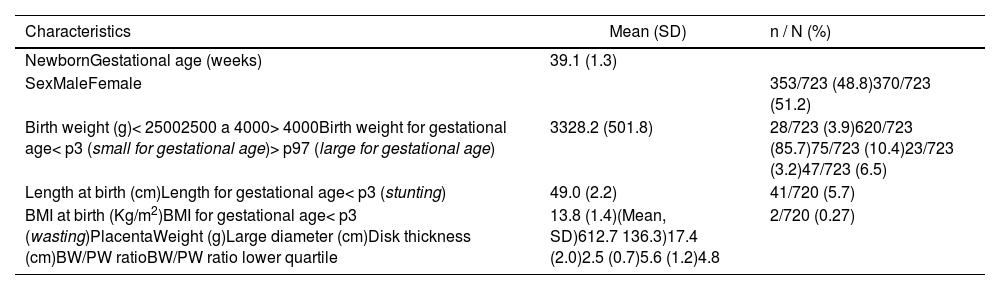
The mean gestational age was 39.1 weeks. The average birth weight was 3328 g, with 3.9 % weighing less than 2500, 3.2 % were SGA, and 6.5 % LGA, according to IG-21. The mean length was 49 cm, and 5.7 % were stunted. The average BMI was 13.8 kg/m² and 0.27 % showed wasting (Table 2).
Newborn and placenta characteristics. BRISA-HCFMRP cohort, 2010–2011.
SD, standard deviation; BMI, body mass index; p3, 3rd percentil; p97, 97th percentil; BW/PW, birth weight/placental weight ratio.
The mean PW was 612.7 g, the mean largest diameter was 17.4 cm, and the mean thickness was 2.5 cm. The mean BW/PW ratio was 5.61 and the mean lower quartile was 4.89 (Table 2).
There was a positive correlation between BW/PW ratio and gestational age (r = 0.145, p < 0.001). The value of the BW/PW lower quartile varied according to gestational age, from 4.76 at 37+0 weeks to 5.21 at 42+6 weeks (Figure 1).

All placental measures (PMs) were consistently higher in males than females, without statistical significance (data not shown).
Risk of nutritional phenotypes associated with placental efficiencyA two-fold increased adjusted risk of weight and length below the third percentile (p3) and eight times greater for BMI below the p3 associated with low placental efficiency was observed. No relationship was found between LGA and placental efficiency (Table 3).
Crude and adjusted risk of nutritional phenotypes at birth with BW/ PW ratio below the lower quartile. BRISA Cohort - HCFMRP, 2010–2011.
BW, Birth weight; PW, placental weight; OR, odds ratio; p, p-value; CI, confidence interval; BMI, body mass index; p3, 3rd percentile; p97, 97th percentile.
Variables of adjustment: maternal age, pre-gestational BMI, parity, smoke. alcohol, diabetes, hypertension and anemia during pregnancy.
The authors have demonstrated that the efficiency of placental function as reflected in the fetoplacental weight ratio is strongly associated with altered nutritional phenotypes (SGA, stunted and wasted) in full-term newborns from the 2010/2011 Ribeirão Preto birth cohort, and this has both physiologic and functional implications.
These phenotypes can be used in multivariate models for screening and identifying high-risk babies. In this study, 3.2 % of newborns were SGA, 6.5 % LGA, 5.7 % stunted, and 0.27 % wasting, results that differ from the normally expected pattern. Also, shows a low frequency of fetal growth restriction, with a deficit in length more frequent than that of BMI, and, on the other hand, a higher incidence of being overweight.
SGA was defined as BW for age and sex below the 3rd percentile, rather than the 10th percentile as used most often, indicating a more serious insult and reducing the likelihood of misclassifying a normal newborn as SGA. It is estimated that in the SGA below the 10th percentile group, 60 % are growth-restricted, and 40 % are constitutionally small.15
SGA and LGA rates may be related to maternal size, as increased maternal height and weight are associated with increased newborn weight, even for women with normal BMI. In addition, probably, the higher frequency of NBs LGA was due to the elevated prevalence of maternal pre-pregnancy overweight; in the present study, 30,5 % of mothers were overweight or obese, of high parity (20.1 %) and gestational diabetes (19 %), as well as alcohol consumption (24.8 %), all recognized factors associated with higher birth weight.
Other studies that used the IG-21 standard also revealed a markedly high prevalence of LGA babies. A Canadian population-based study with single live births revealed that, according to the IG-21 standard, 9.63 % of newborns weighed above the 97th percentile, while according to a Canadian reference, 3.55 % had birth weight above the 97th percentile.15
The BW/PW ratio is a simple one to calculate in epidemiological studies and encapsulates many different factors, such as placental exchange surface area, transporter density and activity, and blood flow rates, which would require more detailed individual stereological, molecular, or physiological analyses.16 It might be assumed that the more weight achieved per gram of placenta, the better the fetal outcome. However, plasticity is lost as the term approaches; consequently when, and how, the human placenta is able to adapt to different nutritional conditions is poorly understood.
Gestational changes occur in placental transport. Net flux across the placenta accelerates at the fastest rate during the second trimester. Therefore, it seems reasonable to postulate that there might be considerable changes in the transporting capability of the placenta towards the end of the first trimester and the early second trimester to enable this acceleration to occur toward the term that explains the increase in the BW/PW ratio (Figure 1, Supplemental Material).17
There is considerable variation in placental efficiency across the birth weight range, with a “U”-shaped pattern, and on average, boys have heavier birth weights per gram of placenta. There is increasing evidence that placental efficiency changes over time in any given population and is likely to be influenced by the nutritional environment. This finding suggests that the nutritional conditions across the life of a woman are highly influential in the establishment and growth of the placenta, and thus impact the lifelong health risks of her offspring.18
The use of the birth weight to placental weight ratio as an indicator of efficiency in transferring nutrients across the placenta is strongly supported by studies carried out in rats and other mammals, with clear evidence that the placenta adapts its ability to transfer nutrients according to their size.2–3 In humans, although the relationship between placental size and nutrient transfer capacity is not fully understood, the BW/PW ratio has been associated with perinatal health conditions, during childhood and throughout life.37
Studies carried out with populations of different ethnicities, in Nigeria,19 Argentina,20 and Japan21 observed a variation in BW/PW values according to gestational age, with a mean increasing trend with the progression of pregnancy, a trend similar to that found in the present study, which reinforces the findings previously demonstrated, and in agreement with the positive correlation between BW/PW ratio and gestational age observed. This tendency is probably because in early pregnancy placental growth is proportionally greater than fetal growth; as pregnancy progresses, this relationship is inverted, and fetal growth becomes proportionally greater than placental growth.22
A low BW/PW ratio describes fetuses with a relatively higher placental weight compared to the birth weight, whereby the nutrient transfer is reduced per gram placenta. However, the birth weight to placenta weight ratio also increases in conditions with FGR, demonstrating a closer association between slower fetal growth and a relatively wide and flat placenta, rather than a relatively thick placenta.23
In a previous study, the BW/PW ratio below the lower tertile was associated with an increased risk of pre-eclampsia, induced labor, cesarean section, and spontaneous preterm birth (p < 0.001), whereas a ratio between the lower and higher tertiles, was associated with an increased risk of low birth weight (< 2500 g, p < 0.001).24
Misra et al. showed in a study that included 24,000 placentas between 34 and 42 weeks a fetoplacental weight ratio of 7.56 (SD 1.20) and a consistent relationship with chorionic plate area and chorionic disc thickness, suggesting a relationship of BW/PW ratio with intervillous perfusion and placental resistance (via increased ramification of the muscularized fetal stem arterioles).6
The higher risks of nutritional phenotypes associated with low placental efficiency are of concern, as babies weighing below p3 or above p97, according to the IG-21 standard, have a higher risk of neonatal morbidity and mortality.25 In addition, the reduction in length below p3 occurs as a result of prolonged intrauterine growth restriction and is not amenable to rapid nutritional treatment, thus requiring prevention rather than treatment,26 while the reduction in BMI results from acute in-utero damage that might be reversible through appropriate postnatal nurturing and rehabilitation during the first 1000 days of life.27
The main limitation of this study is that, although the sample size was relatively large, it was derived from a convenience sample in a maternity hospital belonging to a high-complexity facility, and the prevalence of comorbidities among pregnant women was higher than that found in the general population, which makes it difficult to extrapolate our findings.
In addition, the use of digital images of the placenta has been proposed to avoid observer bias.28 However, to validate the results, longitudinal studies of a cohort of placentas would be needed to record real-time morphometry during pregnancy, which, in addition to being quite complicated and expensive to perform, could be developed by ultrasound or magnetic resonance, whose estimates show an error of 10 to 20 %.29
The placentas were evaluated by technically trained professionals according to standardized procedures12 and the measurements were obtained blindly from the pregnancy and delivery data, to avoid observer bias.
The main contributions of this study were the observation of significantly increased risk for several nutritional phenotypes30 below p3 associated with low placental efficiency. In Latin America, there are no comparable studies on the risk of nutritional phenotypes in newborns associated with placental anthropometry.
The BW/PW ratio is highly reproducible, but the most appropriate way to use it is not yet completely clear, and further studies are needed to improve the understanding of the compensatory mechanisms developed by the placenta and its growth in relation to fetal growth in usual and adverse situations and broaden the understanding of the most appropriate assessment techniques and how to implement them in clinical practice.
In conclusion, low placental efficiency was associated with increased risk for small-for-gestational-age, stunted, and wasted. The evaluation of placental morphometry can provide valuable information on intrauterine conditions and neonatal health, helping to identify newborn phenotypes at higher risk of future comorbidities, in addition to being a simple and low-cost tool.
Funding sourceFundacão de Amparo à Pesquisa do Estado de São Paulo (FAPESP): Process No. 08/53593–0.
Institution with which the work is associated: Department of Pediatrics, Ribeirão Preto Medical School, University of São Paulo, Brazil


