


a) To verify the applicability of anthropometric indicators to evaluate physical fitness in school children and b) Propose physical fitness reference values for Peruvian children living at high altitudes in Peru.
MethodsA cross-sectional study was carried out in children aged 6 to 12 years living at high altitude in Peru. A total of 1372 primary school children (785 males and 587 females) were evaluated. Weight, height and four physical tests [Hand grip strength (right and left HGS)], Horizontal jump (HJ), Round trip (5 × 10 repetitions), and the 6-minute walk test (6MWT)] were evaluated. Body Surface Area (BSA), Body Mass Index (BMI), and Triponderal Index (TPI) were calculated.
ResultsThe BSA presented a better comparative structure in relation to BMI and TPI with all physical tests. In males, HGS was related between r = 0.64 and 0.66; HJ (r = 0.26), agility (r = -0.31) and 6MWT (r = 0.30). In females, HGS was related between r = 0.63 and 0.64; HJ (r = 0.36), agility (r = -0.36), and 6MWT (r = 0.21). The predictive power in the four physical tests ranged from R2 = 9% to 43% in males, and from 5% to 41% in females. Percentiles by age and sex were proposed for BSA, HGS (right and left), HJ, agility, and 6MWT.
ConclusionBSA is the best predictor of physical fitness in schoolchildren from high altitude areas in Peru, surpassing BMI and TPI. In addition, reference values were proposed to evaluate physical fitness in these children.
Physical fitness assessment has become an elementary indicator of the health status of children and adolescents [1]. It is often assessed by several tests or test batteries that measure different aspects of fitness or components [2]. They are generally represented by five components: morphological, muscular, motor, cardiorespiratory and metabolic [3].
The assessment and monitoring of physical fitness at the school level is relevant. It serves not only to establish physical performance categories, but also to set health goals, plan lasting healthy behaviors, and boost physical education teaching among schoolchildren [4].
Indeed, in the school system, it is important for schools to implement batteries of health-related fitness tests. Especially that they are age-appropriate and reflect as well as possible the relationship between physical fitness and health [5].
In this sense, it is widely known that the use of anthropometric indicators (morphological components) is relevant in the school population. Since it allows the monitoring of somatic growth and development [6] and serves as a useful tool for risk identification, intervention, or impact assessment on nutritional status or health in general [7].
These anthropometric indicators [e.g. body mass index (BMI), triponderal index (TPI), waist height index (WHI), waist circumference (WC), among others), have been used by several studies as predictors of various physical tests in children and adolescents [8,9]. However, the relationships of these variables were weak, suggesting that they might not be the most appropriate and accurate predictors of physical performance in schoolchildren.
These indicators often do not fully capture variability in body size and proportion, factors that can influence capacity and efficiency in physical performance. In addition, other previous studies have shown that children and adolescents living in regions of moderate and/or high altitude have evidenced shorter stature compared to international standards [10,11]. This fact suggests a possible effect of the hypoxic environment on linear growth, since it has been postulated that altitude influences physical growth parameters in residents of high-altitude areas due to continuous exposure to hypoxia [12]. As a consequence, when relating weight to height, these children tend to have higher BMI and TPI values.
This could lead to an overestimation of excess weight when using this indicator in high-altitude populations. Therefore, this phenomenon, together with the weak relationships observed between anthropometric indicators and physical performance tests in previous studies, highlights the need to consider other anthropometric parameters, such as body surface area (BSA). This indicator could correct or improve such relationships. Since it provides a more accurate estimate of total body size, which varies significantly during growth and development throughout age (e.g., increases from 0.2 m² at birth to approximately 1.73 m² in adulthood) [13].
Therefore, the objectives of the study are: a) to verify the applicability of anthropometric indicators for assessing physical fitness in schoolchildren, and b) to propose physical fitness reference values for Peruvian children living at high altitude in Peru.
Materials and methodsType of study and sampleA descriptive cross-sectional study was carried out in 1372 primary school children (785 males and 587 females). The age range was 6 to 12 years. The sample selection was non-probabilistic (convenience). Data were collected in 4 primary schools in the urban area of the city of Puno. This city is located at 3820 m above sea level and is geographically located in the southeast of the country (Peru) and is bordered to the east by the department of La Paz (Bolivia).
The study included children of both sexes who attended physical education classes and were enrolled at the primary level and aged 6 to 12 years. Children who did not complete the evaluation of anthropometric measurements and physical tests were excluded. As well as those with physical and/or sports injuries (Figure 1).

The study was performed according to the approval of the ethics committee of the National University of the Altiplano of Puno (CEIC 007–2022) and according to the ethical principles of the Declaration of Helsinki for human beings.
Techniques and proceduresThe four schools were invited to participate voluntarily in the study, and once participation was accepted, informed consents were sent. Data collection took place from April to June 2023.
A team of six evaluators with ample experience in anthropometric and physical evaluations was formed and went to the schools to collect the data. In anthropometry, weight and height were evaluated, and in physical fitness, four physical tests were evaluated: Hand grip strength (HGS), right and left, Horizontal jump (HJ), Agility (5 × 10 repetitions), and the 6-minute walk test (6MWT).
Anthropometric variablesWeight and height were evaluated with the least amount of clothing possible (barefoot, shorts, and T-shirt) according to the suggestions described by Ross and Marfell-Jones [14]. For weight (kg), a Tanita digital scale (United Kingdom, Ltd.) with an accuracy of 0.1 kg and a range of 0.1 kg to 150 kg was used. For height, a portable stadiometer (Hamburg, Seca, Ltd.) with an accuracy of 0.1 mm and a measurement range of 0.0 cm to 220.0 cm was used. With both measurements (Weight and Height) BMI: [BMI = weight (kg)/height (m)2], TPI: [TPI = weight (kg)/height (m)3], and BSA: BSA = 0.024265 × weight (kg)0.5378 × height (cm)0.3964 were calculated. The BSA was determined by the equation proposed by Haycock et al [15].
Physical fitnessHand grip strength (HGS): The HGS of both hands (right and left) was evaluated. It was evaluated according to the suggestions described by Richards et al [16]. The evaluee sits on a straight-backed chair. Then one of the evaluators constantly adjusted the dynamometer to the grip size of the equipment according to age and sex. A JAMAR hydraulic dynamometer (Hydraulic Hand Dynamometer ® Model PC-5030 J1, Fred Sammons, Inc., Burr Ridge, IL: USA) was used for the measurement. This equipment has an accuracy of 0.1 kg and a scale of up to 100 kg/f.
Horizontal jump HJ (m): The evaluated is located behind a previously drawn line. It was evaluated according to the suggestions described by Castro-Piñero et al [17]. The subject must perform preparatory movements of arms and knees to execute the jump. Once the jump is performed, the distance at the end of the heel is recorded. A metallic tape measure was used to record the distance from 0 to 3 m.
Round trip run (5 m × 10 repetitions) (seconds): It was evaluated using the suggestions described by Verschuren et al [18]. The person evaluated should go in a back-and-forth direction, covering a distance of 5 m until completing a total of 50 m At the end, 10 repetitions were performed. A Casio digital stopwatch with an accuracy of 0.01 s was used to measure the time.
6-minute walk (6MWT): This was performed according to the recommendations of the American Thoracic Society [19]. It was performed in an open space on a flat surface (30 m long × 10 m wide). This area was demarcated with white adhesive tape to distinguish the lanes. The evaluators instructed the schoolchildren to walk as fast as they could in one direction, back and forth as fast as they could (without stopping). At the end of the 6 min, the distance achieved by each child was recorded.
The reliability of the physical tests was controlled through the test-retest technique. It was applied to 10 % of the sample (n = 142). The values of the relative technical error of measurement (TEM %) ranged from 1.0 to 1.6 %.
StatisticsThe Kolmogorov-Smirnov test was used for the normal distribution of data. Next, the data analyzed descriptively were: (mean, standard deviation, and range). To examine the relationships between anthropometric indicators and physical fitness, Pearson's correlation coefficients (r) were calculated to evaluate the linear associations between BMI, TPI, BSA, and the four physical tests.
In addition, a linear regression analysis was performed to determine the predictive power of anthropometric indicators on physical fitness. The coefficient of determination (r²) was calculated to quantify the proportion of variance in fitness test performance explained by the anthropometric indicators. The significance considered in all cases was p < 0.05. Statistical analyses were performed in Excel spreadsheets and SPSS 18.0.
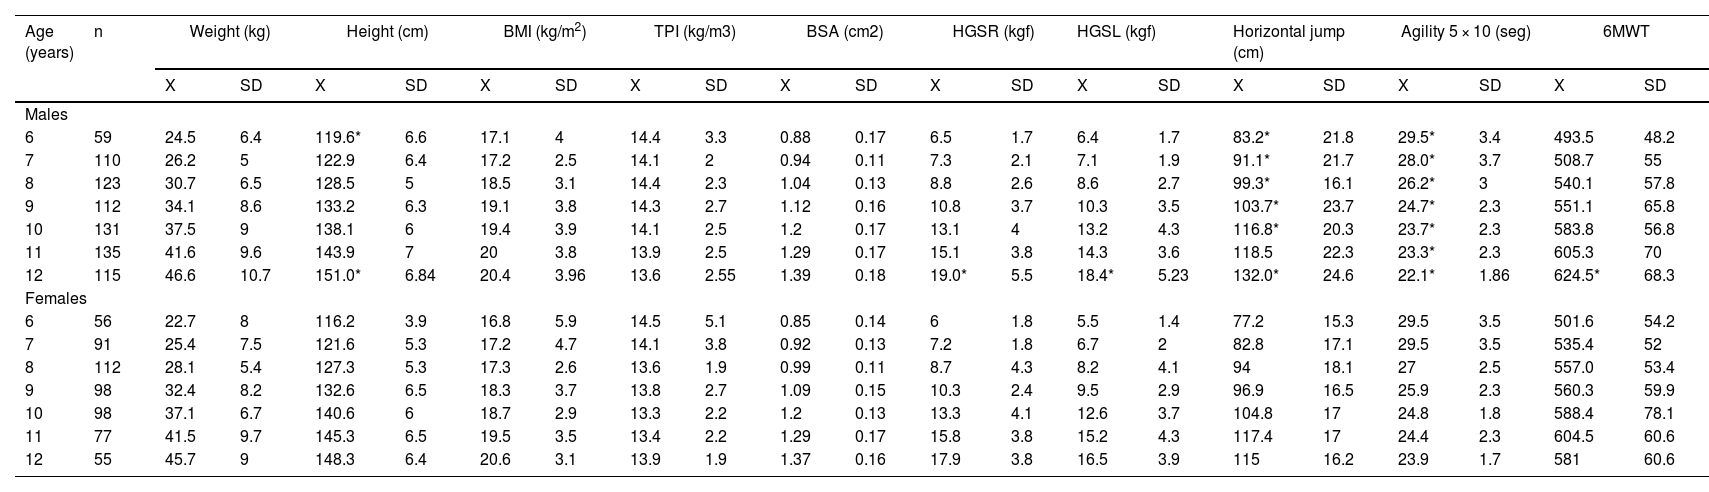
ResultsTable 1 shows the anthropometric variables and physical tests characterizing the sample studied. In body weight, there were no differences between both sexes (p > 0.05) from 6 to 12 years of age. In height, males showed greater height at 6 and 12 years of age in relation to females (p < 0.05). In the other ages, there were no significant differences. In the anthropometric indicators (BMI, TPI and BSA), there were no significant differences between both sexes and at all ages (6 to 12 years) (p > 0.05). In the HGS of both hands and the 6MWT test, there were only significant differences at 12 years of age between both sexes (p < 0.05). In the other ages, from 6 to 11 years of age, there were no significant differences. In the HJ, males presented better results at all ages (p < 0.05), except at 11 years of age, where there were no significant differences (p > 0.05). In the agility test, males showed better results in relation to their female counterparts at all ages (p < 0.05).
Anthropometric and physical characteristics of the schoolchildren studied.
HGSR, Right hand grip strength; HGSL, Left hand grip strength; HJ, Horizontal jump; 6MWT, 6-minute walk test; SEE, Standard error of estimation; BMI, Body mass index; TPI, Triponderal index; BSA, Body surface area; X, Mean; SD, Standard deviation.
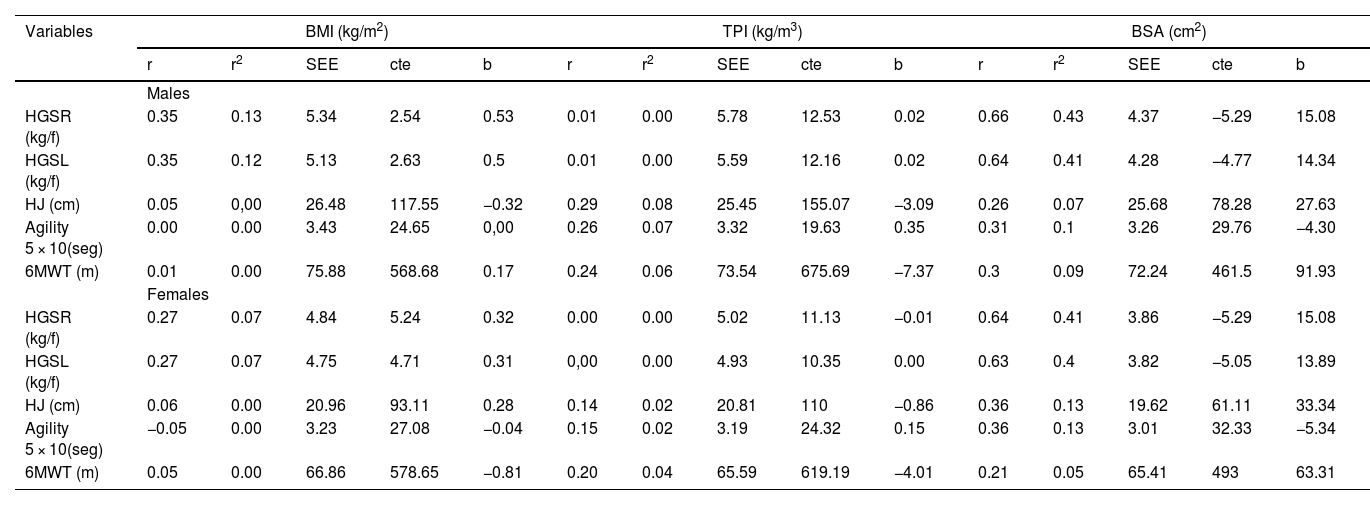
Table 2 shows the correlation coefficients, determination, SEE, and regression parameters (intercept and slope) between anthropometric indicators (BMI, TPI and BSA) with four physical tests in both sexes. BMI correlated with HGS (right and left), showing values of r = 0.35 in males and r = 0.27 in females. Meanwhile, with the HJ, Round trip run (5 m × 10 repetitions) and 6MWT tests, the relationships in both sexes were null (r < 0.06). In the case of TPI, paradoxically, there was no relationship with HGS (right and left) in both sexes (r < 0.01). However, the relationships improved with the rest of the physical tests in both sexes. In males, the HJ was r = 0.29, agility r = −0.26 and 6MWT r = 0.24 and in females, the HJ was r = 0.14, agility r = −0.15, and 6MWT r = 0.20. The relationships between the BSA and the four physical tests in both sexes improved ostensibly. In males, HGS with both hands ranged from r = 0.64 to 0.66, with HJ r = 0.26, agility r = −0.31, and with 6MWT r = 0.30. In females, HGS with both hands is related from r = 0.64 to 0.63, with HJ r = 0.36, agility r = −0.36, and with 6MWT r = 0.21. Figure 2 shows the explanatory power (R2) between BSA and physical tests in both sexes. In males, the values ranged from 9 to 43 %, and in females, from 5 to 41 %.
Correlations and regression between anthropometric indicators (BMI, TPI, BSA) with physical fitness tests by sex.
HGSR, Right hand grip strength; HGSL, Left hand grip strength; HJ, Horizontal jump; 6MWT, 6-minute walk test; SEE, Standard error of estimation; BMI, Body mass index; TPI, Triponderal index; BSA, Body surface area.

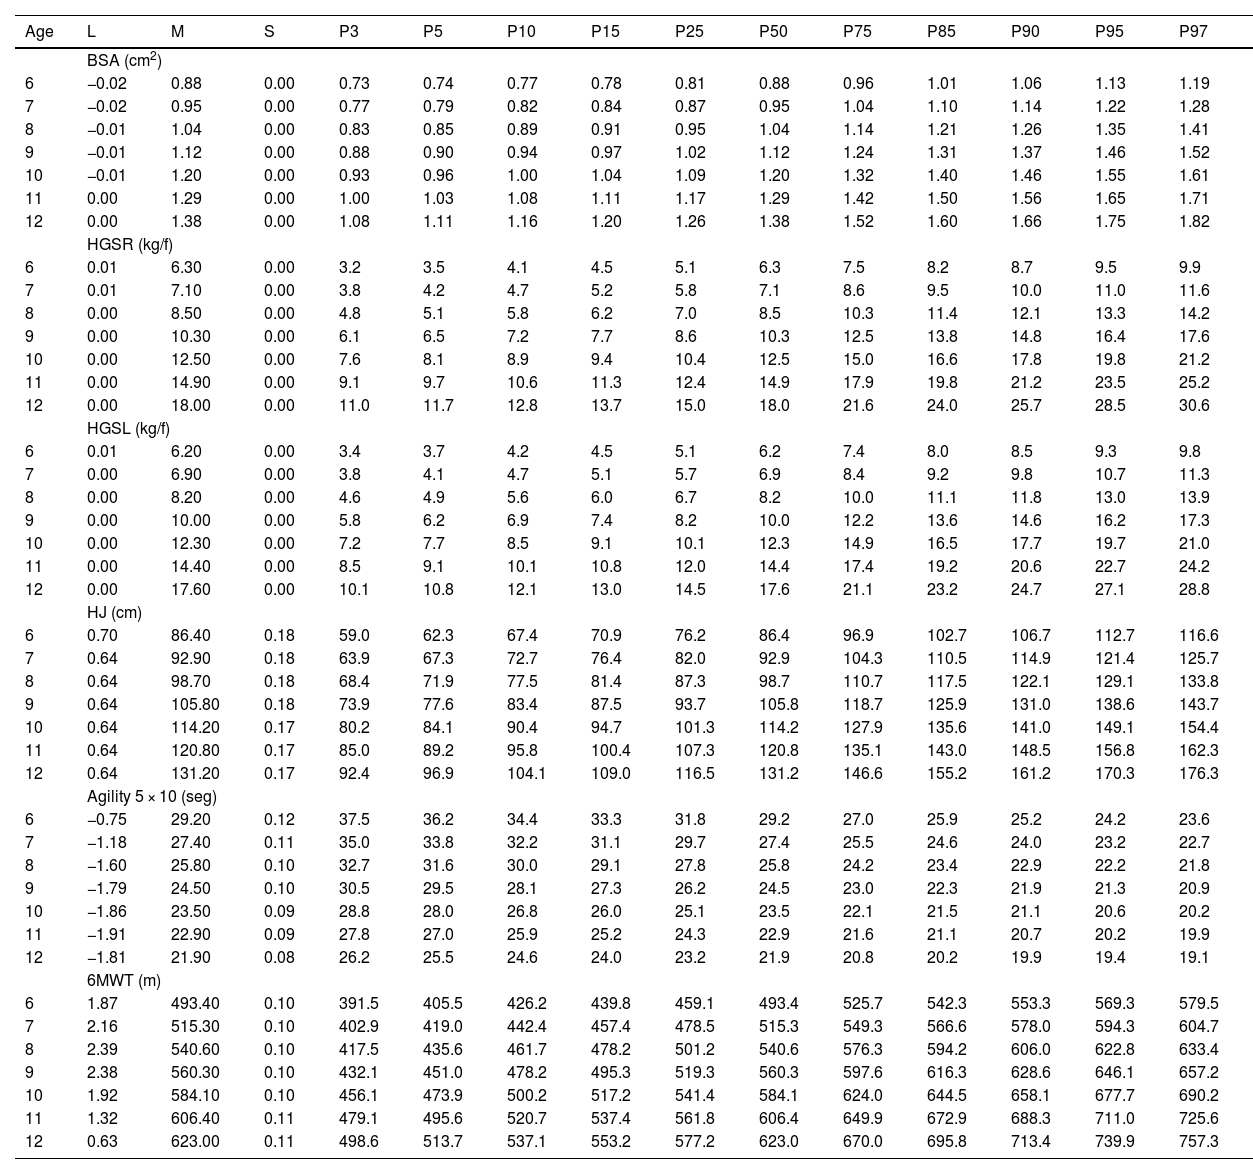
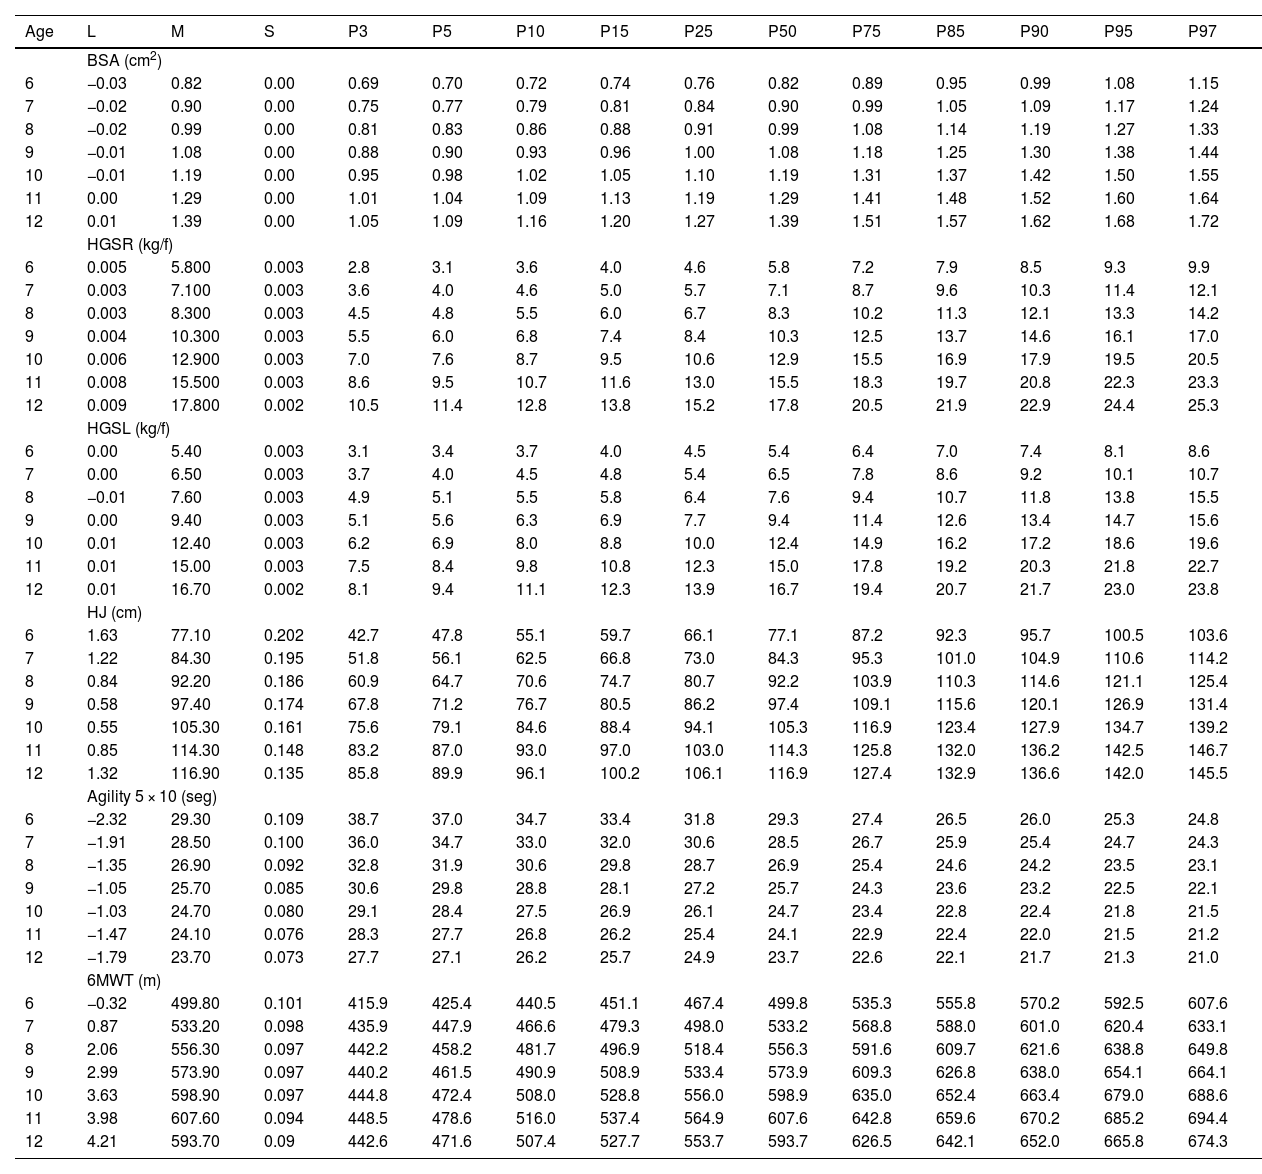
Tables 3 and 4 show the percentile distribution of body size (BSA) and four physical tests by age and in both sexes. A progressive improvement in BSA is observed as chronological age increases. It can also be seen that as age increases, the values of the physical tests improve the performance in HGS and HJ, decrease the time in the round-trip running test (5 m x 10 repetitions), and increase the number of meters in the 6MWT.
Percentile distribution of body size (BSA), HGS, HJ, agility and 6MWT of children 6 to 12 years of age from high altitude in Peru.
P, Percentile, L (Lambda, Box-Cox transformation), M (Mu) median of the distribution and S (Sigma) coefficient of variation.
Percentile distribution of body size (BSA). HGS. HJ. agility and 6MWT of girls aged 6 to 12 years from high altitude in Peru.
P, Percentile, L (Lambda, Box-Cox transformation), M (Mu) median of the distribution and S (Sigma) coefficient of variation.
The initial objective of the study was to verify the applicability of anthropometric indicators (BMI, TPI, and BSA) to predict physical fitness in schoolchildren living in a high-altitude region of Peru. The results of the study have shown that BSA is the best overall predictor of physical fitness relative to BMI and TPI. These findings highlight the importance of BSA as a key indicator of physical performance in schoolchildren. It outperformed BMI and TPI in its predictive ability in the HGS (right and left), HJ, agility, and 6MWT tests.
These findings suggest that the BSA should be considered as a relevant criterion in the assessment and classification of physical fitness in this population of schoolchildren aged 6 to 12 years living at high altitude.
The BSA provides a more accurate representation of body composition, as it considers both height and weight with allometric correction. Weight is approximately proportional to a subject's height. Therefore, the product of weight (a) × height (b) can be manipulated by an appropriate constant to obtain a stable value that approximates weight.
This allows a more comprehensive assessment of metabolic mass than body weight, as it is less affected by abnormal adipose mass. Unlike BMI and TPI, which can be affected by fat and muscle distribution, BSA is more closely associated with muscle mass and metabolism, which is crucial for physical performance.
In fact, some recent studies have reported that BSA is an excellent predictor of fat-free mass in young people and adults [20,21]. Therefore, its use and application in children living at high altitude in Peru becomes fundamental in the evaluation of the morphological component. Therefore, incorporating the BSA together with physical tests can provide valuable information for designing training programs and monitoring progress in schoolchildren aged 6 to 12 years.
Overall, BSA can provide a more complete and useful insight into understanding how children living at high altitude can optimize their physical capacity according to body size. This information is crucial for pediatric populations living in high-altitude geographic regions, where BMI is often used as an indicator of nutritional status. Although previous studies have suggested great limitations due to the low stature in relation to international references [9,10].
The second objective of the study was to propose reference values to assess physical fitness in children living at high altitude in Peru. For this purpose, the LMS method was used to represent the distribution of percentiles of body size (BSA), HGS (right and left), HJ, agility, and 6MWT.
In general, normative data from field fitness tests offer the opportunity to analyze and study health promotion and sports skills development at the school level [22]. In the specific case of Peru, the Ministry of Education does not specify the use and/or application of a battery to assess the physical fitness of schoolchildren. But it does, in its guidelines, state a clear and structured progression of achievement objectives covering all levels of schooling, highlighting the balanced development of the body and health [23].
From that perspective, the percentiles proposed here for body size and four physical tests were designed for primary school children in a high-altitude region of Peru. These reference values were developed by age and sex and can be used for diagnostic purposes and evaluation of the physical fitness level of children aged 6 to 12 years.
To categorize performance levels, it is necessary to rely on some cut-off points. For this purpose, in this research, the authors use suggestions described by some recent studies [24,25]. These investigations have reported, for example, that children below the 15th percentile (< p15) are characterized by warning signs of low level of performance. While those between p15 to p85 are considered adequate, and above > p85 are considered a high fitness level.
The use of fitness reference values in the school system can generate individual and/or collective advantages [26]. Since schoolchildren below p15 are identified, physical education professionals can implement strategies and intervention programs to improve physical fitness. On the other hand, higher levels of physical fitness allow participation in a variety of physical activities and consequently decrease the risk of health problems [27,28].
Therefore, to successfully monitor fitness levels over time, it is essential to have up-to-date normative data [29]. In this sense, the reference values proposed in this study are a valuable tool for the school population living at high altitudes. This tool can be useful for health professionals, as well as for parents and physical education teachers. In addition, some studies have characterized fitness percentiles as a simple, safe, and low-cost tool to examine various health indicators [30].
In sum, monitoring and measuring the progression of physical fitness in schoolchildren in various geographic regions is extremely relevant. Especially in these times where fitness levels have been gradually deteriorating [2]. Therefore, it is essential to systematically and frequently monitor these indicators using BSA as a physiological estimator of body size (related to energy expenditure and exchange surface area). This would allow discrepancies between size and functional capacity that BMI and TPI do not detect to be identified. Likewise, when applied to clinical practice and the school environment, the use of BSA could facilitate allometric adjustment in physical tests, allowing for a more accurate interpretation of children's physical performance by taking into account actual body size and not just weight and height, respectively.
The present study has certain limitations, as, for example, in relation to the age range, it was not possible to evaluate the physical fitness of secondary school children (13 to 17 years). Therefore, future studies should fill this gap. On the other hand, the selection of the sample used in the study was non-probabilistic, and the design used was cross-sectional. This limits the generalization of the results, and due to the type of study, it is not possible to establish causal relationships. In addition, a standard method for analyzing body composition is necessary, since both BSA, BMI, and TPI are estimated using formulas. This may generate some variations in the results of this study. Therefore, future studies should consider these aspects to strengthen their methodological designs.
The study presents some strengths that should be recognized, since it is one of the first studies that proposes to consider BSA as part of the morphological component. In addition, the proposed percentiles evidence updated data, which allows monitoring fitness levels in high altitude primary school children. These results can serve as a baseline for future comparisons and possible secular trend analysis.
ConclusionBSA was shown to be the best predictor of physical fitness in schoolchildren living in high-altitude areas in Peru, far surpassing BMI and TPI. This finding highlights the physiological value of BSA as an indicator of body size and efficiency, providing novel information in a little-explored context. Reference values applicable in clinical and school settings were also proposed, allowing for more accurate assessment of physical fitness according to age and sex.
Authors’ contributionsConceived and designed the experiments: Marco Cossio-Bolaños, Rossana Gómez Campos.
Performed the experiments: Jose Fuentes-Lopez, Dony Mamani Velasquez, Eliseny Vargas Ramos, Estanislao Pacompia Cari.
Analyzed the data: Marco Cossio-Bolaños, Rossana Gómez Campos, Rubén Vidal Espinoza, Wilbert Cossio Bolaños.
Contributed reagents/materials/analysis tools: Jose Fuentes-Lopez, Eliseny Vargas Ramos.
Wrote the paper: Marco Cossio-Bolaños, Rossana Gómez Campos, Rubén Vidal Espinoza, Danilo R. Silva.
FundingThis research did not receive any specific grant from funding agencies in the public, commercial, or not-for-profit sectors.
Data availabilityThe data supporting the findings of this study are openly available in the Figshare repository, at http://dx.doi.org/10.6084/m9.figshare.30862223.
The authors declare no conflicts of interest.


