


To investigate the factors influencing hyperuricemia in children and adolescents and to provide a scientific basis for early prevention and treatment.
MethodsA retrospective study (2017–2021) of the prevalence of hyperuricemia in children and adolescents was conducted, and the factors influencing hyperuricemia were analyzed by multi-factor logistic regression.
ResultsThe overall prevalence of hyperuricemia in children and adolescents aged 6–17 years in northeast Sichuan Province was 55.12% (8676/15,739), of which 60.68% (5699/9392) in boys and 46.90% (2977/6347) in girls; the prevalence of hyperuricemia from 2017 to 2021 was 52.40% ( 1540/2939), 52.56% (1642/3124), 52.11% (1825/3502), 58.33% (1691/2899), and 60.40% (1978/3275), respectively; the prevalence rates of 6–12 years old were 48.92% (864/1766), 50.46% (769/1524), and 52.73% (685/1299), 56.99% (693/1216), 35.46% (444/1252), 46.33% (524/1131), 60.50% (720/1190), and 66.82% (739/1106), 58.95% (652/1106), and 62.17% (761/1106) for 13–17 years old, respectively, 62.17% (761/1224), 63.19% (855/1353), and 61.70% (970/1572), respectively. Logistic regression showed that the prevalence of male (OR = 1.451, 95% CI 1.034 to 2.035, p = 0.031), age (OR = 1.074, 95% CI 1.024 to 1.126, p = 0.003), overweight/obesity (OR = 1.733, 95% CI 1.204∼2.494, p = 0.003), blood creatinine (OR = 1.018, 95% CI 1.005∼1.031, p = 0.007), triglycerides (OR = 1.450, 95% CI 1.065∼1.972, p = 0.018), blood calcium (OR = 6.792, 95% CI 1.373∼33.594, p = 0.019), and systolic blood pressure (OR = 1.037, 95% CI 1.018∼1.057, p < 0.001) were influential factors for the development of hyperuricemia.
ConclusionThe prevalence of hyperuricemia was higher in children and adolescents aged 6–17 years in northeastern Sichuan Province, with a higher prevalence in boys than in girls, and the prevalence increased with age.
Hyperuricemia is a metabolic disease with impaired purine metabolism, the prevalence of which continues to increase and is becoming younger, younger, and more prevalent. Hyperuricemia directly causes gout and kidney damage and is associated with an increased risk of hypertension, diabetes, dyslipidemia, and adverse cardiovascular outcomes, placing a heavy burden on society and the health care system.1–4 It is a heavy burden on society and the health care system. A meta-analysis showed that the prevalence of hyperuricemia in the general population of mainland China was 17.4%.5 However, the prevalence and characteristics of hyperuricemia in children and adolescents in China have varied in different studies, and there is a gap in the study of hyperuricemia in children and adolescents in northeastern Sichuan Province. Therefore, the aim of this study was to collect data on children and adolescents aged 6–17 years using the big data platform of the regional medical center of northeast Sichuan province to investigate the prevalence of hyperuricemia and related factors in children and adolescents in northeast Sichuan province from 2017 to 2021 and to provide a scientific basis for the prevention and treatment of hyperuricemia in children and adolescents.
ObjectPhysical examinationThe data of 15,986 children and adolescents aged 6 to 17 years who attended the hospital affiliated with Chuanbei Medical College from January 1, 2017, to December 31, 2021, were retrospectively collected. A multistage whole-group random sampling method was applied to select patients who attended the hospital in January, March, June, September, and December of each year, excluding those with incomplete clinical data, and 15,739 cases were finally included in the study. The subjects were finally included. Inclusion criteria: (1) the age range was 6–17 years old, and the gender was not limited; (2) the data were complete. Exclusion criteria: (1) patients with malignant tumors, severe trauma, and severe cardiopulmonary dysfunction; (2) patients taking drugs that affect uric acid levels within six months.
MethodPhysical examinationA standard electronic height and weight meter was used to measure the height and weight of the study subjects and calculate the body mass index (BMI), BMI = body mass (kg)/height (m2 ). The systolic blood pressure (SBP) and diastolic blood pressure (DBP) in the right upper arm were measured three times continuously at an interval of 1 min each time using a calibrated Yuyue YE660D electronic sphygmomanometer and a suitable cuff, and the average of the last two times was taken for analysis.
Laboratory tests fastingVenous blood was collected, and blood leukocytes, erythrocytes, hemoglobin, albumin, pre-albumin, blood creatinine, urea nitrogen, blood uric acid, glomerular filtration rate, homocysteine, cystatin C, total cholesterol, triglycerides, high-density lipoprotein, low-density lipoprotein, apolipoprotein A, blood potassium, blood calcium, blood phosphorus, blood magnesium, and fasting blood glucose were measured using a German SIEMENS automatic biochemical analyzer, blood magnesium, fasting blood glucose.
Definition(1) Diagnosis of hyperuricemia: classification by age and gender, with the following values referenced for boys and girls respectively: < 10 years old or prepubertal: > 268 umol/L and > 286 umol/L; 10–13 years old: > 339 umol/L and > 309 umol/L; 14–17 years old: > 381 umol/L and > 315 umol/L (1 mg/dl = 59.5umol/L)6 (2) overweight and obesity diagnosis: refer to the "Chinese school-age children and adolescents overweight, obesity screening body mass index value classification standards" proposed by the China Obesity Working Group in 2003 based on the definition: BMI < P85 is normal, BMI ≥ P85 is overweight, BMI ≥ P95 is obese.7
Statistical analysisSPSS 26.0 software was used for statistical analysis, and the count and measurement data were statistically described using n (%) and (¯x ± s), respectively, and χ2 and t-tests were applied for comparison between groups. Non-normal distributions were expressed as M (P25 to P75), log-transformed for skewed data, and t-tests were used for comparisons between groups. A logistic regression model was used for multi-factor analysis to determine the risk factors associated with hyperuricemia, with a test level of α = 0.05 and a statistically significant difference of p < 0.05.
Ethical approvalThis study was approved by the Ethics Committee of the Affiliated Hospital of Chuanbei Medical College (ethical approval number: 2022ER576–1).
ResultsGeneral information of study subjectsA total of 15,739 study subjects were included in this study, 9392 males and 6347 females; average age (11.33 ± 3.65) years; average uric acid level (358.84 ± 112.61) μmol/L, 8676 cases with hyperuricemia, 7063 cases without hyperuricemia, the overall prevalence of hyperuricemia was 55.12% (8676/15,739), of which 60.68% (5699/9392) were male and 46.90% (2977/6347) were female.
Prevalence of hyperuricemia and uric acid levels in different yearsThe prevalence of hyperuricemia from 2017 to 2021 was 52.40% (1540/2939), 52.56% (1642/3124), 52.11% (1825/3502), 58.33% (1691/2899), 60.40% (1978/3275), the prevalence of hyperuricemia showed an increasing trend year by year (Figure 1), and the uric acid levels from 2017 to 2021 were 335.44 ± 112.46, 337.17 ± 108.15, 332.27 ± 110.42, 344.90 ± 108.68, 345.53 ± 108.95, respectively, and the uric acid levels showed a gradual increase in recent years.
Prevalence of hyperuricemia and uric acid levels by age.")
The prevalence of hyperuricemia in children and adolescents aged 6 to 12 years was 48.92% (864/1766), 50.46% (769/1524), 52.73% (685/1299), 56.99% (693/1216), 35.46% (444/1252), and 46.33% (524/1131), 60.50% (720/1190), 66.82% (739/1106), 58.95% (652/1106), 62.17% (761/1224), 63.19% (855/1353), 61.70% of children and adolescents aged 13 to 17 years with hyperuricemia prevalence, respectively (970/1572), the prevalence of hyperuricemia showed an increasing trend with age, with 13 years as the cut-off point, the prevalence of hyperuricemia increased significantly in boys at the age of 13 years and later, but the prevalence of hyperuricemia in girls did not show a significant increase (Figure 2). uric acid levels in children and adolescents aged 6–17 years were 282.24 ± 80.21, 284.98 ± 79.26, 288.74 ± 81.76, 294.56 ± 80.33, 307.29 ± 87.78, 330.87 ± 97.07, 357.83 ± 105.09, 378.41 ± 110.56, 387.07 ± 116.02, 388.64 ± 111.29, 398.38 ± 116.15, and 395.78 ± 119.89; the uric acid level showed an increasing trend with age.
Prevalence of hyperuricemia in different systems.")
The prevalence of hyperuricemia in different systems was 72.23% (3392/4696) for digestive system diseases, 59.06% (1671/2829) for respiratory system diseases, and 51.60% (1638/3174) for urological system diseases, according to the classification of the main diagnoses in children and adolescents by system. Immune system diseases 51.29% (889/1733), neurological system diseases 48.33% (275/569), hematological system diseases 41.08% (401/976), endocrine system diseases 27.53% (87/316), circulatory system diseases 25.07% (159/634), and others 20.19% (164/812).
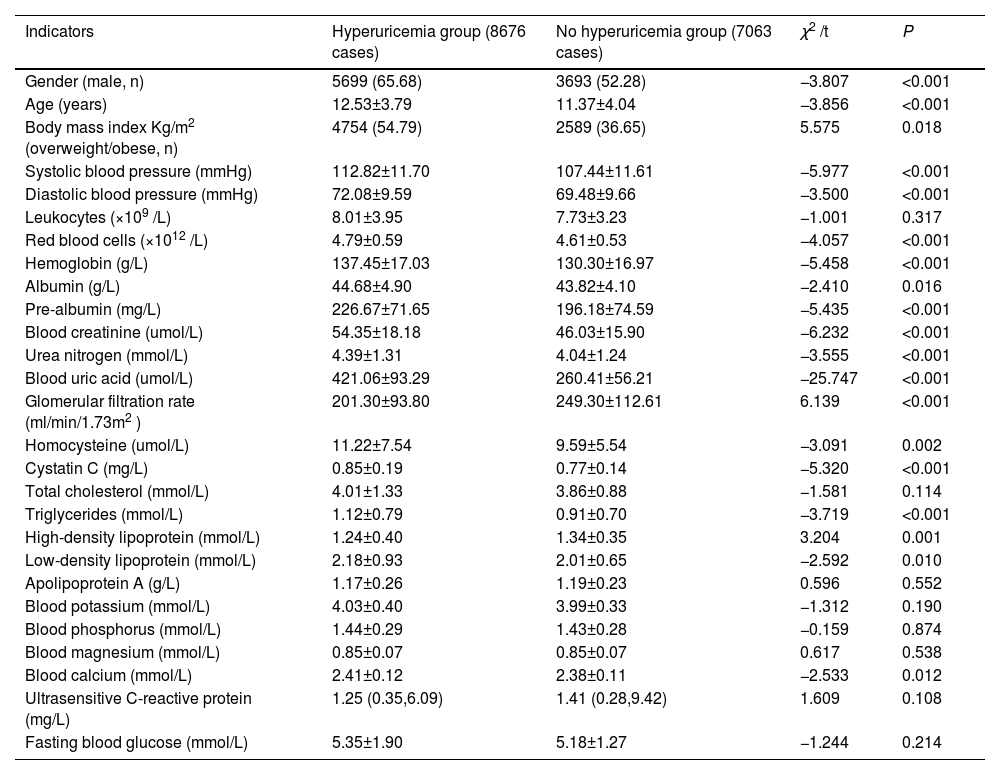
Clinical characteristics of the two groups comparedIn the group without hyperuricemia, the proportion of males and overweight/obese was higher in the children and adolescents in the hyperuricemia group. Age, systolic blood pressure, diastolic blood pressure, erythrocytes, hemoglobin, albumin, pre-albumin, blood creatinine, urea nitrogen, blood uric acid, homocysteine, cystatin C, glomerular filtration rate, triglycerides, high-density lipoprotein, low-density The differences were statistically significant (p < 0.05) when comparing leukocytes, total cholesterol, apolipoprotein A, blood potassium, blood phosphorus, blood magnesium, ultrasensitive C-reactive protein, and fasting glucose (p > 0.05) (Table 1).
Clinical characteristics of the two populations [n = 15,739, n (%)].
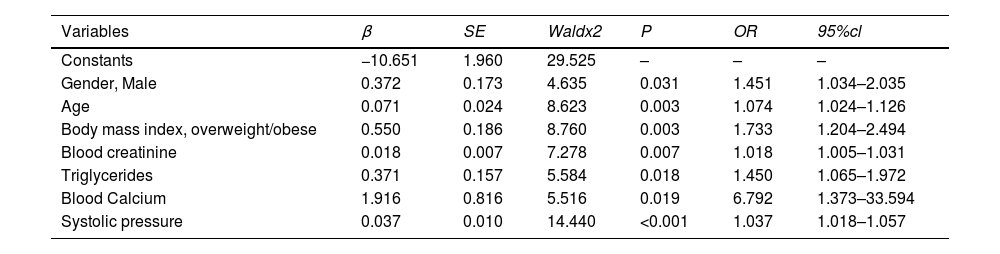
Factors with statistically significant differences (p < 0.05) between groups (gender, age, body mass index, systolic blood pressure, diastolic blood pressure, red blood cells, hemoglobin, albumin, pre-albumin, blood creatinine, urea nitrogen, blood uric acid, homocysteine, cystatin C, triglycerides, high-density lipoprotein, low-density lipoprotein, and blood calcium) were used as independent variables, and whether occurrence of hyperuricemia was the dependent variable (yes = 1, no = 0), and multi-factor logistic regression analysis was used to show that men (OR = 1.451, 95% CI 1.034–2.035, p = 0.031), age (OR = 1.074, 95% CI 1.024–1.126, p = 0.003), overweight/obesity (OR = 1.733, 95% CI 1.204∼2.494, p = 0.003), blood creatinine (OR = 1.018, 95% CI 1.005∼1.031, p = 0.007), triglycerides (OR = 1.450, 95% CI 1.065∼1.972, p = 0.018), blood calcium (OR = 6.792, 95% CI 1.373∼ 33.594, p = 0.019), and systolic blood pressure (OR = 1.037, 95% CI 1.018 ∼ 1.057, p < 0.001) were independent risk factors for the development of hyperuricemia (Table 2).
Multifactorial logistic regression analysis of the occurrence of hyperuricemia (n = 15,739).
In recent years, the prevalence of hyperuricemia has increased significantly worldwide, and previous studies have shown that the prevalence of hyperuricemia in children and adolescents varies significantly across countries depending on geographic and economic, and cultural levels8 found the prevalence of hyperuricemia in adolescents aged 12–19 years to be 16.56% (276/1933), and a study in South Korea using data from the 7th National Health and Nutrition Cross-Sectional Survey (2016–2017) showed9 the prevalence of hyperuricemia among children aged 10–18 years was 9.4% (115/1256). A cross-sectional study in China based on the prevalence of hyperuricemia in 54,580 children and adolescents aged 3–19 years estimated the prevalence of hyperuricemia at 23.3%.10 The prevalence of hyperuricemia is gradually increasing due to the long-term intake of high oil, high fat, high salt, and high sugar diets by children and adolescents in Sichuan, where the food culture is characterized by more, wider, thicker, and more concentrated flavors.11,12 The results of this study showed that the number of children and adolescents aged 6–17 years with hyperuricemia in northeast Sichuan province increased year by year from 2017 to 2021, and the prevalence of hyperuricemia was 55.12%, which was much higher than the above cross-sectional study results in China and the prevalence of hyperuricemia in most regions at home and abroad, suggesting that hyperuricemia in children and adolescents in northeast Sichuan province has become more prominent This suggests that hyperuricemia in children and adolescents in northeastern Sichuan Province has become a prominent health problem and should be given high priority by society and relevant authorities.
Previous domestic and international studies.2,13-15 The results of this study showed that the prevalence of hyperuricemia in children and adolescents aged 6 to 17 years old was determined at the age of 13 years, and the growth rate of the prevalence of hyperuricemia became faster in each age group at the age of 13 years old and later, and the prevalence of hyperuricemia in boys was much higher than that in girls. On the other hand, it may be related to the inhibition of uric acid excretion by testosterone and the stimulation of increased muscle mass, which may lead to increased consumption of adenosine triphosphate as muscle mass increases during puberty, and increased metabolism of adenosine triphosphate induces the release of purines from muscle, leading to increased UA levels.16
The results of this study revealed that the detection rate of overweight/obesity and triglyceride levels were higher in the hyperuricemia group than in the group without hyperuricemia, and the results of multifactorial logistic regression analysis showed that body mass index and triglyceride were risk factors for the development of hyperuricemia in children and adolescents aged 6–17 years in this region, and the risk of hyperuricemia in children and adolescents with body mass index (overweight/obesity) and high triglyceride levels were 1.080 times and 1.546 times of normal children and adolescents, respectively. This is consistent with the results of domestic and international.14,17 The mechanism may be that excessive accumulation of obese adipose tissue leads to dysregulation of adipocytokines and release of inflammatory cytokines, which increases uric acid production; on the other hand, it may be related to adipogenesis and/or lipolysis, where excess fatty acids in adipocyte synthesis lead to accumulation of triglycerides and increased purine synthesis, resulting in elevated serum uric acid levels; there is also evidence that obesity is associated with There is also evidence that obesity is associated with upregulation of lipolysis in adipose tissue and that lipolysis may also increase uric acid production in obese adipose tissue; it has also been shown that long-term excessive intake of fructose-rich beverages can cause insulin resistance in children and adolescents, increase insulin levels in the blood, stimulate uric acid absorption in the kidneys, thereby increasing serum uric acid levels and increasing the accumulation of visceral fat.18–21 This increases serum uric acid levels and increases visceral fat accumulation.
Data from previous studies on the relationship between the prevalence of hyperuricemia and the kidney were limited to small or selected populations. In the results of this study, blood creatinine levels were found to be higher in the hyperuricemia group than in the no-hyperuricemia group, and glomerular filtration rate levels were lower than in the no-hyperuricemia group. The results of multifactorial logistic regression analysis showed that blood creatinine levels were a risk factor for the development of hyperuricemia, and a moderate decrease in glomerular filtration rate would A moderate decrease in glomerular filtration rate leads to a decrease in blood uric acid excretion and the development of hyperuricemia. A foreign study on the relationship between uric acid and renal function.22 A foreign study on the relationship between uric acid and kidney function showed that the greater the severity of the stage of chronic kidney disease, the higher the creatinine level and the higher the incidence of hyperuricemia. Serum uric acid and blood creatinine interact with each other, and hyperuricemia can, directly and indirectly, cause kidney damage, resulting in decreased glomerular filtration rate and increased blood creatinine. Thus, serum uric acid may be a strong promoter of kidney injury, and its detrimental effects can be detected in the early stages of the disease. Therefore, early knowledge and control of serum uric acid levels in children and adolescents are important for the prevention and treatment of chronic kidney disease.
The present study also found a positive correlation between calcium and the risk of hyperuricemia. However, the interrelationship between serum uric acid and calcium has been less studied, and the mechanism is still inconclusive; the authors speculate that the mechanism may be as follows: firstly, due to the powerful antioxidant properties of serum uric acid, some researchers have suggested that calcium may be a risk factor for metabolic syndrome, which may induce insulin resistance and increase serum uric acid levels.23 On the other hand, it has been suggested that calcium levels may affect the release of parathyroid hormone, which in turn affects the development of serum uric acid.24 This study did not include parathyroid hormone levels for correlation analysis, and the authors will further explore the specific mechanisms of calcium and the development of hyperuricemia in subsequent studies.
Previous studies25–26 found a correlation between serum uric acid concentration and blood pressure, and the results of the present study found that increased blood pressure is a risk factor for the development of hyperuricemia and the relationship between uric acid and blood pressure was confirmed in the present study. The relationship between uric acid and blood glucose is still controversial, and no correlation between uric acid and blood glucose has been found in the present study. Therefore, further studies are needed to confirm the relationship between the two.
This study has some limitations and did not include the analysis of lifestyle, dietary habits, and exercise of the study subjects, and future prospective studies are needed to explore the impact of risk factors associated with hyperuricemia on the disease.
ConclusionIn conclusion, this study found that the prevalence of hyperuricemia was higher in children and adolescents aged 6–17 years in northeastern Sichuan Province through data analysis of a large sample, and hyperuricemia was closely associated with gender, age, body mass index, creatinine, triglycerides, blood calcium, and blood pressure. Therefore, it is important to focus on the serum uric acid level in children and adolescents, pay attention to the prevention and treatment of hyperuricemia, strengthen education, and adopt obesity prevention and healthy lifestyle early intervention to reduce the prevalence of hyperuricemia, which has important clinical significance and social value.
Authors’ contributionsNingting Xiao and Zhennan Zhu: data collection; Heping Zhang and Xueming Jing: research guidance and program design; Xuemei Guo: research design, implementation coordination, and paper writing.
Key Research Project of Sichuan Provincial Health and Health Commission (19ZD006). Sichuan Primary Health Care Development Research Project (SWFZ22-C-94).


