

The aims of this study were twofold. First, to provide evidence of the validity and reliability of the Adolescent Lifestyle Profile-Revised 2 (ALP-R2) among adolescents in Chile; and second, to examine the relationship between the health-promoting behaviors measured by this scale and several demographic variables.
MethodsCross-sectional survey. Students attending grades 9 through 12 from schools representing low-, middle-, and high-income families were included. All schools were in the city of San Felipe, Chile. Students completed the ALP-R2, a fourty-four-item scale aiming to assess health-promoting behaviors. To evaluate validity and reliability, confirmatory factor analysis and omega coefficient calculation were conducted, respectively.
ResultsThe sample size was 572 students (82.5% of the eligible population). More males (56.6%) than females (43.4%) participated in the study, and the mean age was 16.4 (SD, 1.3) years. The ALP-R2 had adequate adjustment indicators in the confirmatory factor analysis, which means that the data supports the original theoretical model (seven subscales). The highest internal consistency was obtained for the total scale (Ω=0.87); and (among the subscales), physical activity (Ω=0.85) and spiritual health (Ω=0.78) had the highest reliability.
ConclusionsThe ALP-R2 appears to be a valid and reliable instrument to assess health-promoting behaviors among adolescents attending secondary schools.
Adolescence is considered to be the period of development ranging between 10 and 19 years old. It is characterized by physical, psychological, and social changes that produce significant tensions at an individual level. Today, adolescents constitute 16.8% of the Latin American and Caribbean population. Their health is key to their countries’ social, economic, and political progress.1 However, it can be observed that their health needs are often not a priority in public policy or politics.
The World Health Organization (WHO) defines lifestyles as “identifiable behavioral patterns, determined by the interaction between individual personal characteristics, social interactions, and socioeconomic and environmental life conditions.”2 An adolescent’s behavior can have positive or negative influences on their health. Healthy lifestyles can be defined as patterns of behavior that help to maintain or improve people's health and well-being.3 Healthy adolescence can be seen as having four components, namely: 1) a successful transition from childhood to adulthood; 2) development of skills that allow individuals to respond successfully to the demands and changes characterizing adolescence (and thereby achieve well-being); 3) an absence of mental and physical disease; and 4) development of healthy lifestyles (HL) that preserve or improve individuals’ health.4 It has been suggested that healthy behaviors established during adolescence help determine one’s health status later in life, and their risk of developing chronic diseases.5
Nola Pender's health promotion model (HPM) provides a conceptual framework for studying health-promoting behaviors, and how they might relate to improving health and well-being. This model considers the following aspects: 1) current behavior appears to be primarily influenced by previous experiences; 2) action plans should include possible reasons for failure in order to anticipate solutions; and 3) plans must be evaluated according to the behavioral results they attain.6 The HPM proposes the study of several health-promoting behaviors and their relationship to different health outcomes: obesity, cardiovascular disease, and substance abuse among them. Research based on this model has yielded evidence regarding predictability of some of its components, and the modification of undesirable behaviors. However, it is still necessary to study health-promoting behaviors more systematically, using comprehensive instruments.
The Health-Promoting Lifestyle Profile scale (HPLP) is one of the first (and the most-used) questionnaires for assessing health-promoting behaviors. It has 52 items and comprises six subscales: nutrition; physical activity; health responsibility; stress management; interpersonal relationships; and spiritual growth. HPLP has been applied to both young people and adults.7 This scale was later revised (HPLP II), and validated in several cultures.8,9 Interest in assessing healthy lifestyles among adolescents has prompted the development of several new instruments based on the HPM. For example, the Adolescent Lifestyle Questionnaire (ALQ) is a 43-item scale organized into seven subscales: 1) identity awareness; 2) nutrition; 3) physical participation; 4) safety; 5) health awareness; 6) social support; and 7) stress management. Its aim is to assess early, middle, and late adolescence.10 Hendricks et al. developed the Adolescent Lifestyle Profile (ALP), based on Pender's Revised Health Promoting Lifestyle Profile (HPLP II) for adults.11 The ALP initially had 42 items and six subscales: 1) personal growth (seven items): 2) health responsibility (seven items); 3) nutrition (nine items); 4) physical activity (six items); 5) interpersonal relationships (seven items); and 6) stress management (six items). A more recent study modified this scale by adding two items and splitting the Personal Growth subscale into two domains: spiritual health and positive life perspective. The resulting new scale, Adolescent Lifestyle Profile-Revised 2 (ALP-R2), has 44 items and seven subscales. Finally, Chen et al. introduced the Adolescent Health Promotion Scale (AHPS), a 40-item Likert-type self-report instrument used to detect healthy lifestyles in adolescents.12,13 It measures six constructs: 1) social support; 2) life appreciation; 3) health responsibility; 4) nutritional behaviors; 5) exercise behaviors; and 6) stress management. ALQ, ALP-R2, and AHPS have similar items evaluating similar healthy lifestyles. The main exception is ALP-R2, which also includes the spiritual health dimension. The spiritual dimension seems to be a relevant domain for adolescents. For example, Raj et al. observed that many students had faith in God. This helped them to feel supported, thereby improving well-being.14
To date, few studies have been conducted in Latin-American and Caribbean countries exploring how adolescents perform health-promoting behaviors. In cases where studies were implemented, non-validated questionnaires were used. The authors of the present study have previously worked to validate the Adolescent Health Promotion Scale (AHPS) for early adolescents; i.e., those attending grades five through eight (between 10 and 14 years of age).15 However, the AHPS had several limitations. For instance, some items did not load into the proposed latent factors, and some subscales did not correspond to the original theoretical framework.
In sum, it was decided to use the ALP-R2 scale among late adolescents (between 14 and 18 years of age) and add evidence of its validity and reliability in evaluating health-promoting behaviors.
Materials and methodsDesign and sampleThis was a cross-sectional design study. A total of 693 adolescents, attending grades nine through 12, were invited to participate. Three schools were included in this study. Each represented a particular socioeconomic status (SES), according to Chile's Education Quality Measurement System (SIMCE; high, medium, or low).16 All schools were in San Felipe, one of the first cities founded in Chile. Its cultural and social composition is representative of the population living in Chile’s central region. The demographic age structure is similar to that of the whole country.
MeasuresALP-R2 comprises 44 items. Each statement represents a healthy behavior, and adolescents are asked about how frequently they performed each behavior, using a scale from 1 (never) to 4 (always). This instrument contains seven subscales, which evaluate the following domains (internal reliability coefficients personally communicated by Prof. Constance Hendricks are in brackets):
- (i)
Health Responsibility [0.825]: evaluates whether adolescent takes care of their health
- (ii)
Physical Activity [0.773]: measures whether adolescent practices physical activity or participates in sports
- (iii)
Nutrition [0.648)]: assesses nutritional habits
- (iv)
Positive Life Perspective [0.810]: asks whether adolescent has a positive perspective on present and future goals and expectations
- (v)
Interpersonal Relationships [0.769]: assesses social competence skills
- (vi)
Stress Management [0.656]: evaluates personal practices that help reduce anxiety
- (vii)
Spiritual Health [0.824]: evaluates if adolescent has religious beliefs, or practices meditation
The Cronbach's alpha total scale reached 0.929. Authorization from authors was granted to translate, adapt, and use this scale. Then, bilingual experts translated the English version of the instrument into Spanish. The resulting Spanish version of the scale was assessed by expert raters, and then by non-participating adolescents to evaluate the questions’ intelligibility. Some items were rewritten, but none were excluded.
ProcedureUrban schools representing each SES status in San Felipe were invited to participate. When a school showed interest in participating, a meeting was arranged with the school’s administrators to explain the research project. Once one school from each SES accepted, there was no further recruiting of schools. Therefore, three schools (one from each SES) were included in this study. After the principals granted authorization, each class’s head teacher sent informed and written consent forms to students’ parents or main caregivers. The signed documents (either authorizing or rejecting a student's participation) were due by an established date. Participation was voluntary. Additionally, when data was collected, students had to provide their signed assent. Data collection took place on a single day in the last week of July 2012, and was conducted by fourth-year nursing students from Universidad de Valparaíso.
Analytic strategyDescriptive statistics are reported as percentages with 95% confidence intervals (CI 95%) for level (grade), sex, SES, religion, father’s and mother’s education, and place of residence.
Psychometrical properties analysisMean, median, skewness, and kurtosis parameters were calculated. Secondly, all ALP-R2 items were summed both within subscales and in the total scale. Later, using the Spearman Coefficient (rho), correlations were assessed between items and subscales, and between items and the total scale. Rho was interpreted according to the following criteria: 0–0.25: scarce or null; 0.26–0.50: weak; 0.51–0.75: moderately strong; 0.76–1.00: strong-to-perfect.17
Dimensionality and reliabilityALP-R2 validity was tested using confirmatory factor analysis (CFA), with unweighted least squares (ULS) using a polychoric correlation matrix. Polychoric correlations are advised for factor analysis when distributions of items are ordinals. CFA examines relationships between variables and observed factors.
Several goodness-of-fit indicators were considered in order to judge whether the proposed model is consistent with empirical data: 1) root mean square error of approximation (RMSEA); 2) standardized root mean square residual (SRMR); 3) normed fit index (NFI); 4) non-normed fit index (NNFI); 5) comparative fit index (CFI); 6) goodness-of-fit index (GFI); and 7) adjusted goodness-of-fit index (AGFI). The study interpreted goodness-of-fit indicators as follows: RMSEA values less than or equal to 0.05 as good, values between 0.05 to 0.08 as adequate adjustment; SRMR less than 0.05 as good, less than 0.10 as acceptable; NFI greater than or equal to 0.95 as good, values between 0.90 and 0.95 as acceptable; NNFI greater than or equal to 0.97 as good, values between 0.95 and 0.97 as acceptable. CFI used the same criteria as NNFI: GFI greater than 0.95 as good, values between 0.90 and 0.95 as acceptable; AGFI greater than 0.90 as good, values between 0.85 and 0.90 as acceptable.
Additionally, reliability of instrument was evaluated using coefficient omega (Ω). Acceptable value was 0.65 or more.18
Association analysesAssociation between subscales and sex was studied using the Mann–Whitney test. Between the subscales and each SES, the Kruskal–Wallis test was used.
All data analyses were conducted using R 3.5.0. CFA was conducted using the lavaan package in R 3.5.0. The significance level was 0.05.
Ethical considerationsEthical approval was obtained from the Ethical Committee of Health Service of Aconcagua, Chile (Number: 1412; Date: July 11th, 2012). Informed and written consent was obtained from participants’ parents. The adolescents were also asked for their assent. All information was regarded as strictly confidential, and participating schools were informed of results only at a collective level.
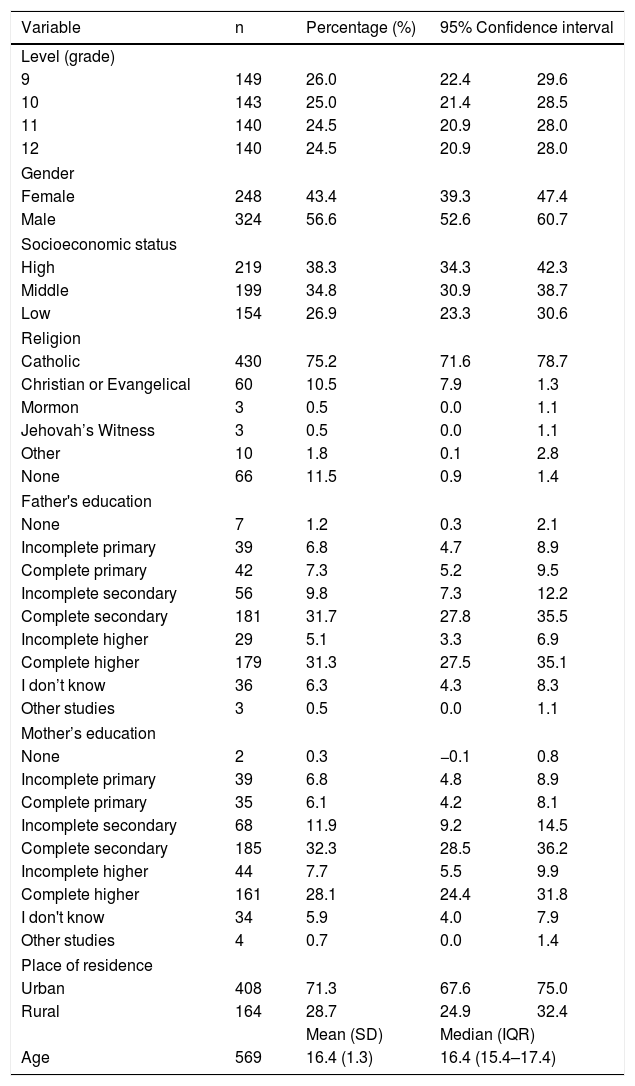
ResultsDescription of sampleThree invited schools opted to participate. There were 572 participanting students (82.5% of the eligible population). More males (56.6%, n=324) than females (43.4%, n=248) completed the questionnaire. The mean age was 16.4 (SD±1.3) years. Participants’ ages ranged from 14 to 21 years. Distribution by school level was homogeneous (24.5%–26.0%). A total of 75.2% (n=430) considered themselves Catholic. Regarding father’s education, 68% (n=389) completed secondary education; and regarding mother’s education, 68% (n=390) completed secondary education. A total of 71.3% (n=408) reported living in an urban area (Table 1).
Description of the sample according to demographic variables (grade, gender, socioeconomic status, religion, Parents’ education, and residence). San Felipe, Chile (year of data collection: 2012).
| Variable | n | Percentage (%) | 95% Confidence interval | |
|---|---|---|---|---|
| Level (grade) | ||||
| 9 | 149 | 26.0 | 22.4 | 29.6 |
| 10 | 143 | 25.0 | 21.4 | 28.5 |
| 11 | 140 | 24.5 | 20.9 | 28.0 |
| 12 | 140 | 24.5 | 20.9 | 28.0 |
| Gender | ||||
| Female | 248 | 43.4 | 39.3 | 47.4 |
| Male | 324 | 56.6 | 52.6 | 60.7 |
| Socioeconomic status | ||||
| High | 219 | 38.3 | 34.3 | 42.3 |
| Middle | 199 | 34.8 | 30.9 | 38.7 |
| Low | 154 | 26.9 | 23.3 | 30.6 |
| Religion | ||||
| Catholic | 430 | 75.2 | 71.6 | 78.7 |
| Christian or Evangelical | 60 | 10.5 | 7.9 | 1.3 |
| Mormon | 3 | 0.5 | 0.0 | 1.1 |
| Jehovah’s Witness | 3 | 0.5 | 0.0 | 1.1 |
| Other | 10 | 1.8 | 0.1 | 2.8 |
| None | 66 | 11.5 | 0.9 | 1.4 |
| Father's education | ||||
| None | 7 | 1.2 | 0.3 | 2.1 |
| Incomplete primary | 39 | 6.8 | 4.7 | 8.9 |
| Complete primary | 42 | 7.3 | 5.2 | 9.5 |
| Incomplete secondary | 56 | 9.8 | 7.3 | 12.2 |
| Complete secondary | 181 | 31.7 | 27.8 | 35.5 |
| Incomplete higher | 29 | 5.1 | 3.3 | 6.9 |
| Complete higher | 179 | 31.3 | 27.5 | 35.1 |
| I don’t know | 36 | 6.3 | 4.3 | 8.3 |
| Other studies | 3 | 0.5 | 0.0 | 1.1 |
| Mother’s education | ||||
| None | 2 | 0.3 | −0.1 | 0.8 |
| Incomplete primary | 39 | 6.8 | 4.8 | 8.9 |
| Complete primary | 35 | 6.1 | 4.2 | 8.1 |
| Incomplete secondary | 68 | 11.9 | 9.2 | 14.5 |
| Complete secondary | 185 | 32.3 | 28.5 | 36.2 |
| Incomplete higher | 44 | 7.7 | 5.5 | 9.9 |
| Complete higher | 161 | 28.1 | 24.4 | 31.8 |
| I don't know | 34 | 5.9 | 4.0 | 7.9 |
| Other studies | 4 | 0.7 | 0.0 | 1.4 |
| Place of residence | ||||
| Urban | 408 | 71.3 | 67.6 | 75.0 |
| Rural | 164 | 28.7 | 24.9 | 32.4 |
| Mean (SD) | Median (IQR) | |||
| Age | 569 | 16.4 (1.3) | 16.4 (15.4–17.4) | |
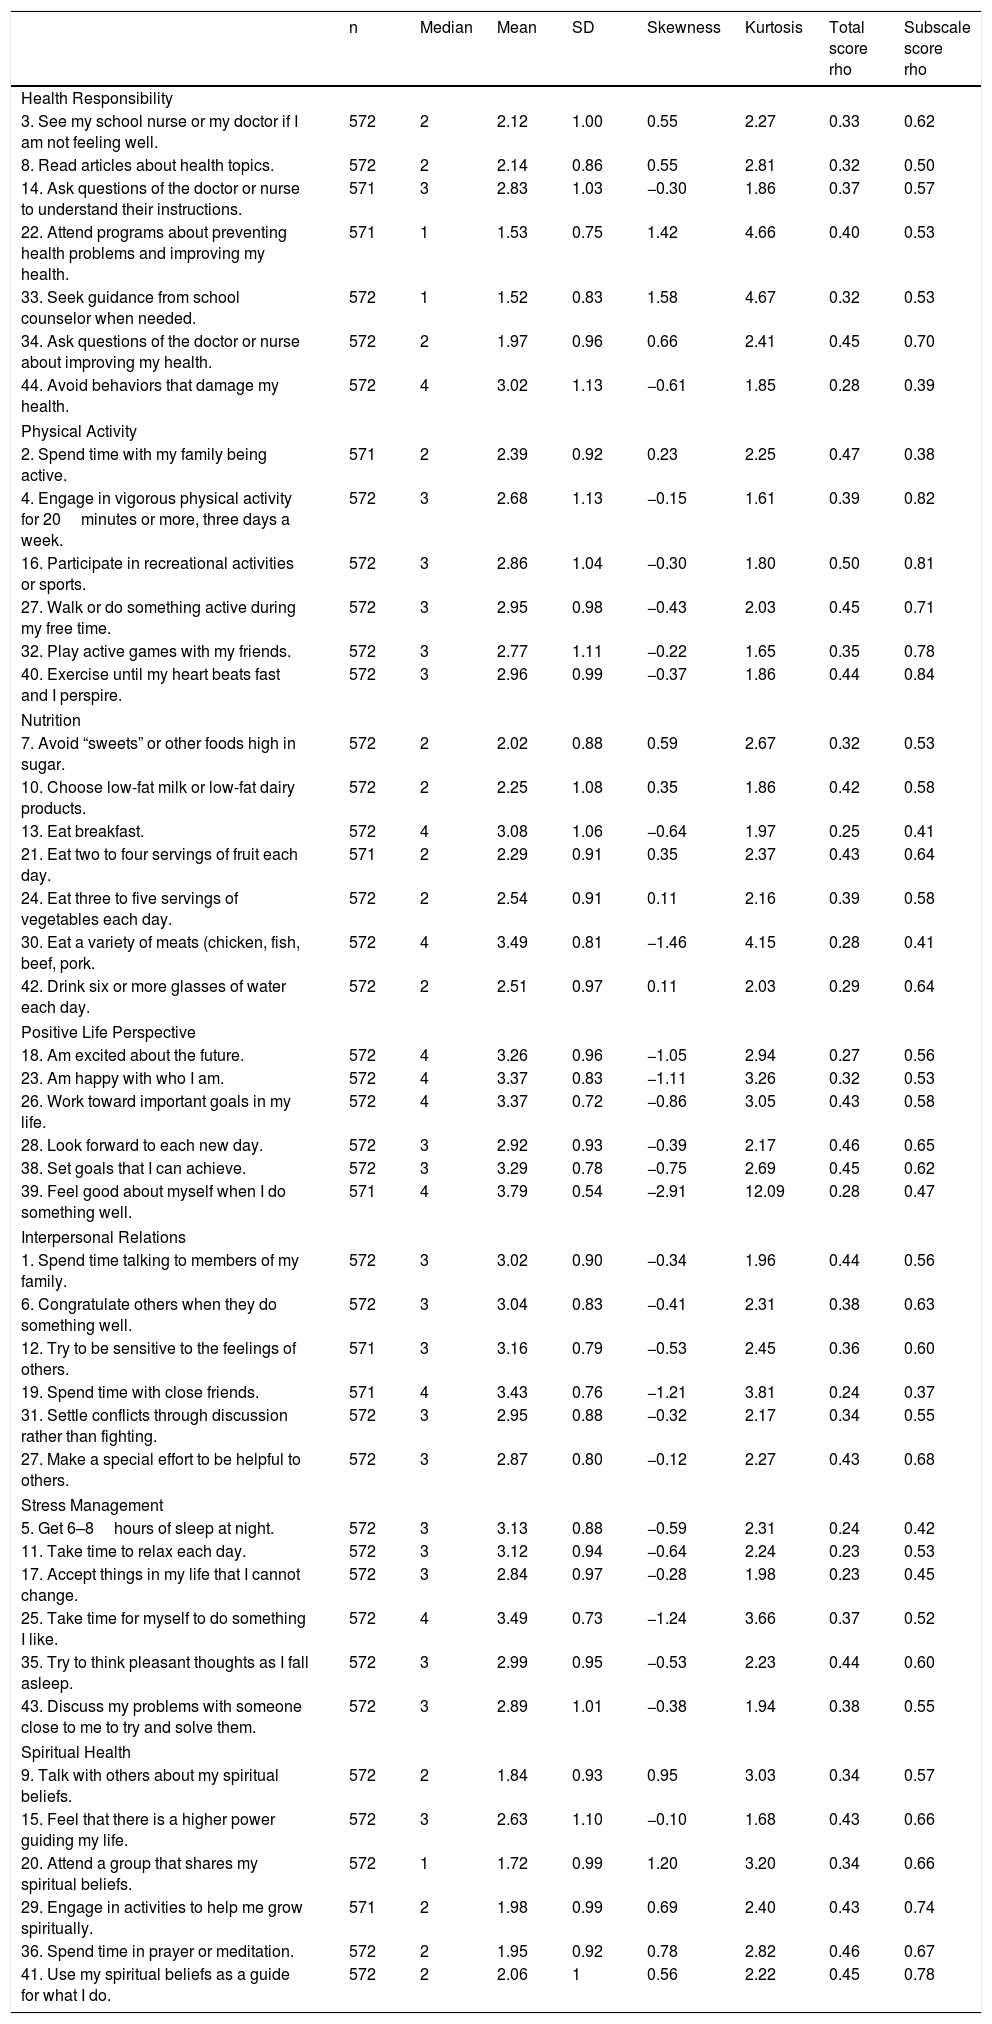
Descriptive statistics of all items are shown in Table 2. On the Physical Activity scale, all items have a symmetric response to the mean, whereas the subscales of Health Responsibility, Positive Life Perspective, Stress Management, and Spiritual Health are mostly comprised of items with asymmetric responses (skewness parameters ranging between −0.5 to 0.5).
Descriptive statistics and correlations between the items of ALPR2 and the total scores, as well as the subscale scores.
| n | Median | Mean | SD | Skewness | Kurtosis | Total score rho | Subscale score rho | |
|---|---|---|---|---|---|---|---|---|
| Health Responsibility | ||||||||
| 3. See my school nurse or my doctor if I am not feeling well. | 572 | 2 | 2.12 | 1.00 | 0.55 | 2.27 | 0.33 | 0.62 |
| 8. Read articles about health topics. | 572 | 2 | 2.14 | 0.86 | 0.55 | 2.81 | 0.32 | 0.50 |
| 14. Ask questions of the doctor or nurse to understand their instructions. | 571 | 3 | 2.83 | 1.03 | −0.30 | 1.86 | 0.37 | 0.57 |
| 22. Attend programs about preventing health problems and improving my health. | 571 | 1 | 1.53 | 0.75 | 1.42 | 4.66 | 0.40 | 0.53 |
| 33. Seek guidance from school counselor when needed. | 572 | 1 | 1.52 | 0.83 | 1.58 | 4.67 | 0.32 | 0.53 |
| 34. Ask questions of the doctor or nurse about improving my health. | 572 | 2 | 1.97 | 0.96 | 0.66 | 2.41 | 0.45 | 0.70 |
| 44. Avoid behaviors that damage my health. | 572 | 4 | 3.02 | 1.13 | −0.61 | 1.85 | 0.28 | 0.39 |
| Physical Activity | ||||||||
| 2. Spend time with my family being active. | 571 | 2 | 2.39 | 0.92 | 0.23 | 2.25 | 0.47 | 0.38 |
| 4. Engage in vigorous physical activity for 20minutes or more, three days a week. | 572 | 3 | 2.68 | 1.13 | −0.15 | 1.61 | 0.39 | 0.82 |
| 16. Participate in recreational activities or sports. | 572 | 3 | 2.86 | 1.04 | −0.30 | 1.80 | 0.50 | 0.81 |
| 27. Walk or do something active during my free time. | 572 | 3 | 2.95 | 0.98 | −0.43 | 2.03 | 0.45 | 0.71 |
| 32. Play active games with my friends. | 572 | 3 | 2.77 | 1.11 | −0.22 | 1.65 | 0.35 | 0.78 |
| 40. Exercise until my heart beats fast and I perspire. | 572 | 3 | 2.96 | 0.99 | −0.37 | 1.86 | 0.44 | 0.84 |
| Nutrition | ||||||||
| 7. Avoid “sweets” or other foods high in sugar. | 572 | 2 | 2.02 | 0.88 | 0.59 | 2.67 | 0.32 | 0.53 |
| 10. Choose low-fat milk or low-fat dairy products. | 572 | 2 | 2.25 | 1.08 | 0.35 | 1.86 | 0.42 | 0.58 |
| 13. Eat breakfast. | 572 | 4 | 3.08 | 1.06 | −0.64 | 1.97 | 0.25 | 0.41 |
| 21. Eat two to four servings of fruit each day. | 571 | 2 | 2.29 | 0.91 | 0.35 | 2.37 | 0.43 | 0.64 |
| 24. Eat three to five servings of vegetables each day. | 572 | 2 | 2.54 | 0.91 | 0.11 | 2.16 | 0.39 | 0.58 |
| 30. Eat a variety of meats (chicken, fish, beef, pork. | 572 | 4 | 3.49 | 0.81 | −1.46 | 4.15 | 0.28 | 0.41 |
| 42. Drink six or more glasses of water each day. | 572 | 2 | 2.51 | 0.97 | 0.11 | 2.03 | 0.29 | 0.64 |
| Positive Life Perspective | ||||||||
| 18. Am excited about the future. | 572 | 4 | 3.26 | 0.96 | −1.05 | 2.94 | 0.27 | 0.56 |
| 23. Am happy with who I am. | 572 | 4 | 3.37 | 0.83 | −1.11 | 3.26 | 0.32 | 0.53 |
| 26. Work toward important goals in my life. | 572 | 4 | 3.37 | 0.72 | −0.86 | 3.05 | 0.43 | 0.58 |
| 28. Look forward to each new day. | 572 | 3 | 2.92 | 0.93 | −0.39 | 2.17 | 0.46 | 0.65 |
| 38. Set goals that I can achieve. | 572 | 3 | 3.29 | 0.78 | −0.75 | 2.69 | 0.45 | 0.62 |
| 39. Feel good about myself when I do something well. | 571 | 4 | 3.79 | 0.54 | −2.91 | 12.09 | 0.28 | 0.47 |
| Interpersonal Relations | ||||||||
| 1. Spend time talking to members of my family. | 572 | 3 | 3.02 | 0.90 | −0.34 | 1.96 | 0.44 | 0.56 |
| 6. Congratulate others when they do something well. | 572 | 3 | 3.04 | 0.83 | −0.41 | 2.31 | 0.38 | 0.63 |
| 12. Try to be sensitive to the feelings of others. | 571 | 3 | 3.16 | 0.79 | −0.53 | 2.45 | 0.36 | 0.60 |
| 19. Spend time with close friends. | 571 | 4 | 3.43 | 0.76 | −1.21 | 3.81 | 0.24 | 0.37 |
| 31. Settle conflicts through discussion rather than fighting. | 572 | 3 | 2.95 | 0.88 | −0.32 | 2.17 | 0.34 | 0.55 |
| 27. Make a special effort to be helpful to others. | 572 | 3 | 2.87 | 0.80 | −0.12 | 2.27 | 0.43 | 0.68 |
| Stress Management | ||||||||
| 5. Get 6–8hours of sleep at night. | 572 | 3 | 3.13 | 0.88 | −0.59 | 2.31 | 0.24 | 0.42 |
| 11. Take time to relax each day. | 572 | 3 | 3.12 | 0.94 | −0.64 | 2.24 | 0.23 | 0.53 |
| 17. Accept things in my life that I cannot change. | 572 | 3 | 2.84 | 0.97 | −0.28 | 1.98 | 0.23 | 0.45 |
| 25. Take time for myself to do something I like. | 572 | 4 | 3.49 | 0.73 | −1.24 | 3.66 | 0.37 | 0.52 |
| 35. Try to think pleasant thoughts as I fall asleep. | 572 | 3 | 2.99 | 0.95 | −0.53 | 2.23 | 0.44 | 0.60 |
| 43. Discuss my problems with someone close to me to try and solve them. | 572 | 3 | 2.89 | 1.01 | −0.38 | 1.94 | 0.38 | 0.55 |
| Spiritual Health | ||||||||
| 9. Talk with others about my spiritual beliefs. | 572 | 2 | 1.84 | 0.93 | 0.95 | 3.03 | 0.34 | 0.57 |
| 15. Feel that there is a higher power guiding my life. | 572 | 3 | 2.63 | 1.10 | −0.10 | 1.68 | 0.43 | 0.66 |
| 20. Attend a group that shares my spiritual beliefs. | 572 | 1 | 1.72 | 0.99 | 1.20 | 3.20 | 0.34 | 0.66 |
| 29. Engage in activities to help me grow spiritually. | 571 | 2 | 1.98 | 0.99 | 0.69 | 2.40 | 0.43 | 0.74 |
| 36. Spend time in prayer or meditation. | 572 | 2 | 1.95 | 0.92 | 0.78 | 2.82 | 0.46 | 0.67 |
| 41. Use my spiritual beliefs as a guide for what I do. | 572 | 2 | 2.06 | 1 | 0.56 | 2.22 | 0.45 | 0.78 |
On the Health Responsibility subscale, weak correlations were found between all items and the total score. Within this subscale, items 3, 14, 22, 33, and 44 had moderately strong correlation. For Physical Activity, correlations between items and the total score were weak for all items. Within this subscale, correlations were strong-to-perfect for items 4, 16, 32, and 40. On the Nutrition subscale, correlations between items and the total score were weak for all items, except for item 13 (which was scarce or null). Within this subscale, moderately strong correlations were found between items 7, 10, 21, 24, and 42. Items of Positive Life Perspective had weak correlations with the total score, and correlations between items and the subscale were moderately strong among items 18, 23, 26, 28, and 38. The Interpersonal Relationships subscale had one item (19) with scarce or null correlation, and weak correlations for all other items, (as well as with the total score). However, for items 1, 6, 12, 31, and 37, there were moderately strong correlations with the subscale. On the Stress Management subscale, some items had scarce (5, 11, 17) or weak (5, 36, 43) correlations with the total score and moderately strong correlations between items 11, 25, 36, and 43 and the subscale. Finally, in the Spiritual Health dimension, all items had weak correlations with the total score, and items 9, 15, 20, 29, and 35 had moderately strong correlations with the subscale. Meanwhile, item 41 had strong-to-perfect correlation (Table 2 and Fig. 1).
Dimensionality and reliability
ALP-R2 had acceptable parameters for six out of the seven calculated goodness-of-fit indicators: SRMR (0.08), GFI (0.98), AGFI (0.97), NNFI (0.97), and RMSEA (0.07). Values of NFI and CFI were 0.83 and 0.87, respectively.
The total scale reliability was 0.87, whereas subdimensions’ reliabilities ranged between 0.55 and 0.85. Four out of seven subdimensions had values lower than 0.65: Stress Management (0.49), Nutrition (0.55), Interpersonal Relationships (0.61), and Positive Life Perspective (0.64). The highest reliability corresponds to Physical Activity (0.85).
Association analysesSexThe study found statistically significant differences between men and women in four subscales. In Health Responsibility, Interpersonal Relationships, and Spiritual Health, women had higher medians than men (2.29, 3.17, 2.17), whereas men had a higher median in Physical Activity (3.17).
SESThere were differences in six of the seven subscales based on SES. The median of score on the Physical Activity and Nutrition subscales were highest among students coming from high SES. The median of subscales Positive Life Perspective, Interpersonal Relations, Stress Management, and Spiritual Health was higher among students from high and medium SES than among students from areas with low SES.
Education levelsIt was observed that median scores on the Health Responsibility subscale were higher among those in grades nine and ten than among those in grades 11 and 12. In contrast, median scores on the Physical Activity and Nutrition subscales were highest among students in grade nine.
DiscussionThis is the first study exploring ALP-R2 psychometric properties by sampling a Spanish-speaking adolescent population in Latin-American and Caribbean countries. The use of the ALP-R2 among these countries could provide information about health-promoting behaviors among adolescents either in prevalence and descriptive studies or for the evaluation of interventions aiming to promote healthy behaviors in this population.
This study examined the validity and reliability of ALP-R2 among adolescents in Chile. Psychometric properties of the total scale and the generated subscales appear to be adequate. ALP-R2 is a multi-dimensional scale, and all subscales were part of a single underlying healthy behavior construct. The scale’s factorial structure was consistent with the structure initially proposed by the authors. Seven relevant dimensions of adolescents’ lives can be assessed using this scale: 1) Nutrition; 2) Physical Activity; 3) Health Responsibility; 4) Spiritual Health; 5) Positive Life Perspective; 6) Interpersonal Relationships; and 7) Stress Management. Most of the subscales have good internal reliability, and correlations between items and their respective subscales were mostly strong. Other research groups have assessed the structure of the items on the scale in the US19 and in Portugal.20 However, they used smaller sample sizes than the study conducted in Chile. For instance, the US study showed a five-factor solution, which differed from the theoretical model proposed by Hendricks et al. The US study included 311 adolescents, aged between 15 and 17 years. Of these subjects, approximately 54.4% were Latino, 12.5% White, 17.4% Black, 8.3% Asian, and 7.4% Other.19 The different factor solution between their study and the present study may be related to the smaller sample size, and the adolescents’ heterogenous ethnic background. Yet, the Portuguese study showed an adequate fit to data for 36 items (eight items were removed) in a seven-factor structure, like the results found of this study.20
Few items had scarce correlations between them and the total scale. Within the Nutrition subscale, item 13 (“Eat breakfast”) had low correlation with the total scale. This may be partially explained by the fact that adolescents in Chile do not necessarily consider eating breakfast to be an essential healthy behavior. They may use skipping breakfast as measure for reducing weight, believing that this unhealthy behavior is counterbalanced by other healthier behaviors (such as eating foods with less sugar or fat). Furthermore, a recent Chilean study found that 55% of adolescents do not eat breakfast regularly,21 showing that this is common behavior.
Within the Interpersonal Relationships subscale, item 19 (“Spend time with close friends”) had low correlation with the score of the total scale. Adolescents may select their close friends based on similar interests and behaviors. Considering that risk behaviors are widespread at this age, it is not difficult to understand that adolescents may not always link “spending time with friends” to healthy behaviors.
Within the Stress Management subscale, items five (“Get six to eight hours of sleep at night”), 11 (“Take time to relax each day”), and 17 (“Accept things in my life that I cannot change”) had low correlations with the total scale. There is strong evidence regarding the importance of proper sleep to good mental health.22 Yet, adolescents seem to be less aware of sleep’s importance to their wellbeing.23 For example, many adolescents prefer to spend time using electronic devices at night.22 Similar explanations may be considered for item 11: adolescents may be less aware that it is important to have time to relax. Instead, they spend most of their free time using technological devices. Regarding item 17, adolescents may think this statement concerns a belief rather than actual concrete behavior. Thus, it may be associated more loosely with fostering healthy behaviors.
The present study found differences between boys and girls in the areas of Health Responsibility, Physical Activity (PA), Interpersonal Relationships, and Stress Management. Boys reported better PA, which is consistent with Yañez-Silva et al. In that study, males also had higher PA scores than women.24 Males consistently report being more physically active than females, regardless of age or scale of measurement.25 This difference may increase the risk of long-term poor health outcomes among females.26 However, girls had better Interpersonal Relationships. Other studies have found that girls are more interpersonally sensitive, and more socio-emotionally oriented than men.26 Finally, differences between boys and girls may be also explained by the gender norms and expectations which are still prevalent in Latin American countries. For example, physical education in schools is still dominated by sports such as football, which is promoted among boys at a higher proportion than among girls. This school practice may increase the interest in sports among boys, but at the same time, disengage girls from physical activities.
Younger students scored higher for healthy behaviors, especially in Health Responsibility and Nutrition, which was confirmed by other studies.27 This might be related to younger students having more assistance from parents, whereas older adolescents have greater autonomy. In any case, this supports the idea that strengthening protective factors in adolescence facilitates the achievement of integral health later in life.
Adolescents from high-income families seem to have better lifestyle profiles.28 Highly-educated parents seems to pass their cultural capital to their children, helping them to adopt healthy behaviors and school values.28 The evidence has also shown that poverty affects people’s abilities to adopt healthy lifestyles.29 For example, high-fat, energy-dense diets are cheaper and more affordable than diets based on lean meats, fish, fresh vegetables, and fruit. This may explain in part why the highest obesity rates are found in populations with highest poverty rates and the least education.30
The following should be considered limitations of this study: a) sampling by convenience and a relatively small sample size may affect generalization of the results; b) other related factors, such as body mass index (BMI), were not evaluated; and c) limitations of cross-sectional designs do not allow inferences about the long-term effects of these behaviors. Longitudinal studies are need to establish trajectories of risk behaviors and their relationship to noncommunicable diseases such as obesity, cancer, and diabetes.29 ALP-R2 psychometric properties need to be explored in other Latin-American and Caribbean countries. Finally, potential cultural differences must not be ignored.
Therefore, the authors recommend evaluation of adolescent lifestyles at regional and national levels. This data may aid in distribution of resources promoting health and preventive interventions.
ConclusionALP-R2 seems to have valuable psychometric properties for use with late adolescents. It may be helpful in describing the distribution of health-promoting behaviors among them. Consequently, it may allow for the assessment of interventions promoting healthy (and preventing risky) behaviors.
Conflicts of interestThe authors declare no conflicts of interest.
The authors acknowledge the help in the fieldwork done by Paulina Arenas, Daniela Contreras, María Ignacia García, Karina Huerta, Javiera Lueiza, Cristina Peña, Eduardo Valdebenito, and Cristha Zúñiga. We would like to thank all students who participated in this study and their families.
The writing of this manuscript was partially funded by Millennium Science Initiative of the Ministry of Economy, Development, and Tourism, through the following grant: “Millennium Nucleus to Improve the Mental Health of Adolescents and Youths, Imhay”.
Please cite this article as: Gaete J, Olivares E, Godoy MI, Cárcamo M, Montero-Marín J, Hendricks C, et al. Adolescent Lifestyle Profile-Revised 2: validity and reliability among adolescents in Chile. J Pediatr (Rio J). 2020;97:52–60.


