To identify the prevalence and factors associated with vitamin A deficiency (VAD) in children and adolescents.
MethodsThis was a cross-sectional study involving 546 schoolchildren, aged between 7 and 14 years, of both genders, enrolled in public elementary schools. Blood was collected for measurement of serum retinol. The retinol concentration in the samples was determined by high performance liquid chromatography (HPLC). Data were collected on anthropometrics, dietary, demographic, and socioeconomic factors. Polytomous logistic regression was used to evaluate the associations of interest.
ResultsApproximately 27.5% of the students had retinol values<30μg/dL. The multivariate analysis showed, after the appropriate adjustments, a positive and statistically significant association of moderate/severe VAD (OR=2.19; 95% CI 1.17 to 4.10) and marginal VAD (OR=2.34; 95% CI 1.47 to 3.73) with age<10 years. There was also association of VAD moderate/severe (OR=2.01; 95% CI 1.01 to 5.05) and borderline VAD (OR=2.14; 95% CI: 1.08 to 4.21) with the anthropometric status of underweight. Lower intake of retinol was detected among those with severe VAD.
ConclusionVAD is a health concern among children and adolescents. Lower weight and younger schoolchildren had greater vulnerability to VAD.
Identificar prevalência e fatores associados à deficiência de vitamina A (DVA) entre crianças e adolescentes.
MétodosEstudo transversal envolvendo 546 escolares, com idade entre 7 e 14 anos, de ambos os sexos, matriculadas na rede pública do ensino fundamental. O sangue foi coletado para dosagem dos níveis séricos de retinol. A concentração de retinol das amostras foi determinada pelo método da cromatografia líquida de alta eficiência (CLAE). Coletaram-se dados antropométricos, alimentares, demográficos e socioeconômicos. Utilizou-se da regressão logística politômica para avaliar as associações de interesse.
ResultadosAproximadamente 27,5% dos estudantes apresentaram valores de retinol<30μg/dL. Em análise multivariada, verificou-se, após devidos ajustes, associação positiva e estatisticamente significante da DVA moderada/grave (OR=2,19; IC 95%: 1,17-4,10) e da DVA marginal (OR=2,34; IC 95%: 1,47-3,73) com a idade<10anos. Verificou-se, igualmente, associação da DVA moderada/grave (OR=2,01; IC 95%: 1,01-5,05) e DVA marginal (OR=2,14; IC 95%: 1,08-4,21) com o estado antropométrico magreza. Menor consumo de retinol foi detectado entre aqueles com DVA grave.
ConclusãoA deficiência de vitamina A configura-se como um problema de saúde preocupante entre os escolares e adolescentes. Constatou-se maior vulnerabilidade dos escolares de baixo peso e mais jovens à DVA.
Vitamin A deficiency (VAD) is a nutritional deficiency of high magnitude that can be caused by insufficient intake of vitamin A food sources or by vitamin absorption, transport, or metabolism problems. The importance of adequate vitamin A nutritional status is indisputable, as it has very diverse physiological roles in the visual process, in the integrity of epithelial tissue and immune system, as well as in other metabolic functions.1
VAD specifically affects populations subjected to poor living conditions, in addition to other factors related to morbidity conditions that also contribute to serum retinol depletion. Among them are infections that increase the necessity or stimulate endogenous losses of this nutrient, and protein-energy malnutrition, which affects the synthesis of retinol binding protein (RBP), thereby decreasing retinol availability.2
Children at preschool age, pregnant women, and nursing mothers are regarded as the classic risk group. However, studies have indicated other possible risk groups for the deficiency; among these are children and adolescents. Since it is involved in growth and physical development, vitamin A also becomes essential at this stage.1,3 The results of the few studies available in the Brazilian literature generally indicate that VAD prevalence ranges from 6.8% to 34.0% in this population.3
Since they are not classically considered as a risk group, there are not many studies on vitamin A nutritional status in schoolchildren (including adolescents), which has prevented a proper assessment of the actual magnitude of VAD in this age group in Brazil. Therefore, the present study aimed to estimate the prevalence of VAD and associated factors in children and adolescents enrolled in public schools in the city of Salvador, state of Bahia, Brazil.
MethodsThis was a cross-sectional study involving students of both genders, aged 7-14 years. Participants were identified from a broader study that aimed to identify factors associated with iron-deficiency anemia in children and adolescents enrolled in public schools in the city of Salvador.4
The original study sampling procedure involved a complex study design, considering the stratification of schools at two levels (state and municipal), followed by cluster sampling procedure in three phases: the first phase assessed the health districts; the second, the schools; the third, the students. Due to logistical field issues, the information on the selected students was obtained from six of the 12 existing districts in Salvador, a city that has 117 state and 173 municipal schools. The state schools had 58,059 students; the municipal schools, 56,555. To meet the previously defined sample size, it was necessary to select ten students from each of the 58 municipal schools and 23 students from each of the 27 state schools, totaling 1,200 students.
A total of 600 students were randomly selected for this study, corresponding to 50% of the original sample. Considering that this sample was not estimated to investigate the object used in this study, it was decided to retrospectively calculate the sampling error. In these circumstances, and based on the prevalence of inadequate VAD identified in this study (27.5%), the previously used sample number allowed for the determination of the factors associated with the studied outcome with error up to 2.75%, considering the 95% level of confidence.
Response variableSerum retinol measurementBlood samples (5mL) were collected in the early morning, with the child in fasting condition, through peripheral venipuncture using a disposable needle and syringe. The samples were stored in dry, clear tubes, wrapped in aluminum foil to minimize losses due to light exposure. After clot retraction and separation by centrifugation (1,500rpm for 10min), serum samples were packed and sent to the Laboratory of the School of Nutrition of the Universidade Federal da Bahia for serum retinol measurement. The procedures were standardized using national and international references. The routine quality control recommended by the International Vitamin A Consultative Group (IVACG) was used.5 All handling of blood samples, from collection to the laboratory determinations, were performed in a low-light environment.
Serum retinol extraction was performed as proposed by the IVACG.5 Sample retinol levels were determined using the high-performance liquid chromatography (HPLC) method. A reverse phase system was used, followed by PDA detection at 325nm. An Alliance 2695 Waters chromatograph (Waters Technologies do Brasil, SP, Brazil) was used in the study, coupled to a Waters 2998 photodiode array detector (PDA) (Waters Technologies do Brasil, São Paulo, Brazil). The analysis was developed using XTerra MS C18 (Waters Technologies do Brasil, São Paulo, Brazil) columns and 5μm pore size (150mm x 3.9mm), protected by a C18 guard column.
The chromatograph progressed in isocratic elution with 100% methanol mobile phase (1mL/min). The retention time of retinol was 2.4min. The identification and quantification of serum retinol in the samples was established by comparison with the retention time and the respective standard area at a wavelength of 325nm. The accuracy of the method was assessed through an extraction recovery test, with 95% recovery of retinol acetate (internal standard) added to the samples. The accuracy was evaluated by the reproducibility test, in which triplicates of the same sample were measured for retinol for three alternate days. The values found showed a variation of less than one standard deviation. The standard curve was performed with all-trans retinol standard reference (Sigma) at different concentrations.
The limits of detection and quantification were based on the standard curve linearity, showing values of 0.82μg/dL and 2.74μg/dL, respectively. The values of serum retinol were categorized into three levels: severely/moderately deficient (< 20μg/dL), borderline (≥ 20μg/dL and<30μg/dL), and adequate (≥ 30μg/dL) (reference category).6
Anthropometric studyAnthropometric data were collected in the school environment by qualified evaluators and interviewers previously trained for data collection. Weight was measured with a microelectronic Marte scale, model PP 200-50 (Marte Balanças e Aparelhos de Precisão Ltda., São Paulo, Brazil), with capacity of 199.95kg and 50g precision. To measure height, a Leicester stadiometer (Height Measure, London, England) was used, graduated in tenths of centimeters. All measurements were performed following the procedures recommended by the anthropometric standardization reference manual.7
To evaluate the anthropometric status, the World Health Organization (WHO)8 tables were used as the standard reference based on percentile values of body mass index (BMI=weight [kg] / height[m]2) for age and gender. The WHO9 classification was used to define underweight (< 3rd percentile), normal weight (≥ 3rd percentile and<85th percentile), overweight (≥ 85th percentile and < 97th percentile), and obesity (≥ 97th percentile).
The student's age was obtained from the database of the State and Municipal Education Secretariats and confirmed by the date of birth in the birth certificate or identity card.
Food consumptionThe 24-hour recall method was used to determine food consumption. The calculation of the diet centesimal composition was made using the Virtual Nutri software, release 1.0, developed by the Department of Nutrition, School of Public Health of the Universidade de São Paulo (São Paulo, Brazil).10 Retinol intake was stratified according to tertiles: the 1st tertile was considered as the lower consumption. The other tertiles were characterized by higher consumption (reference category).
Demographic and socioeconomic variablesThe demographic variables were gender (male [reference category], female): and age (< 10 years, >10 years [reference category]):
The characteristics of environmental and housing conditions, socioeconomic status, and maternal schooling were collected through questionnaires answered by the students’ parents or guardians and applied by trained and qualified interviewers. The parents/guardians were invited to come to the school for interviews. Data on the characteristics of the household (ownership of residence, type of construction, predominant material of floor covering and the predominant construction material, and number of people per bedroom, among others) and sanitation conditions (water supply, garbage collection, sewage) were obtained for the creation of an appropriate index adapted from the model proposed by Issler and Giugliani.11
Every situation was assigned a score; the most favorable received a score of 0; the most unfavorable, a score of 1. The sum of these values characterized the indicator of environmental and living conditions. The index was classified into two strata, having as cutoff the median: adequate (score ≤ 4 [reference category]) and inadequate (score>4).
Data on maternal educational level were also collected. Two levels were considered according to the school grade the mother concluded: I < 5th grade; II>5th grade (reference category).
Statistical AnalysisThe Epi Info software, release 6.04 (Centers for Disease Control and Prevention, Atlanta, United States) was used for data processing and database creation using double data entry, after reviewing the questionnaires and correcting errors caused by the codification initially performed in the field.
Population characteristics were identified by descriptive analysis using prevalence for categorized data, and mean and standard deviation for continuous variables.
Serum retinol values categorized in three levels were used as the outcome: level of severe/moderate retinol deficiency (< 20μg/dL), borderline (≥ 20μg/dL and < 30μg/dL), and adequate (≥ 30μg/dL) (comparison category). The polytomous logistic regression technique was applied to assess factors associated with VAD. The strength of the associations was expressed as odds ratio (OR) and respective 95% confidence intervals (95% CI).
The analysis was initiated by performing the univariate polytomous logistic regression analysis to investigate the association of each of the covariates in outcome occurrence. Variables associated with VAD of 20% were selected for inclusion in the multivariate analysis. For selecting variables in the final model, the phasing procedure (backward) was adopted. In the adjusted model, only variables with p < 0.05 were included.
Variables associated with 20% VAD were selected for inclusion in the multivariate analysis. The backward procedure was used for the selection of variables in the final model. Only those variables with p<0.05 remained in the adjusted model.
Statistical analyses were adjusted for the complex sample design, by using the svy commands in Stata software, release 9.0 (Stata Corp, College Station, United States).
Ethical questionsThe study protocol was submitted to the Ethics Committee of the Instituto de Saúde Coletiva of the Universidade Federal da Bahia, which evaluated and approved its performance.
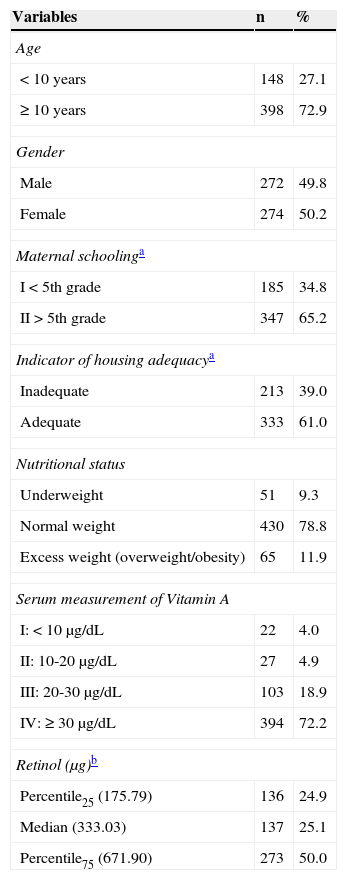
ResultsOf the total number of the initially selected students (600), 54 did not participate in the study (due to refusal, family moving to another city, or transfer of the student to another school), totaling 546 students aged 7 to 14 years, with a slightly higher percentage of females (50.2%). The other characteristics are shown in Table 1. Although the study population is originally from another study, no statistically significant difference was observed between the sociodemographic characteristics of the original sample and the subsample used in this study (data not shown).
Characteristics of the study population. Salvador, BA, Brazil, 2009.
| Variables | n | % |
|---|---|---|
| Age | ||
| < 10 years | 148 | 27.1 |
| ≥ 10 years | 398 | 72.9 |
| Gender | ||
| Male | 272 | 49.8 |
| Female | 274 | 50.2 |
| Maternal schoolinga | ||
| I < 5th grade | 185 | 34.8 |
| II>5th grade | 347 | 65.2 |
| Indicator of housing adequacya | ||
| Inadequate | 213 | 39.0 |
| Adequate | 333 | 61.0 |
| Nutritional status | ||
| Underweight | 51 | 9.3 |
| Normal weight | 430 | 78.8 |
| Excess weight (overweight/obesity) | 65 | 11.9 |
| Serum measurement of Vitamin A | ||
| I: < 10μg/dL | 22 | 4.0 |
| II: 10-20μg/dL | 27 | 4.9 |
| III: 20-30μg/dL | 103 | 18.9 |
| IV: ≥ 30μg/dL | 394 | 72.2 |
| Retinol (μg)b | ||
| Percentile25 (175.79) | 136 | 24.9 |
| Median (333.03) | 137 | 25.1 |
| Percentile75 (671.90) | 273 | 50.0 |
SD, standard deviation.
The frequency distribution of mean serum retinol values showed some degree of asymmetry; the deviation was more pronounced to the left, suggesting a high percentage of children and adolescents with low mean serum retinol levels (mean=39.6±19.25μg/dL). The prevalence of 27.8% of VAD (<30μg/dL) was observed among the schoolchildren and of these, 4.0% was characterized by severe (<10μg/dL), and 4.9% by moderate deficiency (≥ 10μg/dL and < 20μg/dL).
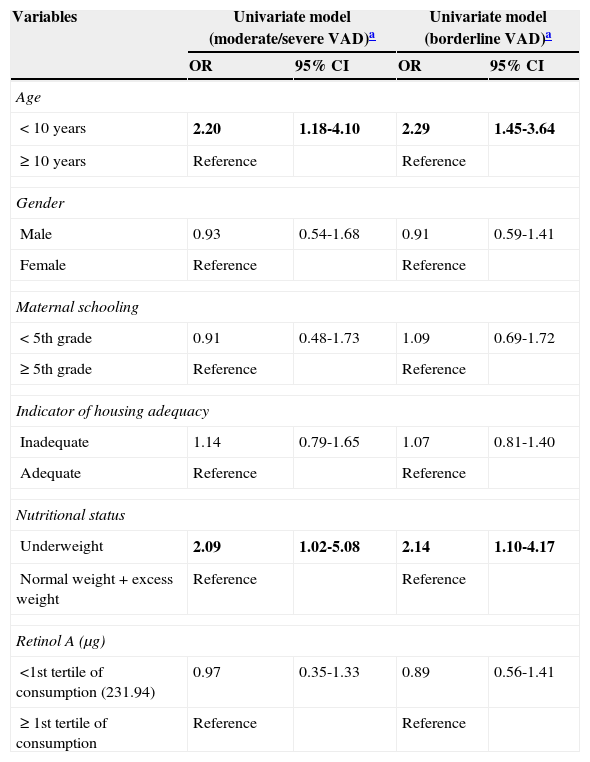
The univariate analysis showed a positive and statistically significant association between moderate severe VAD and age<10 years (OR=2.20, 95% CI: 1.18 to 4.10) and underweight (OR=2.09, 95% CI: 1.02 to 5.08). Moreover, borderline VAD was associated with age<10 years (OR=2.29, 95% CI: 1.45 to 3.64) and underweight (OR=2.14, 95% CI: 1.10 to 4.17). Regarding the other variables, no distinctive distribution was observed regarding serum retinol levels (Table 2).
ORraw and respective 95% confidence intervals (95% CI) of the association between vitamin A deficiency (VAD) and selected variables in children and adolescents from public schools in the city of Salvador, BA, Brazil, 2009.
| Variables | Univariate model (moderate/severe VAD)a | Univariate model (borderline VAD)a | ||
|---|---|---|---|---|
| OR | 95% CI | OR | 95% CI | |
| Age | ||||
| < 10 years | 2.20 | 1.18-4.10 | 2.29 | 1.45-3.64 |
| ≥ 10 years | Reference | Reference | ||
| Gender | ||||
| Male | 0.93 | 0.54-1.68 | 0.91 | 0.59-1.41 |
| Female | Reference | Reference | ||
| Maternal schooling | ||||
| < 5th grade | 0.91 | 0.48-1.73 | 1.09 | 0.69-1.72 |
| ≥ 5th grade | Reference | Reference | ||
| Indicator of housing adequacy | ||||
| Inadequate | 1.14 | 0.79-1.65 | 1.07 | 0.81-1.40 |
| Adequate | Reference | Reference | ||
| Nutritional status | ||||
| Underweight | 2.09 | 1.02-5.08 | 2.14 | 1.10-4.17 |
| Normal weight+excess weight | Reference | Reference | ||
| Retinol A (μg) | ||||
| <1st tertile of consumption (231.94) | 0.97 | 0.35-1.33 | 0.89 | 0.56-1.41 |
| ≥ 1st tertile of consumption | Reference | Reference | ||
OR, odds ratio.
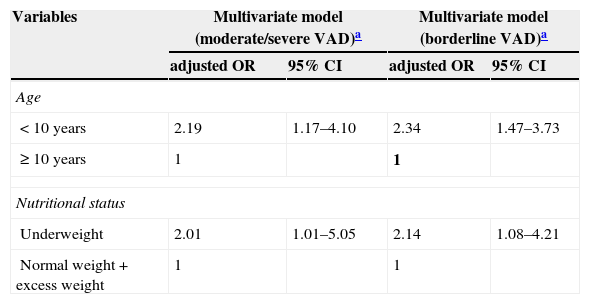
The multivariate analysis confirmed, after appropriate adjustments, a positive and statistically significant association between moderate/severe VAD (OR=2.19, 95% CI: 1.17 to 4.10) and borderline VAD (OR=2.34, 95% CI: 1.47 to 3.73) with age<10 years. There was also an association between moderate/severe (OR=2.01, 95% CI: 1.01 to 5.05) and borderline VAD (OR=2.14, 95% CI: 1.08 to 4.21) with underweight (Table 3).
ORadjusted and respective 95% confidence intervals (95% CI) of the association between vitamin A deficiency (VAD) and selected variables in children and adolescents from public schools in the city of Salvador, BA, Brazil, 2009.
| Variables | Multivariate model (moderate/severe VAD)a | Multivariate model (borderline VAD)a | ||
|---|---|---|---|---|
| adjusted OR | 95% CI | adjusted OR | 95% CI | |
| Age | ||||
| < 10 years | 2.19 | 1.17–4.10 | 2.34 | 1.47–3.73 |
| ≥ 10 years | 1 | 1 | ||
| Nutritional status | ||||
| Underweight | 2.01 | 1.01–5.05 | 2.14 | 1.08–4.21 |
| Normal weight+excess weight | 1 | 1 | ||
OR, odds ratio.
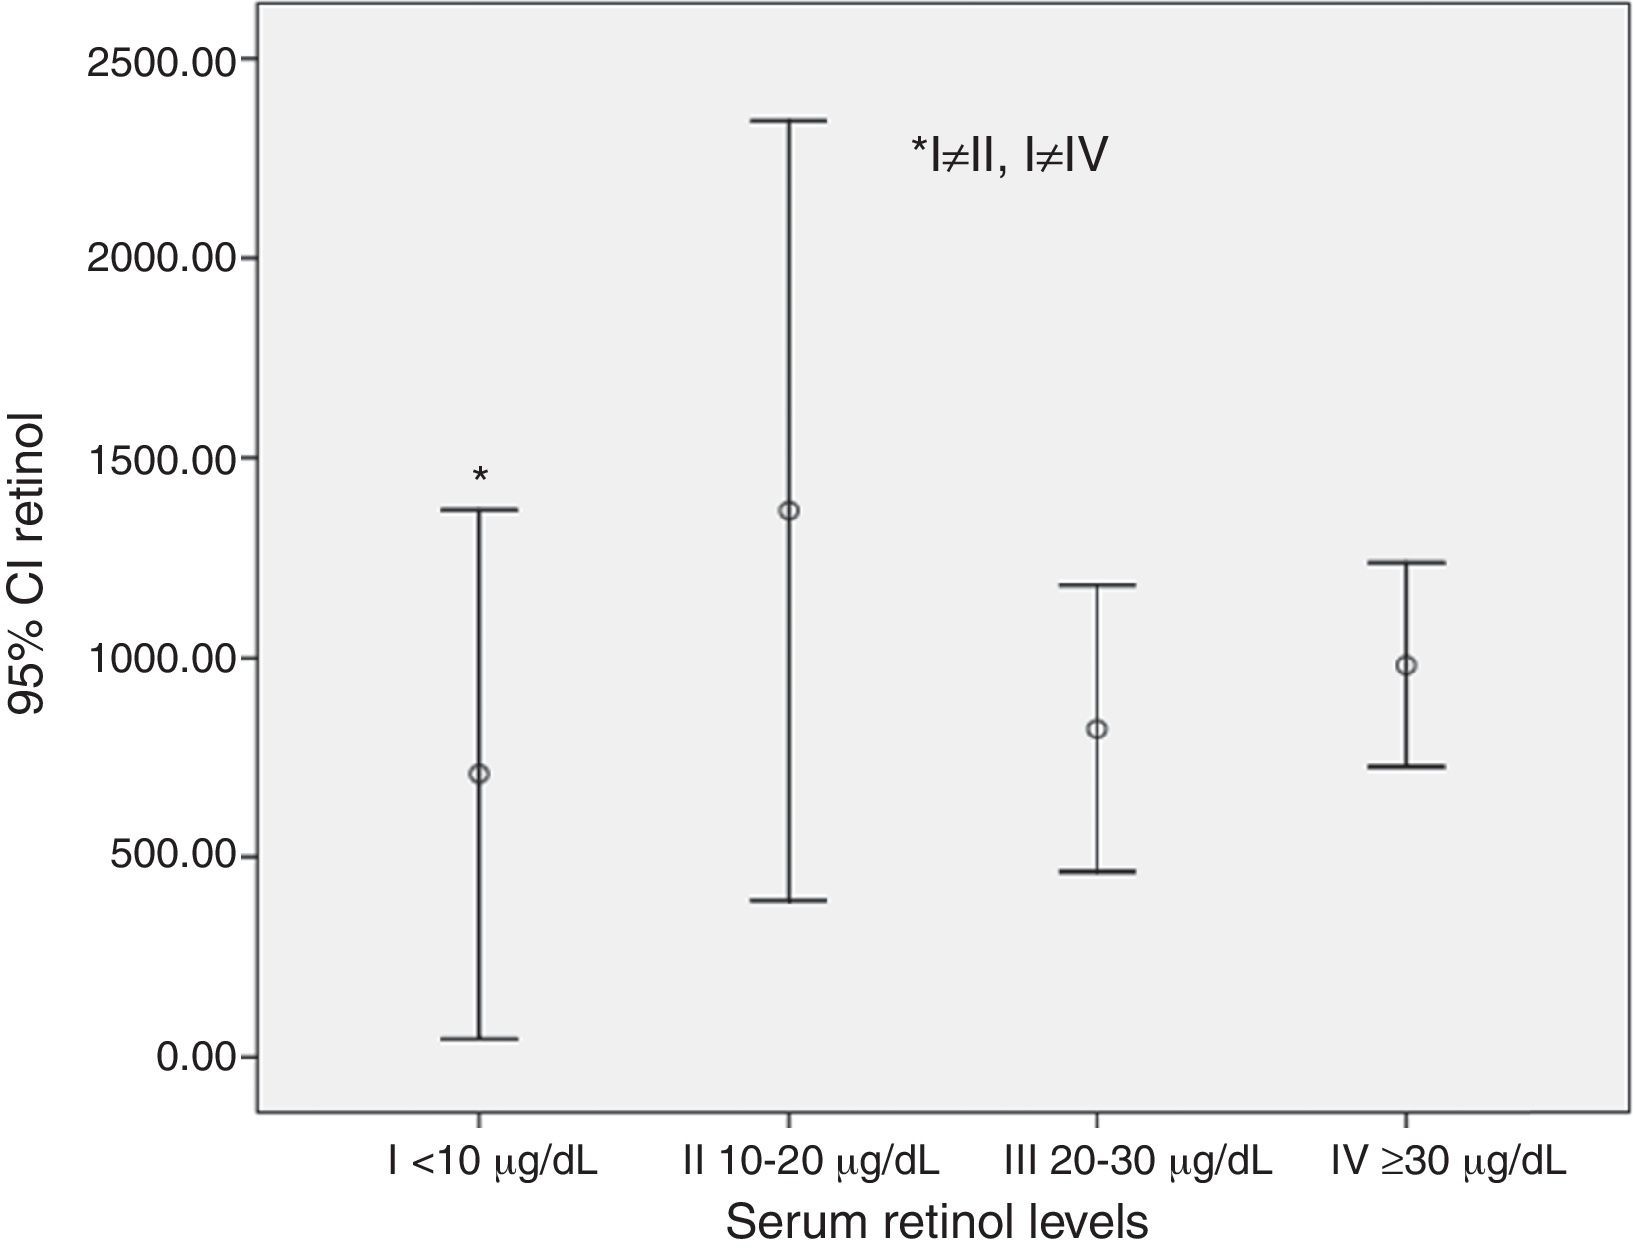
A lower retinol consumption value was detected among those with severe VAD (serum retinol levels<10μg/dL) (Fig. 1).
Discussion for the mean retinol level.")
The prevalence of low serum retinol levels (< 20μg/dL) was approximately 9.0% (95% CI: 6.5 to 11.3), characterizing VAD as a minor public health problem, according to the WHO criteria.1 This result is consistent with that observed by Gonçalves-Carvalho et al.12 (10.7%) in Campinas, SP, Brazil; and lower than that identified by Graebner et al.13 (33.55%) in Brasília, DF, Brazil. Conversely, 18.5% (95% CI: 15.23 to 21.19) of children and adolescents showed borderline levels (20-30μg/dL) of serum retinol.
Thus, 27.5% of students enrolled in public schools in Salvador, state of Bahia, Brazil, showed inadequate retinol levels (<30μg/dL); a higher percentage than that found by de Souza Valente da Silva et al.14 (10.0%) in a study conducted in Rio de Janeiro, RJ, Brazil. This is the cutoff (< 30μg/dL) that is being used with increasing frequency to define VAD in schoolchildren, including adolescents.3,6 It is noteworthy that this cutoff has been inter-validated with the therapeutic test (+ S30DR) and with RDR,15 in addition to showing an association with visual function alterations.16
The present study was performed to investigate factors associated with VAD. It was observed that underweight resulted in a 2.01-fold (95% CI: 1.01 to 5.05) greater chance of schoolchildren having moderate/severe VAD and 2.14-fold (95% CI: 1.08 to 4.21) greater chance of having borderline VAD.
These results corroborate those described in other studies,13,17,18 which is a justified association, as malnutrition makes the individual vulnerable to multiple nutritional deficiencies. It should be noted that although the prevalence of childhood malnutrition has declined globally over the past few decades, this reduction has occurred unevenly and the problem has persisted in some countries.19 It has been estimated that in Brazil, among school-age children, the described prevalence of malnutrition assessed by weight/height index, is approximately 6.8%, and among adolescents, assessed by BMI for age, is approximately 3.4%, varying according to income strata.20
It was also observed that schoolchildren aged<10 years presented a 2.19-fold greater chance of having moderate/severe VAD (95% CI: 1.17 to 4.10) and a 2.34-fold (95% CI: 1.47-3.73) greater chance of having borderline VAD. These results are consistent with those observed in other studies,21,22 suggesting greater vulnerability of younger schoolchildren. It is possible that this trend occurs due to physical growth, adverse effects of virus and bacterial infections, as well as parasitic infections common in this age group, or even due to the greater diversification of dietary pattern observed in older children. In agreement with the findings by Ramalho et al.,22 although the frequency of low serum retinol levels tends to decline with age, as observed in this study, it is still high enough to warrant attention to this population segment.
Although the low consumption of foods rich in vitamin A was not a complementary information in the explanatory VAD model, low retinol intake was verified among patients with severe VAD when consumption was compared to the other levels of deficiency. The perception of the influence of vitamin A intake on serum retinol levels has been shared by some studies.17,23
Inadequate dietary habits can greatly influence the onset of nutritional deficiencies, particularly in children and adolescents.24 Thus, at a time when an epidemic of overweight/obesity is emerging, there are still endemic nutritional deficiencies, such as VAD and anemia in several areas of the Brazil.25 Such picture is explained, in part, by the adoption of unhealthy eating habits, especially among younger individuals, which indicates the necessity of implementing public strategies to stop the advance of nutritional disorders and their complications in this life cycle.
It is important to emphasize that the main study limitation is its cross-sectional design, which affects the interpretation of results; its design allows only for the observation of associations between the studied events; it is not possible to demonstrate a cause and effect association between them. The present study, although consistent with its purpose, and having used a probabilistic sample of adequate size and internationally recommended laboratory techniques, has the limitation of lack of data regarding gastrointestinal and respiratory infections, which reduce the absorption and considerably increase the biological utilization and excretion of this micronutrient, regardless of liver reserve.1 Moreover, data were not obtained on clinical signs of VAD.26
Additionally, the 24-hour recall method used in this study to investigate food intake also has some limitations. The food intake investigation, in addition to being limited to data on vitamin A consumption, without information on the absorption and biological utilization, has received heavy criticism due to the extreme variability on the measurement of this vitamin from food sources, as well as the multiplicity of tables, often without adequate information on content of regional foods consumed by the target population. However, this method provides information on the estimated average intake of populations, even when applied only once, when the methodological assumptions are observed and analytical resources are appropriate.27 Thus, food consumption studies can provide important information, at an early stage, on the risk of nutritional deficiency, before the clinical form is established.
VAD is an important health problem in children and adolescents. A greater VAD vulnerability was observed in lower weight and younger children. The school has an important role in VAD prevention by promoting nutritional education, aimed particularly at risk groups.
FundingFundação de Amparo à Pesquisa do Estado da Bahia (Fapesb; process No. 1431040053551) and Conselho Nacional de Desenvolvimento Científico e Tecnológico (CNPq; process No. 402462/2005-0).
Conflicts of interestThe authors declare no conflicts of interest.
Please cite this article as: de Cássia Ribeiro-Silva R, Nunes IL, Assis AM. Prevalence and factors associated with vitamin A deficiency in children and adolescents. J Pediatr (Rio J). 2014;90:486–92.


