Augmented waist circumference (WC) is associated with non-communicable diseases and could represent a valuable marker in screening for metabolic dysfunctions in subjects with insufficient linear growth. The objective of the present study was to determine whether biochemical and hemodynamic parameters and waist circumference vary between mildly-stunted and non-stunted adolescents from impoverished communities of São Paulo, Brazil.
MethodsThe cross-sectional study involved 206 subjects, aged between 9 and 19 years and living in impoverished areas of São Paulo, Brazil. The sample population was divided according to height-for-age Z-score (HAZ) into stunted (-1 > HAZ ≥ -2) and non-stunted (HAZ ≥ -1) groups, and was sub-divided according to gender. Logistic regression analysis was employed to compare individuals with elevated (> 75th percentile) insulin concentrations. The receiver operating characteristic curves were constructed to determine WC cut-off points that could be used to identify stunted and non-stunted individuals with elevated insulin concentrations.
ResultsWC cut-off points of 58.25cm and 67.2cm allowed for correct classification of 90.7% of stunted and 88.7% of non-stunted individuals in the studied population. While the sensitivity of the model was high for stunted and non-stunted subjects (98.8% and 97.2%, respectively), the specificity was modest (57.1% and 41.2%, respectively).
ConclusionThe results presented herein suggest that an increase in plasma insulin is one of the primary metabolic modifications in stunted individuals, and that this alteration could be identified at a lower WC cut-off point than in non-stunted counterparts.
A circunferência da cintura (CC) aumentada está relacionada a doenças não transmissíveis e pode representar um indicador valioso no exame de verificação de disfunções metabólicas em indivíduos com crescimento linear insuficiente. O objetivo deste estudo foi determinar se os parâmetros bioquímicos e hemodinâmicos e a circunferência da cintura variam entre adolescentes de baixa estatura leve e de estatura normal de comunidades pobres de São Paulo, Brasil.
MétodosO estudo transversal envolveu 206 indivíduos com idades entre 9 e 19 anos que moram em áreas pobres de São Paulo, Brasil. A população da amostra foi dividida, de acordo com o escore z de estatura por idade (HAZ), em um grupo de baixa estatura (-1 > HAZ ≥ -2) e um de estatura normal (HAZ ≥ -1), e subdividida de acordo com o gênero. A análise de regressão logística foi empregada para comparar indivíduos com concentrações elevadas de insulina (> 75° percentil). As curvas de característica de operação do receptor foram construídas para determinar os pontos de corte de CC que poderiam ser usados para identificar os indivíduos de baixa estatura e de estatura normal com concentrações elevadas de insulina.
ResultadosOs pontos de corte de CC de 58,25 e 67,2cm permitiram a classificação correta de 90,7% de indivíduos de baixa estatura e 88,7% de indivíduos de estatura normal na população estudada. Embora a sensibilidade do modelo fosse alta para indivíduos de baixa estatura e de estatura normal (98,8% e 97,2%, respectivamente), a especificidade foi pequena (57,1% e 41,2%, respectivamente).
ConclusãoOs resultados apresentados neste instrumento sugerem que um aumento na insulina plasmática é uma das principais modificações metabólicas em indivíduos de baixa estatura, e que essa alteração pode ser identificada em um ponto de corte de CC menor que em pares de estatura normal.
Irrespective of birth weight, children and adolescents with moderate/severe stunting are more prone to increased body fat (especially abdominal fat),1–4 diminished rate of fat oxidation,5 reduced resting and postprandial energy expenditure,1 higher systolic and diastolic arterial pressure (SAP and DAP, respectively),6–8 and lower production of insulin by the pancreas.9,10 Alterations in these parameters are also aggravated by the presence of obesity.5 A recent study on pre-adolescents and adolescents with mild stunting (-2 < HAZ < -1) showed similar increase in SAP in comparison with their non-stunted peers.11
In addition, overweight adolescents with mild stunting presented significantly higher concentrations of plasma insulin, elevated glycemia, increased insulin resistance, and diminished pancreatic production of insulin in comparison with individuals of normal body mass index (BMI).12 In these subjects, abdominal fat and waist circumference (WC) values were significantly higher in the mildly-stunted group than in the non-stunted control group.13 It is evident from these findings that individuals with mild stunting present physiological alterations that are very similar to those described earlier for individuals with moderate or severe stunting.
It is widely accepted that elevated WC values are strongly associated with increased risk of non-communicable diseases (NCDs).14–16 The objective of the present study was to analyze physiological alterations, including SAP and DAP levels and concentrations of glucose, insulin, high- and low-density lipoprotein cholesterol (HDL-C and LDL-C, respectively), and triglycerides, in relation to the WC values of children and adolescents with mild stunting compared with their non-stunted counterparts.
Subjects and methodsThe study was submitted to and approved by the Committee of Ethics in Research of the Universidade Federal de São Paulo (No. 0284/08). Written informed consent was obtained from all participants, or their parents or legal guardians where appropriate, prior to the commencement of the study.
This cross-sectional study involved 206 subjects (9 to 19 years of age) who were attending schools or other institutions located in impoverished areas of the southern area of the city of São Paulo. Since the purpose of the study was to detect early changes caused by mild stunting, the sample population was divided into two groups according to HAZ, namely, stunted (HAZ < -1 and ≥ -2) and non-stunted (HAZ ≥ -1) with standard reference values based on the Centers for Disease Control and Prevention (CDC) 2000 growth charts for the United States for children and adolescents.17
This study is part of a larger health survey that investigated pre-adolescents and adolescents with stunting, conducted in the city of São Paulo, with approximately 400 individuals. The sample size of this study was calculated using odds ratio (OR), with significance α level of 0.05, power of 0.80, and a sampling ratio of 1:1 between those exposed and unexposed to the predictor. An OR in the source population equal to 2.5 and an expected frequency of stature equal to 0.08 among the unexposed population were assumed. Due to high costs and difficulty of obtaining blood samples, it was considered that a sample of approximately 50% of the survey population was sufficient to test the hypothesis of the study. The maximum acceptable beta error was 0.20. Subjects were selected for the study according to their nutritional status.
Prior to the commencement of the study, participants underwent clinical examinations, as well as blood, urine, and parasitological tests. Individuals diagnosed with genetic and neurological syndromes, dementia, or cardiovascular, respiratory, or metabolic disorders were excluded from the study, as were those using anti-inflammatory medications and those with physical limitations. Subjects presenting infectious or parasitic diseases were treated according to normal protocols and subsequently included in the study.
Socioeconomic and environmental data were obtained from parents or legal guardians by application of a specific questionnaire. The weight of each participant (wearing light clothes and without shoes) was obtained by single measurement using a Country Technologies model SD-150 platform scale (Gays Mills, WI, USA) with a capacity of 150kg and an accuracy of 100g. Stature was assessed using an AlturExata (TBW, São Paulo, Brazil) portable stadiometer with a precision of 0.1cm. BMI values were calculated as weight (kg)/height squared (m2). For the determination of waist circumference, subjects were placed in a standing position with the abdomen and arms relaxed alongside the body, and a flexible measuring tape (1mm accuracy) was held horizontally at the midpoint between the bottom edge of the last rib and the iliac crest. The waist circumference deciles were calculated for the entire population and compared to the values of stature (cm).
Blood pressure was measured using a standard clinical sphygmomanometer. Subjects were seated and allowed to rest for 10min, following by three pressure measurements conducted at 5min intervals. SAP was determined at the onset of the first Korotkoff sound, while DAP was determined after the disappearance of the fifth Korotkoff sound.18 Fasting plasma glucose concentrations were determined by a Beckman Coulter UniCell DXI 800 (CA, USA) spectrophotometer, while specific insulin (without C peptide) levels were assessed using an enzyme assay and a Medcorp Advia 2400/Kovalent (RN, Brazil) analyzer. Serum levels of total cholesterol, LDL-C, HDL-C, and triglycerides were measured using an Advia 2400/Kovalent analyzer. Elevated concentrations were considered those above the 75th percentile of the studied population.
Calculations of nutritional status were performed using Epi-Info 2000 (Centers for Disease Control, GA, USA) software. Participants were distributed by BMI-for-age percentiles according to standard reference values of the US Centers for Disease Control and Prevention 2000 growth charts.17
All participants were examined by a trained physician and classified regarding gender development in accordance with the recommendations of Tanner.19 Individuals who had reached breast-stage 2 for females and genitalia-stage 3 for males according to WHO cut-off points were considered pubertal.20 Statistical analyses were performed using PASW Statistics version 19 (SPSS Inc., Chicago, IL, USA) with the level of statistical significance set at p<0.05. Mean values of age, height, weight, HAZ, BMI, and WC of the stunted and non-stunted groups, stratified according to gender, were compared using the Student's t-test, and assumptions of homoscedasticity were verified using the Levene test. Analysis of covariance (ANCOVA) was used to establish significant differences in plasma insulin, total cholesterol, HDL-C, LDL-C, triglycerides, SAP, and DAP values (adjusted according to age and weight) between the stunted and non-stunted groups.
Logistic regression analysis (forward LR method) was employed to compare individuals with elevated insulin concentrations (> 75th percentile) using the Wald test to determine which factors should be employed as predictor variables in the final model. Pubertal stage, gender, and WC were defined as independent variables in the regression model. A receiver operating characteristic (ROC) curve was constructed in order to establish WC cut-off points for individuals in the stunted and non-stunted groups that could be used to predict insulin concentrations above the 75th percentile.
ResultsThe study population comprised 206 children and adolescents (53.5% males and 46.5% females), most of whom (74.8%) were classified as pre-pubertal. The families of the majority of the participants were considered poor, with an average of 6.0±3.6 individuals per household and a monthly family income of US$ 484±328, which is equivalent to a daily per capita income of approximately US$ 4±2.7. The prevalence of illiteracy was higher among mothers (10.6%) than fathers (5.6%), and 10% of the dwellings were inadequate shacks constructed of wood or a mix of wood and brick.
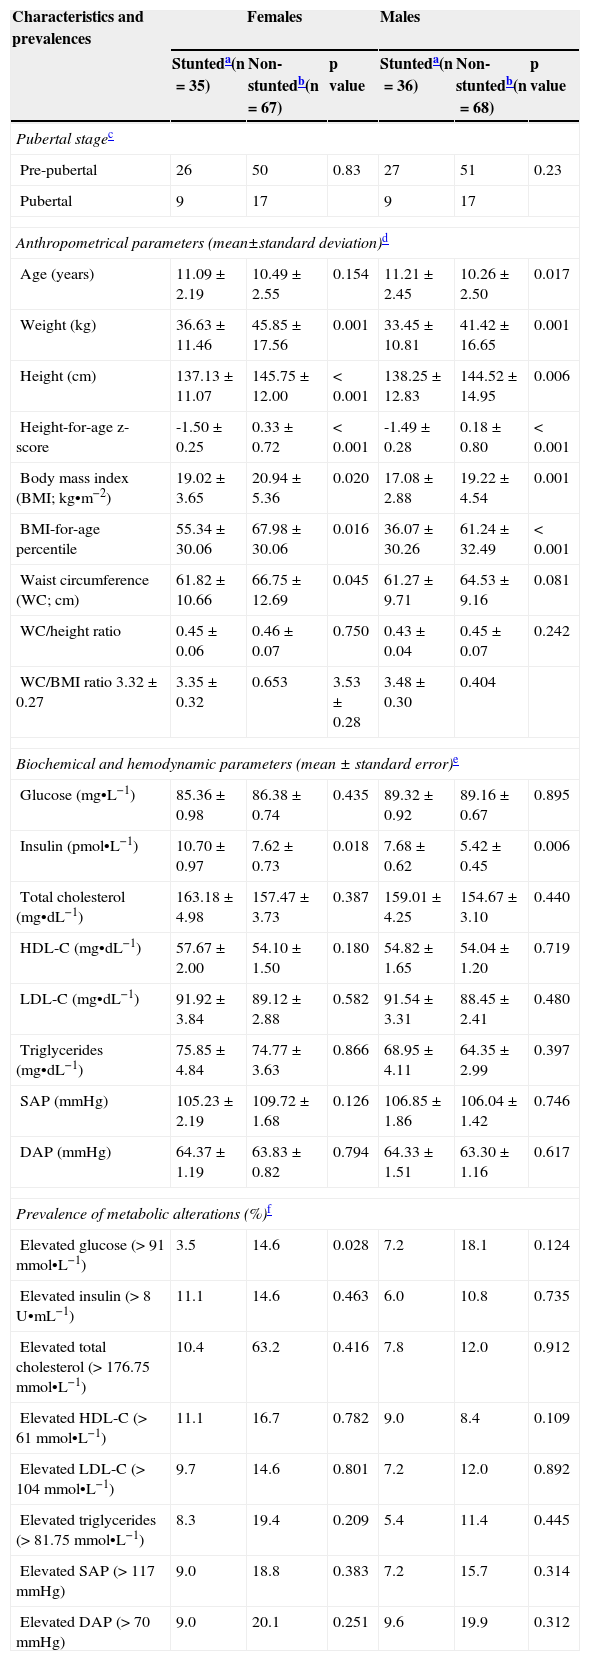
The mean values of weight, height, BMI, and BMI-for-age percentiles of stunted males and females were significantly lower, and the average ages significantly higher, than those of corresponding non-stunted individuals (Table 1). No significant differences were observed in pubertal stages between stunted and non-stunted groups. The mean WC value for non-stunted females was significantly greater than that for stunted females, but there was no significant difference between the two groups with respect to the WC/height ratio and WC/BMI ratio. Insulin concentrations were significantly higher in stunted males and females in comparison with their non-stunted counterparts, but the prevalences of elevated (> 75th percentile) plasma insulin concentrations were similar in all groups. The prevalences of elevated (> 75th percentile) total serum cholesterol, HDL-C, LDL-C, triglycerides, SAP, and DAP within the stunted and non-stunted groups of both genders were similar. There was a significantly higher prevalence of increased plasma glucose among non-stunted females in comparison with their stunted counterparts.
Anthropometrical and biochemical characteristics of the studied population and prevalences of metabolic alterations observed.
| Characteristics and prevalences | Females | Males | ||||
|---|---|---|---|---|---|---|
| Stunteda(n=35) | Non-stuntedb(n=67) | p value | Stunteda(n=36) | Non-stuntedb(n=68) | p value | |
| Pubertal stagec | ||||||
| Pre-pubertal | 26 | 50 | 0.83 | 27 | 51 | 0.23 |
| Pubertal | 9 | 17 | 9 | 17 | ||
| Anthropometrical parameters (mean±standard deviation)d | ||||||
| Age (years) | 11.09±2.19 | 10.49±2.55 | 0.154 | 11.21±2.45 | 10.26±2.50 | 0.017 |
| Weight (kg) | 36.63±11.46 | 45.85±17.56 | 0.001 | 33.45±10.81 | 41.42±16.65 | 0.001 |
| Height (cm) | 137.13±11.07 | 145.75±12.00 | < 0.001 | 138.25±12.83 | 144.52±14.95 | 0.006 |
| Height-for-age z-score | -1.50±0.25 | 0.33±0.72 | < 0.001 | -1.49±0.28 | 0.18±0.80 | < 0.001 |
| Body mass index (BMI; kg•m−2) | 19.02±3.65 | 20.94±5.36 | 0.020 | 17.08±2.88 | 19.22±4.54 | 0.001 |
| BMI-for-age percentile | 55.34±30.06 | 67.98±30.06 | 0.016 | 36.07±30.26 | 61.24±32.49 | < 0.001 |
| Waist circumference (WC; cm) | 61.82±10.66 | 66.75±12.69 | 0.045 | 61.27±9.71 | 64.53±9.16 | 0.081 |
| WC/height ratio | 0.45±0.06 | 0.46±0.07 | 0.750 | 0.43±0.04 | 0.45±0.07 | 0.242 |
| WC/BMI ratio 3.32±0.27 | 3.35±0.32 | 0.653 | 3.53±0.28 | 3.48±0.30 | 0.404 | |
| Biochemical and hemodynamic parameters (mean±standard error)e | ||||||
| Glucose (mg•L−1) | 85.36±0.98 | 86.38±0.74 | 0.435 | 89.32±0.92 | 89.16±0.67 | 0.895 |
| Insulin (pmol•L−1) | 10.70±0.97 | 7.62±0.73 | 0.018 | 7.68±0.62 | 5.42±0.45 | 0.006 |
| Total cholesterol (mg•dL−1) | 163.18±4.98 | 157.47±3.73 | 0.387 | 159.01±4.25 | 154.67±3.10 | 0.440 |
| HDL-C (mg•dL−1) | 57.67±2.00 | 54.10±1.50 | 0.180 | 54.82±1.65 | 54.04±1.20 | 0.719 |
| LDL-C (mg•dL−1) | 91.92±3.84 | 89.12±2.88 | 0.582 | 91.54±3.31 | 88.45±2.41 | 0.480 |
| Triglycerides (mg•dL−1) | 75.85±4.84 | 74.77±3.63 | 0.866 | 68.95±4.11 | 64.35±2.99 | 0.397 |
| SAP (mmHg) | 105.23±2.19 | 109.72±1.68 | 0.126 | 106.85±1.86 | 106.04±1.42 | 0.746 |
| DAP (mmHg) | 64.37±1.19 | 63.83±0.82 | 0.794 | 64.33±1.51 | 63.30±1.16 | 0.617 |
| Prevalence of metabolic alterations (%)f | ||||||
| Elevated glucose (> 91 mmol•L−1) | 3.5 | 14.6 | 0.028 | 7.2 | 18.1 | 0.124 |
| Elevated insulin (> 8 U•mL−1) | 11.1 | 14.6 | 0.463 | 6.0 | 10.8 | 0.735 |
| Elevated total cholesterol (> 176.75 mmol•L−1) | 10.4 | 63.2 | 0.416 | 7.8 | 12.0 | 0.912 |
| Elevated HDL-C (> 61 mmol•L−1) | 11.1 | 16.7 | 0.782 | 9.0 | 8.4 | 0.109 |
| Elevated LDL-C (> 104 mmol•L−1) | 9.7 | 14.6 | 0.801 | 7.2 | 12.0 | 0.892 |
| Elevated triglycerides (> 81.75 mmol•L−1) | 8.3 | 19.4 | 0.209 | 5.4 | 11.4 | 0.445 |
| Elevated SAP (> 117 mmHg) | 9.0 | 18.8 | 0.383 | 7.2 | 15.7 | 0.314 |
| Elevated DAP (> 70 mmHg) | 9.0 | 20.1 | 0.251 | 9.6 | 19.9 | 0.312 |
HDL-C, high-density lipoprotein cholesterol; LDL-C, low-density lipoprotein cholesterol; SAP, systolic arterial pressure; DAP, diastolic arterial pressure.
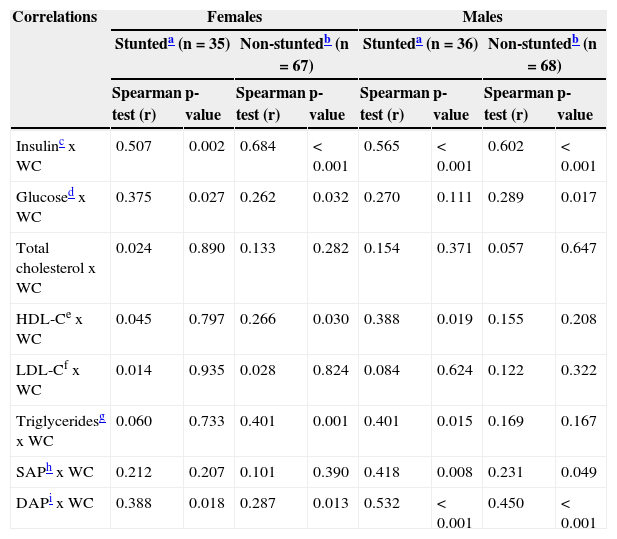
There were significant positive correlations between WC and the variables insulin, glucose, and DAP for stunted and non-stunted females, and between WC and the variables HDL-C and triglycerides for non-stunted females (Table 2). Significant positive correlations were also observed between WC and the variables insulin, SAP, and DAP for stunted and non-stunted males, whereas WC was correlated with glucose for males only.
Correlations between waist circumference (WC), and biochemical and hemodynamic parameters.
| Correlations | Females | Males | ||||||
|---|---|---|---|---|---|---|---|---|
| Stunteda (n=35) | Non-stuntedb (n=67) | Stunteda (n=36) | Non-stuntedb (n=68) | |||||
| Spearman test (r) | p-value | Spearman test (r) | p-value | Spearman test (r) | p-value | Spearman test (r) | p-value | |
| Insulinc x WC | 0.507 | 0.002 | 0.684 | < 0.001 | 0.565 | < 0.001 | 0.602 | < 0.001 |
| Glucosed x WC | 0.375 | 0.027 | 0.262 | 0.032 | 0.270 | 0.111 | 0.289 | 0.017 |
| Total cholesterol x WC | 0.024 | 0.890 | 0.133 | 0.282 | 0.154 | 0.371 | 0.057 | 0.647 |
| HDL-Ce x WC | 0.045 | 0.797 | 0.266 | 0.030 | 0.388 | 0.019 | 0.155 | 0.208 |
| LDL-Cf x WC | 0.014 | 0.935 | 0.028 | 0.824 | 0.084 | 0.624 | 0.122 | 0.322 |
| Triglyceridesg x WC | 0.060 | 0.733 | 0.401 | 0.001 | 0.401 | 0.015 | 0.169 | 0.167 |
| SAPh x WC | 0.212 | 0.207 | 0.101 | 0.390 | 0.418 | 0.008 | 0.231 | 0.049 |
| DAPi x WC | 0.388 | 0.018 | 0.287 | 0.013 | 0.532 | < 0.001 | 0.450 | < 0.001 |
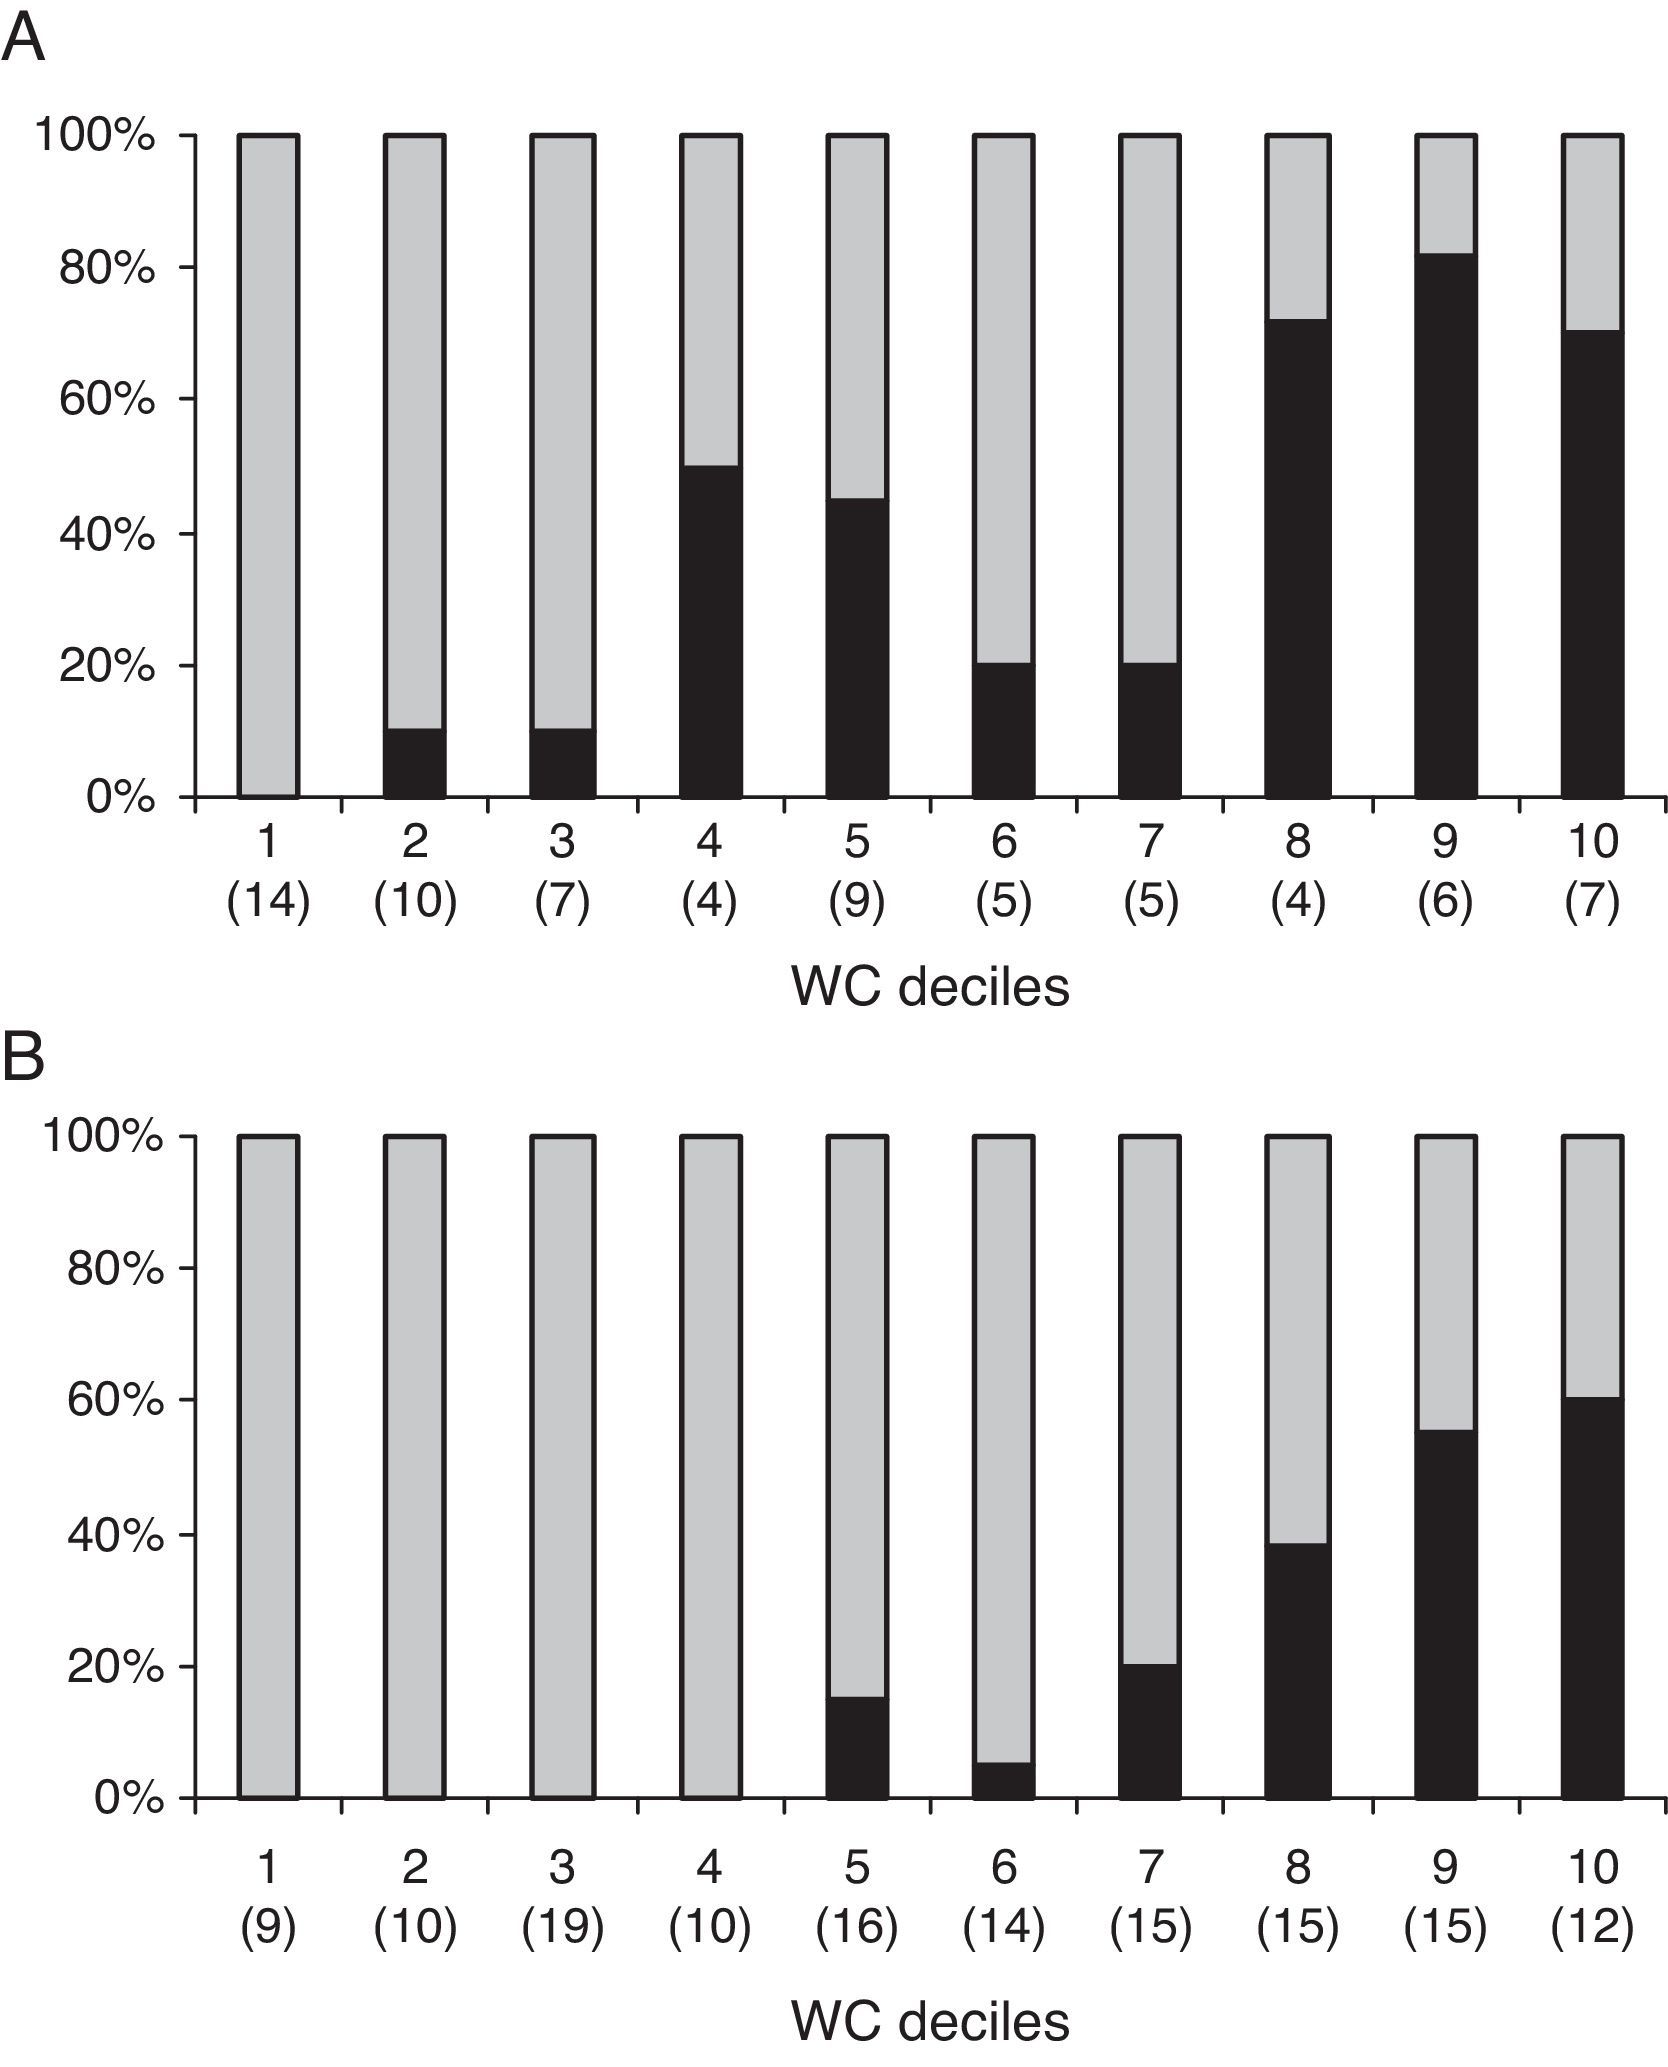
Fig. 1 shows the prevalences of elevated (> 75th percentile) insulin concentrations in stunted (A) and non-stunted (B) individuals distributed according to WC deciles. Within the stunted group, elevated insulin concentrations were observed with prevalences of 10% and higher from the second WC decile onwards, while in the non-stunted group, increases in insulin concentrations could only be detected from the fifth WC decile onwards. Approximately 70% to 80% of stunted individuals showed raised insulin concentrations from the eighth WC decile and above. In contrast, the prevalence of elevated insulin concentrations among non-stunted individuals reached a maximum of 60% only in the tenth WC decile.
 and non-stunted (B) individuals according to waist circumference (WC) deciles and their respective prevalences of elevated insulin concentrations: (■) > 75th percentile; (■)≤75th percentile. The WC deciles correspond to the following absolute values of stature of studied population: 1) 53 cm; 2) 55.90 cm; 3) 57.50 cm; 4) 59.50 cm; 5) 62 cm; 6) 65 cm; 7) 68 cm; 8) 71 cm; 9) 76.74cm. The numbers between parentheses represent the number of individuals of the sample in each decile of WC.")
Distribution of stunted (A) and non-stunted (B) individuals according to waist circumference (WC) deciles and their respective prevalences of elevated insulin concentrations: (■) > 75th percentile; (■)≤75th percentile. The WC deciles correspond to the following absolute values of stature of studied population: 1) 53 cm; 2) 55.90 cm; 3) 57.50 cm; 4) 59.50 cm; 5) 62 cm; 6) 65 cm; 7) 68 cm; 8) 71 cm; 9) 76.74cm.
The numbers between parentheses represent the number of individuals of the sample in each decile of WC.
In the logistic regression analysis, the predictor-dependent variable was represented by elevated insulin level, while the independent variables were gender, stage of pubertal development, and WC. According to the regression model, the first two independent variables mentioned had no influence on the likelihood of presenting elevated insulin concentrations, as indicated by p values for the stunted and non-stunted groups of 0.518 and 0.491, respectively, for gender; and of 0.541 and 0.752, respectively, for the pubertal stage. In contrast, the variable WC was significantly associated with elevated insulin concentrations in both groups (stunted group - B=0.271, X2Wald (1)=6.239, p=0.012; non-stunted group - B=0.119, X2Wald (1)=14.386, p<0.001). Thus, the risk of stunted and non-stunted individuals presenting elevated insulin concentrations was raised by 31.1% and 12.7%, respectively, for each additional increase in WC of 1cm.
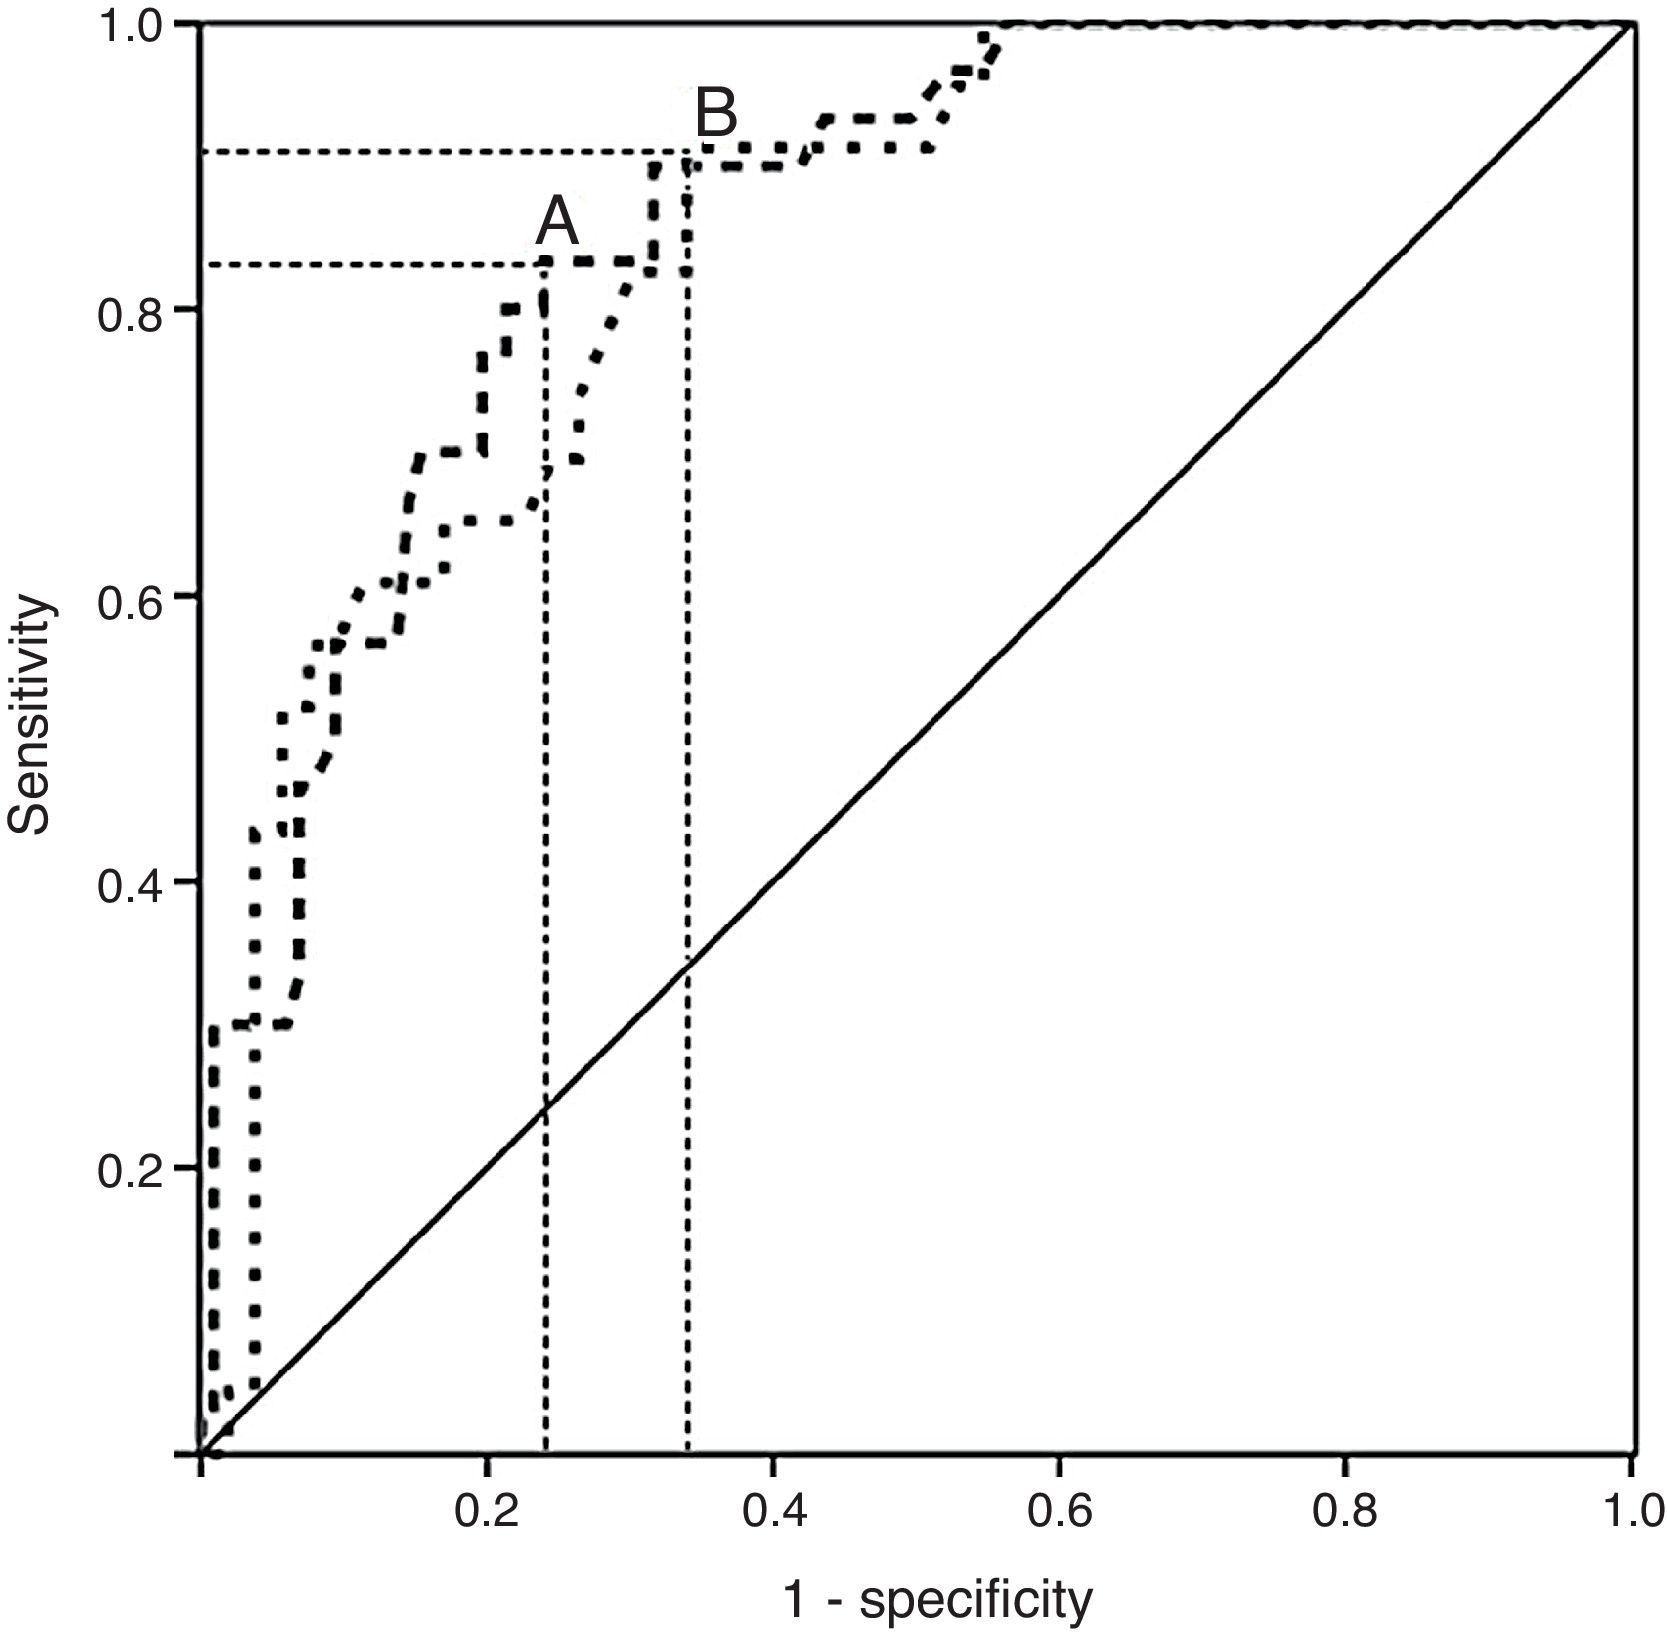
Analysis of the ROC curves revealed cut-off points of 58.25cm for stunted individuals and 67.20cm for non-stunted subjects (Fig. 2). Since the area under the ROC curve for the stunted group was 84.2 (p=0.001) and that for non-stunted group was 85.9% (p<0.001), the difference between the respective WC cut-off points was statistically significant.
 curve for the identification of metabolic alterations based on the waist circumference (WC) of non-stunted (---) and stunted (····) children and adolescents. The area under the ROC curve of the non-stunted group was 0.85 (95% CI=0.79–0.92), while that of the stunted group was 0.84 (95% CI=0.75–0.93). The WC cut-off point for the non-stunted group was 67.2cm (A), while that for the stunted group was 58.25cm (B).")
Receiver-operating characteristic (ROC) curve for the identification of metabolic alterations based on the waist circumference (WC) of non-stunted (---) and stunted (····) children and adolescents. The area under the ROC curve of the non-stunted group was 0.85 (95% CI=0.79–0.92), while that of the stunted group was 0.84 (95% CI=0.75–0.93). The WC cut-off point for the non-stunted group was 67.2cm (A), while that for the stunted group was 58.25cm (B).
According to recent recommendations,21 children and adolescents with WAZ and HAZ in the range of -2 to -1, who were previously classified as “mildly undernourished”,22 are now included in the group presenting “normal nutritional status”. It is likely that earlier concerns about mild undernutrition, which formed the basis of previous studies, have somewhat diminished due to a worldwide decline in the prevalence of undernutrition accompanied by an alarming increase in obesity among the younger segment of the population. However, the application of specific and sensitive cut-off points represents a simple tool for screening nutritional risk and for monitoring vulnerable children and adolescents in order to ensure their long-term health.
The present results are in line with previous studies.11–13 They confirm the original hypothesis that individuals with mild stunting show metabolic alterations similar to moderately or severely undernourished individuals. They have more fat in the trunk, as described previously, compared to moderately/severely stunted adolescents.3
It is well known that individuals with increased abdominal fat are more susceptible to metabolic dysfunctions, and that such alterations develop during childhood.15,16,23 On this basis, the identification of threshold values for WC in children and adolescents is a crucial component in developing a strategy for the prevention of NCDs in subjects with insufficient linear growth, and most particularly in developing countries where the prevalence of stunting is high.24 A few studies, however, have focused on body composition, and abdominal adiposity in adolescents with poor linear growth, and the possible association with risk of metabolic alterations.3,13 The use of such marker in clinical practice would be very valuable, since anthropometrical measurements are inexpensive and straightforward. The implementation of preventive measures among vulnerable populations would ensure a better quality of life and would serve to minimize future spending by health care systems. For this reason, the present study examined the hypothesis that, in comparison with their non-stunted counterparts, subjects with mild stunting would be at risk of NCDs at a lower WC value. In support of this hypothesis, these results revealed that individuals with mild stunting presented elevated insulin concentration at lower WC values compared with non-stunted subjects.
No differences were observed between stunted and non-stunted pubertal stages. The mean values of weight, height, and BMI of stunted subjects were lower than those of the non-stunted group, although the WC/height and WC/BMI ratios were similar in both groups, independent of gender. Insulin concentrations of stunted males and females were higher in comparison with those of their non-stunted counterparts and, when groups were distributed according to WC deciles, a higher prevalence of elevated insulin concentrations (> 75th percentile) was observed within the stunted group. In confirmation of earlier reports,14,16,23 it was shown that WC measurements provide a simple and appropriate marker of elevated insulin concentrations among stunted children and adolescents. The 75th percentile cut-off for increased insulin was chosen in order to identify early alterations in hormone concentrations, since this variable showed the best association with WC in groups based on stature and gender.
Two criteria were employed in establishing WC cut-off points in the study population: the highest sensitivity and specificity, and the shortest distance in the ROC curve. The WC cut-off points identified (58.25cm for the stunted group and 67.20cm for the non-stunted group) were based on the most appropriate combination of the two criteria, and allowed the correct classification of 90.7% of stunted individuals and 88.7% of the non-stunted group. The statistical power of the adjusted model employed was excellent, as demonstrated by the high sensitivity values obtained for the stunted and non-stunted groups (98.8% and 97.2%, respectively). In contrast, the specificity of the adjusted model was only modest, i.e., 57.1% for the stunted group and 41.2% for the non-stunted group.
In conclusion, it was determined that the WC cut-off point for the prediction of metabolic alterations in children and adolescents with mild stunting was smaller compared with non-stunted counterparts. The results also suggest that an increase in plasma insulin is one of the primary metabolic deviations that occur in stunted individuals. Special attention must be provided to individuals with mild stunting.
FundingThe present study was upported by Fundação de Amparo a Pesquisa do Estado de São Paulo (FAPESP; Proc. 06/56218-0).
Conflicts of interestThe authors declare no conflicts of interest.
The authors thank the Fundação de Amparo a Pesquisa do Estado de São Paulo (FAPESP; Proc. 06/56218-0) for financial support.
Please cite this article as: Clemente AP, Santos CD, Martins VJ, Albuquerque MP, Fachim MB, Sawaya AL. Lower waist circumference in mildly-stunted adolescents is associated with elevated insulin concentration. J Pediatr (Rio J). 2014;90:479–85.


