To explore the relationship of undernutrition and the short duration of breastfeeding with child development of children 0–66 months of age residing in Ceará, Brazil.
MethodsThe authors of the present study utilized population-based data from children enrolled in the Study on Maternal and Child Health in Ceará, Brazil (PESMIC). Children's development was assessed with the Ages and Stages Questionnaire third version, validated in Brazil. Undernutrition was accessed through anthropometric measures obtained by trained staff. Breastfeeding information was obtained through the mothers' report and confirmed in the child's governmental booklet. The authors used logistic regressions adjusted for sample clusters used in PESMIC design in a theoretical model for known determinants of child development following the World Health Organization nurturing framework.
ResultsA total of 3,566 children were enrolled in the sixth PESMIC study and had their development assessed. The authors found that 8.2%, 3.0%, 2.1%, and 3.6% of children were stunted, underweight, or wasted, at the time of the interview, respectively. All studied factors were associated with a higher prevalence of child development impairment in at least one of the assessed domains. Underweight was the factor with the strongest effect, with an adjusted odds ratio (AOR) of 4,14 (2,26–7,58), p < 0.001. Breastfeeding for up to two months compared to more than six months (AOR 2,08 (1,38–3,12)) was also associated.
ConclusionsThe authors found that undernutrition and short duration of breastfeeding are associated with development outcomes among Brazilian children. As a result, integrated nutritional programs may improve child development outcomes.
According to United Nations Children's Fund (UNICEF) data, 21.3% of children under the age of five in the world had undernutrition in 2019, which represents 144 million individuals.1 The latest data available for Brazil reported a prevalence of 6.95% of stunting in 2007.1 Undernutrition has been identified to be negatively associated with child development, while other studies have shown that nutritional interventions, especially in locations where undernutrition is endemic, have a positive effect on child development.2–5 Among the three main World Health Organization (WHO) child growth standards (length/height-for-age, weight-for-age, weight-for-length, weight-for-height), child linear growth (crude height or height-for-age z) score [HAZ]) is the one with the greatest amount of evidence on the negative impact on child development.6 Chronic malnutrition, expressed by this indicator, has been associated in recent decades with impaired neuronal growth and poor development of brain connections.7 The effect of acute malnutrition, however, is much less studied, having a different explanatory model for its impact on child development.4
More than 250 million children under the age of 5 years in low- and middle-income countries (LMICs) may not reach their full developmental potential, as estimated in 2015.8 Children's development is an essential determinant of later life educational performance and human capital outcomes.9–11 Therefore, factors that impair child development can have effects on the individual across the life course and may jeopardize development at the population level in LMICs. World Health Organization (WHO) stated that childhood stunting is one of the most important impediments to human development.12
The World Health Organization's Nurturing Care Framework for Early Childhood Development and literature report multiple factors to be associated with suboptimal development, including poverty, low maternal education, toxic stress exposure, low birth weight, poor child growth, and suboptimal breastfeeding, besides inadequate nutrition.4,13–16 However, few large, population-based studies have examined the relationship of nutritional risk factors with child development outcomes, particularly in the context of rough climates regions such as Ceará and studies that evaluated the effect of undernutrition on the development of Brazilian children under 5 years of age are exceedingly rare. Although the prevalence of child undernutrition has dramatically declined, in Semiarid climatic regions as Ceará, it may have persisted, as this type of climate has been associated in different parts of the world with an increased risk of food insecurity, which in turn is associated with child malnutrition.17
To fill in the gaps in this literature, the authors aimed to assess the prevalence of undernutrition in a semiarid region of Brazil and to explore the relationship of undernutrition and short duration of breastfeeding with communication, gross-motor, fine-motor, problem-solving and personal-social development scores through a cross-sectional population-based study of children 0-66 months of age residing in Ceará, Brazil.
MethodsStudy design and populationThe authors analyzed data from the Study on Maternal and Child Health in Ceará, Brazil (Pesquisa de Saúde Materno Infantil no Ceará - PESMIC), and full details of the methods of the present study can be found elsewhere.18,19 Briefly, the PESMIC is a population-based cross-sectional study on children 0–72 months of age and their mothers living in the state of Ceará, in Northeastern Brazil. The PESMIC sample represents Fortaleza and the rural areas of Ceará. Ceará is one of the poorest states in Brazil, with a population of 9 million inhabitants living in a semiarid climate. Fortaleza (2.6 million inhabitants) is the capital and urban commercial center of Ceará, but the study area also includes rural areas, where subsistence farming is dominant. For this analysis, the authors used child development data from the sixth PESMIC survey carried out in 2017.
The PESMICs used cluster sampling, based on the Brazilian Institute of Geography and Statistics (IBGE) census tracts, and stratification between the state capital Fortaleza and the rural areas. The 6th PESMIC was conducted from August to November 2017 and surveyed 160 randomly selected census tracts that included a total of 3,200 households. All children from 0 to 72 months old and women 10 to 49 years old living in selected households were included in this survey. Once a census tract was defined and its corresponding map obtained, the location of the cluster of 20 houses to be investigated was determined as follows: the starting point of the cluster (the first home to be visited) was randomly selected utilizing ArcGIS® software, GIS Inc. Households were then visited consecutively, in a counterclockwise spiral fashion.
MeasurementsDependent variableChild development was assessed with the Ages and Stages Questionnaire version 3,20 which has been validated for Brazil (ASQ-BR).21 This questionnaire consists of a series of questionnaires divided into 20 different age ranges, which seeks to evaluate children aged between 2 and 66 months (older age assessed by ASQ). Five domains of child development are measured in the ASQ-BR subsections: Communication, Broad Motor Coordination, Fine Motor Coordination, Problem Solving, and Personal / Social, with six questions each with a maximum scoring of 60 points in each of them.19 The interviewers were explicitly trained for 20 hours by medical professionals for the application of the instrument.20 Age-standardized scores were calculated, and adjustment was made for children less than 24 months of age who were born preterm.20 As suggested in the ASQ manual and the literature, the authors considered < - 2 standard deviation as a confirmatory delay.20,22 The ASQ was chosen because it presented good consistency of validity in relation to more robust techniques for assessing child development and is more viable for application in large samples, and it has already been used successfully in Brazil.22,23
Independent variablesWe considered the WHO definition of undernutrition, which includes wasting (low weight-for-height), stunting (low height-for-age), and underweight (low weight-for-age). Length of children < 24 months of age was measured to the nearest 0.1 cm with a length board, while the height of children > 24 months was measured to the nearest 0.1 cm with the use of a portable stadiometer. Weight was measured to the nearest 0.1 kg with the use of a SECA digital scale. Child anthropometric measurements were taken by trained staff. Height-for-age z score (HAZ), weight-for-height z score (WHZ), and weight-for-age z score (WAZ) were calculated with the use of WHO child growth standards.24 CDC growth charts for preterm infants were used in children younger than 24 months who were born preterm.25
Breastfeeding duration was assessed by the maternal report and confirmed in the governmental child health booklet. According to WHO guidelines, the authors assessed if the children were breastfed in the first hour and the duration of breastfeeding categorized as lower than six months, stratified in 0–2, 3–4, 5–6 months, or more than six months.
For the age, sex, interviewer, maternal education, permanent income, smoking, drinking, low birth weight, and toxic stress exposure (adverse childhood experiences (ACEs)) evaluation standardized questionnaires were administered to the mother or head of the household. The adverse experiences experienced by the child were evaluated through the parental report. More on the evaluated ACEs can be found elsewhere.15 In each household, information was obtained about all children through the mother or primary caregiver report and also confirmed with the child health booklet held by the family. When maternal report and the booklet data were not in agreement, the health booklet data were preferentially considered.
Statistical analysisThe authors analyzed standardized scores of the ASQ-BR26 for children of 5–66 months of age. For children less than five months of age, we used US ASQ standards, due to available national scores starting at 6 months of age (but the questionnaire applied was the ASQ-BR).27 First, the authors present descriptive analysis on the assessed variables, adjusted for complex sample effects. Then the authors used logistic regression models adjusted for sample effects to determine the association of nutritional factors with ASQ-BR domain scores. The authors took a casual approach to multivariate analyses, which considered socio-cultural factors (maternal education), poverty, biological risk factors (low birth weight, maternal drinking or smoking during pregnancy), and psychosocial risk-factors (exposure to toxic stress, defined as exposure to adverse experiences)15 as the main determinants of child development.16,28 All study data were double entered twice using EpiInfo 2000 and tested for concordance and analyzed using SPSS Version 23 (SPSS Statistics for Windows, Version 23.0. IBM Inc).
EthicsWritten informed consent was obtained from participating women. Written consent for children was also given by mothers, and consent for adolescent minors was obtained from their parents or legal guardians. The PESMICs survey was approved by the Research Ethics Committee in Brazil under the number 73516417.4.0000.5049.
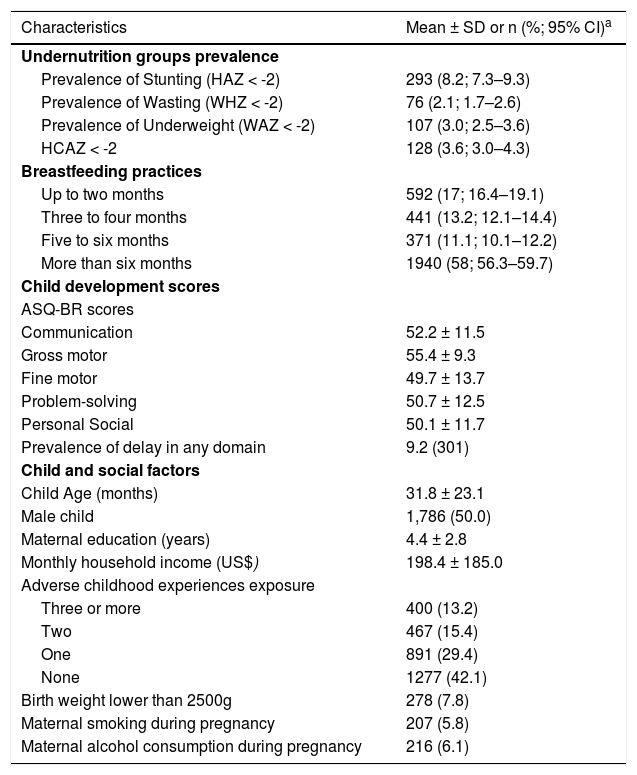
ResultsThe study included a cross-sectional population-based sample of 3,566 children from 3,200 households. A summary of the study population characteristics is presented in Table 1. The authors found that 8.2%, 3.0%, 2.1%, and 3.6% of children were stunted, underweight, or wasted, at the time of the interview, respectively. The mean child age was 31.8 ± 23.1 months, and the sample was equally distributed between males and females. The mean maternal education was 4.4 ± 2.8 years, and the mean monthly family income was 1090.4 (∼ 280 USD) ±1017.9 Reais per household.
Characteristics of 3,566 children of 3,200 families assessed with ASQ-3 at 0–66 months of age in Ceará, Brazil, 2017.
| Characteristics | Mean ± SD or n (%; 95% CI)a |
|---|---|
| Undernutrition groups prevalence | |
| Prevalence of Stunting (HAZ < -2) | 293 (8.2; 7.3–9.3) |
| Prevalence of Wasting (WHZ < -2) | 76 (2.1; 1.7–2.6) |
| Prevalence of Underweight (WAZ < -2) | 107 (3.0; 2.5–3.6) |
| HCAZ < -2 | 128 (3.6; 3.0–4.3) |
| Breastfeeding practices | |
| Up to two months | 592 (17; 16.4–19.1) |
| Three to four months | 441 (13.2; 12.1–14.4) |
| Five to six months | 371 (11.1; 10.1–12.2) |
| More than six months | 1940 (58; 56.3–59.7) |
| Child development scores | |
| ASQ-BR scores | |
| Communication | 52.2 ± 11.5 |
| Gross motor | 55.4 ± 9.3 |
| Fine motor | 49.7 ± 13.7 |
| Problem-solving | 50.7 ± 12.5 |
| Personal Social | 50.1 ± 11.7 |
| Prevalence of delay in any domain | 9.2 (301) |
| Child and social factors | |
| Child Age (months) | 31.8 ± 23.1 |
| Male child | 1,786 (50.0) |
| Maternal education (years) | 4.4 ± 2.8 |
| Monthly household income (US$) | 198.4 ± 185.0 |
| Adverse childhood experiences exposure | |
| Three or more | 400 (13.2) |
| Two | 467 (15.4) |
| One | 891 (29.4) |
| None | 1277 (42.1) |
| Birth weight lower than 2500g | 278 (7.8) |
| Maternal smoking during pregnancy | 207 (5.8) |
| Maternal alcohol consumption during pregnancy | 216 (6.1) |
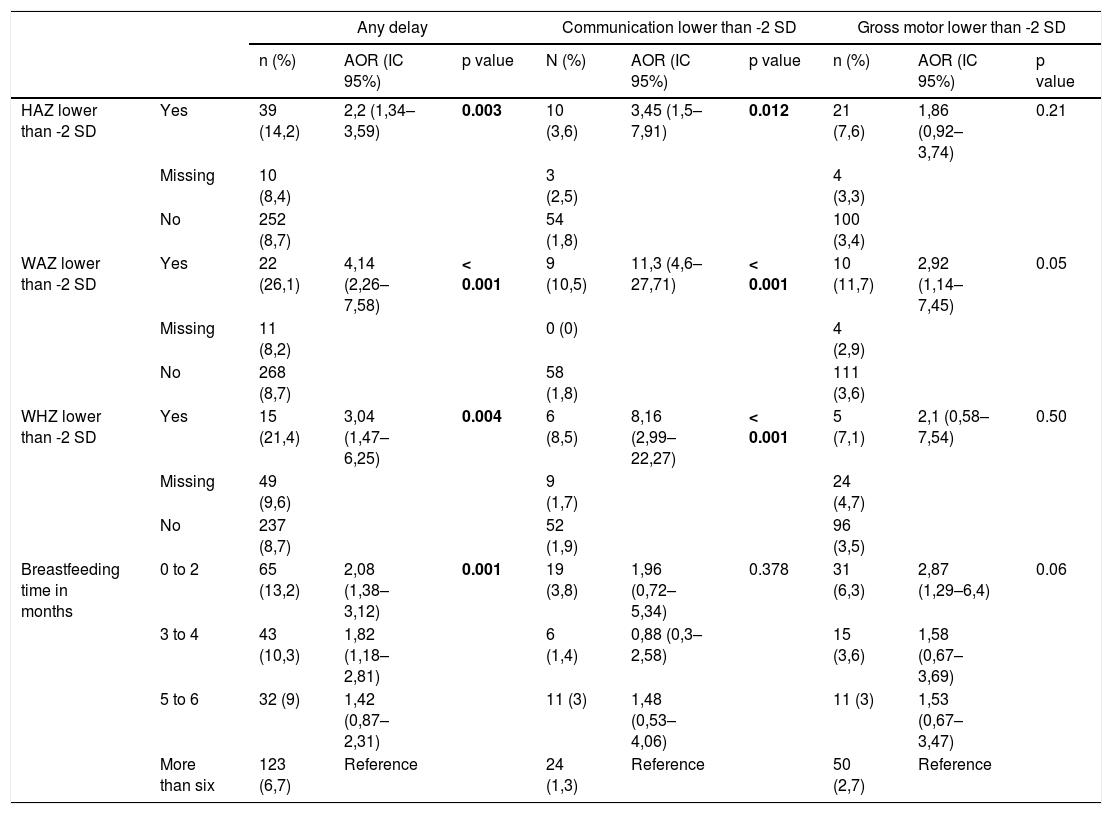
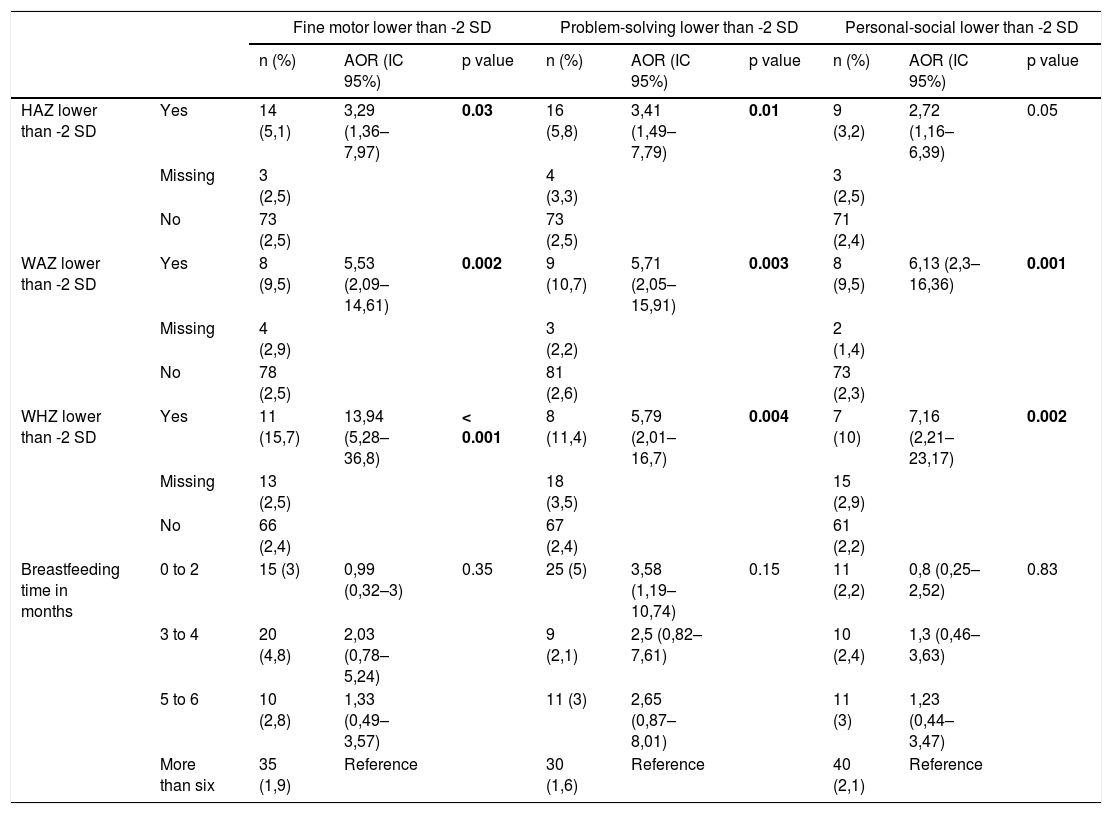
The relationship of undernutrition and breastfeeding practices with child development outcomes, adjusted for all factors of Table 1, is presented in Tables 2 and 3. In multivariate analysis, all studied factors were associated with a higher prevalence of child development impairment in at least one of the assessed domains. WAZ was the factor with the strongest effect, with an adjusted odds ratio (AOR) of 4,14 (2,26–7,58), p < 0.001, followed by WHZ (AOR 3,04 (1,47–6,25), p = 0.003), HAZ (AOR 2,2 (1,34–3,59), p = 0.004), and breastfeeding for up to two months compared to more than six months (AOR 2,08 (1,38–3,12), p = 0.001). All three undernutrition indicators were associated with all development domains, except for the gross motor domain.
Association of nutritional factors and any child development delay, communication delay and gross motor delay at 0–66 months of age children in Ceará, Brazil, 2017.
AOR, adjusted odds ratio.
Adjusted for age, sex, interviewer, maternal education, permanent income, smoking, drinking, low birth weight, toxic stress exposure.
Logistic regression models, adjusted for sample clustering.
Association of nutritional factors and fine motor delay, problem solving delay and personal social delay at 0–66 months of age children in Ceará, Brazil, 2017.
AOR, adjusted odds ratio.
Adjusted for age, sex, interviewer, maternal education, permanent income, smoking, drinking, low birth weight, toxic stress exposure.
Logistic regression models, adjusted for sample clustering.
The authors conducted a population-representative cross-sectional study of 3566 children aged 0–66 months of age in Ceará, in the semiarid region of Brazil. The authors estimated the prevalence of undernutrition in the given setting, 8.2% (CI 95% 7.3–9.3) for stunting, 2.1% (CI 95% 1.7–2.6) for wasting and 3.0% (CI 95% 2.5–3.6) for underweight. The authors also found that undernutrition and a short duration of breastfeeding were associated with a higher prevalence of impaired child development.
Although the general data on the prevalence of stunting in Brazil in 2007, the last available according to UNICEF, is 6.95%, the previous PESMIC study performed in Ceará, Brazil, the same state of this study, found a prevalence of 13.0%, and the present study reveals a drop of 37% in ten years in Ceará.1,29 However, it is still 16% higher than the general Brazilian prevalence of 2007, which suggests the existence of concentrations of child malnutrition in specific regions. Reduction in stunting is one of the Global Nutrition Targets 2025 from WHO, and the target is a reduction of 40% in the number of children under five who are stunted, and to achieve this objective directed actions will be necessary.12 Brazil experienced a fall of almost 37% in stunting that can be linked to changes in the socioeconomic factors, as improvements in the purchasing capacity of families through successive increases in the minimum wage and expansion of “Bolsa Família”, the main Brazilian cash-transfer program,30 a rise in maternal education,31 as well as to care factors, namely improvements in the coverage of maternal and child health services.32 The semiarid climate, and the food insecurity associated with it, may contribute to the higher prevalence found in Ceará.
The authors contribute to the robust literature that points out that child linear growth is associated with development outcomes. A prior study conducted among children in Tanzania determined that HAZ and WAZ were linearly associated with cognitive, communication, and motor domains.4,28 In Brazil, although the prevalence of undernutrition is now lower, as compared to other LMICs, the authors still found significant associations of child anthropometric measures with development outcomes. It is proposed that the factors which lead to linear growth faltering can simultaneously affect child development through several mechanisms. It is important to emphasize that the explanatory models of the effect of chronic and acute malnutrition on child development have differences. First, undernutrition can lead to deficits in neuronal growth and the generation of connections between brain regions associated with motor functioning and learning, this effect being more associated with chronic malnutrition, stunting.33 Second, acute malnutrition can be associated with the existence of infections and diarrheal conditions, which can lead to nutritional deficiency due to malabsorption, excessive loss of nutrients, and poor distribution of micronutrients, which impacts the availability of essential substrate for child development.34 Finally, malnourished children may also have difficulty engaging in activities that stimulate development.35 Child undernutrition can exist in contexts where other risk factors for child development accumulate, such as poverty, low educational level and adverse experiences.36 In the study's analysis, the authors adjusted the results for these overlapping determinants, finding less confounded effects of undernutrition on child development.
The authors also identified that decreased breastfeeding time was associated with a higher prevalence of any developmental delay with a gradient in this association, with a lower time reflecting a higher prevalence. The protective effect of breastfeeding for child development is already well established, and the effect appears to last as long as for the first six years of life, as found in the present study's results.37,38 Some may argue that children breastfed in the first hour are healthier, but in this study, the authors adjusted the analysis for birth weight, the same technique used in the studies that found a reduction in mortality and morbidity.
This study has a few limitations. First, the design of the study does not allow for analysis of child development trajectories over time, nor does direct determination of causal relationships and recall bias can impact information in older children. Second, the authors used the ASQ-3, which although being a validated highly suitable populational screening tool, it is less accurate for the detection of changes in child development than other more complex techniques. Further, while the study was designed to be population representative of children living in a semiarid setting, the present study's findings may not be generalizable to children in other contexts. Finally, the authors did not assess parenting, which may contribute to undernutrition and poor child development.
Overall, the authors found that undernutrition and breastfeeding are associated with development outcomes among Brazilian children. As a result, integrated nutritional programs may improve child development outcomes. The effect of the results was independent of income, maternal education, and exposure to toxic stress, and the two did not interact. The authors also highlight that the interventions targeting child nurturing should not only focus on food supply but to stimulate sensory and motor stimulation practices with children who are beneficiaries of income transfer programs.
FundingFundação Cearense de Apoio ao Desenvolvimento Científico e Tecnológico. Edital CHAMADA 07/2013 - PPSUS CE - FUNCAP/SESA/MS/CNPq. Número do auxílio 13506703-0.
Fundação Cearense de Apoio ao Desenvolvimento Científico e Tecnológico. Edital Jovens Doutores – Edital n° 02/2017.
To all the participants of this study and especially to all mothers that sometimes even under unfavorable environmental, emotional and/or social conditions, agreed to tell us their story.


