
To determine the sodium concentration in cow milk available for sale and to estimate its consumption by infants up to 6 months of age.
MethodsSodium level was determined by flame emission spectrophotometry in eight different lots of five brands of liquid ultra-high temperature milk and three brands of powdered milk. To estimate sodium consumption via cow milk, orientations for exceptional situations when neither breastfeeding nor infant formula is possible were considered. Inferential statistics were performed and results were compared with critical parameters at a 5% significance level.
ResultsThe mean sodium content per portion found in liquid milk (162.5±16.2) mg/200mL was higher than that in powdered milk (116.8±3.0) mg/26g. Estimated sodium consumption by infants through powdered milk varied from 149.8 to 224.7% of adequate intake, and via liquid milk can be more than 500% of the adequate intake, reaching 812.4% of it if dilution is not applied. Seven of the eight brands of milk studied had declared, on their labels, that the sodium content was 13–30% lower than that found in chemical analysis.
ConclusionLiquid and powdered whole cow milk have high sodium content, and the content per portion is higher in liquid milk than in powdered milk. The estimated consumption of sodium through these products can far exceed the adequate intake for infants from 0 to 6 months old, even when the recommended dilution and maximum daily volumes are followed.
Infants are recommended to be exclusively breastfed during their first 6 months of life, and breastfeeding may be maintained up to 2 years and complemented with adequate and safe food.1 The frequency of exclusive breastfeeding in Brazilian infants was reported to be 41% between infants up to 6 months and 58.7% from 9 to 12 months.2
When breastfeeding is not possible, health institutes and professionals in Brazil recommend that infant formulas should be used as substitutes. Nevertheless, there is evidence that whole cow milk is frequently used to replace breast milk.1 Data from national and local studies in Brazil showed that cow milk consumption by investigated infants varied from 40.3% to 62.4%, as a supplement or substitute to breast milk.3–5
Whole cow milk is not considered adequate for children under 12 months because it is potentially allergenic, has a low content of essential fatty acids and lactose, and a high renal solute load, partly due to some minerals.6 Cow milk consumption is also the main risk factor for iron deficiency anemia because of the insufficient iron content in a poorly bioavailable form.7
In addition to the sodium that is naturally present in cow milk, the technology employed to produce these products leads to an increase in sodium content because of the additives used, which, in general, are sodium salts.8 Increasing evidence indicates that high sodium intake in early life can have a major impact on health conditions and blood pressure in childhood and adult life.9–12
The present study aimed to determine the sodium concentration in cow milk available for sale and to estimate the amount of sodium consumed via cow milk by infants aged up to 6 months.
MethodsAt large supermarkets in different neighborhoods of Rio de Janeiro city, Rio de Janeiro, Brazil we investigated the brands of milk available for sale. Brands that were found in all supermarkets visited were selected, resulting in three brands of powdered cow whole milk (A, B, and C) and five brands of liquid ultra-high temperature (UHT) treated cow whole milk (D, E, F, G, and H). From all these selected brands, eight lots were randomly selected for analysis. A statistical design was adopted, and in a random process, eight different allotments of each selected brand were bought. Finally, 64 samples of whole cow milk were subjected to chemical analysis.
The sodium concentration in each sample was quantified through three determinations in parallel. First, the samples were homogenized by shaking liquid UHT milk in their own packages and by quartering powdered milk on brown sheets of paper. These operations were repeated to obtain samples of approximately 10g, which were stored in hermetically sealed and identified glass bottles.
To quantify the sodium content in the milk, appropriate sample weights were calculated based on the amount of sodium declared on the product labels. Analytical scales (Shimadzu® model AUY 120) that were previously tarred and porcelain capsules were used to accurately weigh the samples. Light ashes were obtained according to the Association of Official Analytical Chemists (AOAC).13 Sodium content was quantified by flame emission spectrophotometry (DM-63 model Digimed® flame photometer), as established by method 990.23.14 Solutions used in the construction of the calibration curve were prepared from a 1000mgL−1 sodium standard solution (Sodium Standard for AAS FLUKA).
Considering the readings from the photometer, weighed masses, dilution used, and milk portion specified by the producers, the amount of sodium (mg) present in 26g of powdered milk and in 200mL of liquid UHT milk was quantified.
In order to determine whether there was a statistically significant difference between the means of sodium content obtained through the analysis of the different batches of the chosen brands of the two types of milk, it was decided to subject the two sets of means to a statistical test. To determine whether the two sets of means could be applied to ANOVA15 and whether they were homoscedastic, calculated variances were subjected to Bartlett’s test.16 The results of statistical analyses were always compared with critical parameters at a 5% significance level.
Mean sodium content in powdered milk and liquid UHT milk was determined by chemical analysis in this study. To estimate the amount of sodium that would be ingested by infants up to 6 months when fed with powdered and liquid cow milk, orientations and precautions to offer cow milk for this group in exceptional situations when neither breastfeeding nor the use of infant formula is possible were considered: (a) maximum volume of milk per meal with milk for each age group (120mL for 0–1 month, 150mL for 1–2 months, 180mL for 2–3 months, and 200mL for 3–6 months); (b) maximum number of meals with milk per day for each age group (8 meals for 0–2 months, 6 meals for 2–4 months, and 3 meals for 4–6 months; (c) maximum total daily volume of milk (640mL for 0–1 month, 800mL for 1–4 months, 720mL for 2–3 months, and 500mL for 4–6 months); (d) dilution of powdered (5g/100mL) and liquid milk (2/3) for infants under 4 months old.17,18 Consumption of liquid UHT milk without dilution was also considered.
Estimated maximum daily sodium amount through powdered and liquid UHT whole cow milk consumed by infants from each age group was calculated. Adequate intake (AI) of sodium (120mg/day)19 was the reference for comparison. Sodium consumption compared to AI was presented as a percentage.
The mean sodium content in powdered milk and liquid UHT milk per portion (26g for powdered and 200mL for liquid UHT) analyzed in this study was also compared to that stated on the labels of the products. The differences between them were calculated and presented as percentages.
The present study, carried out through chemical analyses in milk, according to the National Council of Ethics in Research, is exempt from appreciation by an ethics committee, which is mandatory only in studies conducted with human beings.
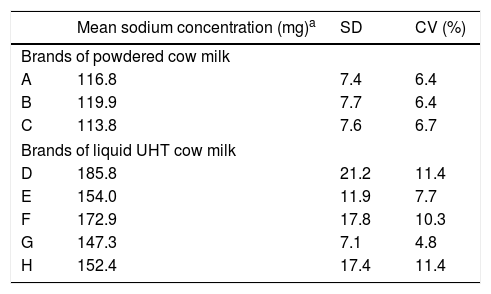
ResultsResults of the chemical analyses of sodium contents in powdered and UHT liquid cow milk are presented in Table 1. The samples of liquid UHT milk, in general, showed higher mean concentrations of sodium per portion than those of powdered milk (147.3–185.8mg/portion versus 113.8–119.9mg/portion). The mean sodium content in the portion of liquid UHT milk was 162.5±16.2mg/200mL and in powdered milk, it was 116.8±3.0mg/26g.
Sodium contents per portion in powdered (mg/26g) and UHT liquid (mg/200mL) cow milk.
| Mean sodium concentration (mg)a | SD | CV (%) | |
|---|---|---|---|
| Brands of powdered cow milk | |||
| A | 116.8 | 7.4 | 6.4 |
| B | 119.9 | 7.7 | 6.4 |
| C | 113.8 | 7.6 | 6.7 |
| Brands of liquid UHT cow milk | |||
| D | 185.8 | 21.2 | 11.4 |
| E | 154.0 | 11.9 | 7.7 |
| F | 172.9 | 17.8 | 10.3 |
| G | 147.3 | 7.1 | 4.8 |
| H | 152.4 | 17.4 | 11.4 |
UHT, ultra-high temperature; SD, standard deviation; CV, coefficient of variation.
The value of Chi-square (χ2) determined by Bartlett’s test16 to variances calculated from the mean sodium contents obtained for the different batches of powdered milk analyzed was lower than the tabulated value, indicating that they were homoscedastic and allowing the application of ANOVA test to compare the means. For liquid UHT milk batches, Bartlett’s test16 indicated that variances were heteroscedastic, so the means of calculated sodium contents were compared by the Welch test.20
F calculated by ANOVA (1273) was smaller than the table (3467) indicates that there is no significant difference between the mean sodium content determined for different batches of powdered milk. F calculated for liquid UHT milk (625) was greater than F tabulated (274), indicating that the mean sodium content obtained from the samples analyzed is not identical. In other words, some brands of liquid UHT milk had a higher content of sodium than others, which was not true in the case of powdered milk.
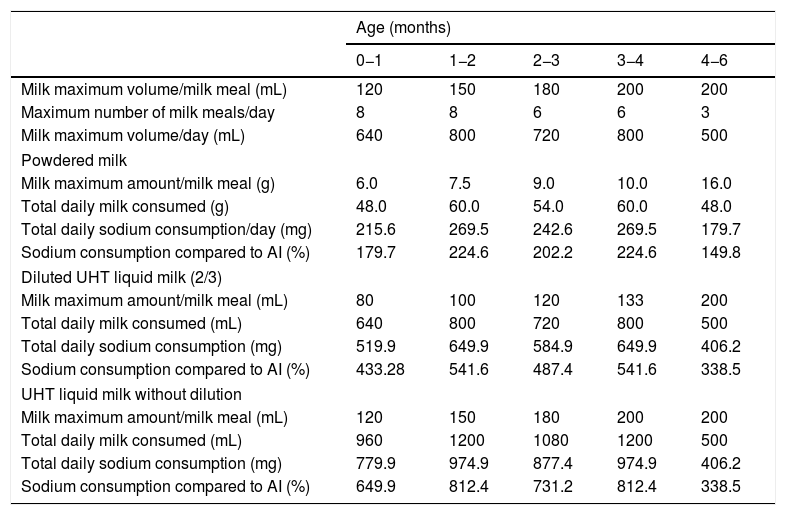
Table 2 presents the precautions recommended for cow milk consumption, such as maximum milk volume per milk meal, the maximum number of milk meals per day, and the maximum milk volume per day for each age group: 0–1, 1–2, 2–3, 3–4, and 4–6 months.17,18 It also reveals the estimated amount of sodium consumed by infants in each group according to the mean content of sodium determined in powdered and UHT liquid milk in the present study. Sodium consumption through powdered milk can vary from 149.8% (4–6 months) to 224.7% (1–2 and 3–4 months) of the AI, depending on the age group. The scenario is even worse when we take a look at the amount of sodium consumed via liquid UHT milk. It can be more than 5 times (541.6%) the AI for infants in 1–2 and 3–4-month groups when dilution was adopted and can reach more than 8 times (812.4%) the AI if this is not applied. It is worth mentioning that the maximum daily volume of milk offer accepted for infants from 0 to 6 months was respected. Estimated sodium consumption in age groups of 1–2 and 3–4 months was high for both powdered and liquid whole cow milk.
Estimated amount of sodium consumed by infants aged up to 6 months according to the mean content of sodium determined in powdered and UHT liquid milk.
| Age (months) | |||||
|---|---|---|---|---|---|
| 0−1 | 1−2 | 2−3 | 3−4 | 4−6 | |
| Milk maximum volume/milk meal (mL) | 120 | 150 | 180 | 200 | 200 |
| Maximum number of milk meals/day | 8 | 8 | 6 | 6 | 3 |
| Milk maximum volume/day (mL) | 640 | 800 | 720 | 800 | 500 |
| Powdered milk | |||||
| Milk maximum amount/milk meal (g) | 6.0 | 7.5 | 9.0 | 10.0 | 16.0 |
| Total daily milk consumed (g) | 48.0 | 60.0 | 54.0 | 60.0 | 48.0 |
| Total daily sodium consumption/day (mg) | 215.6 | 269.5 | 242.6 | 269.5 | 179.7 |
| Sodium consumption compared to AI (%) | 179.7 | 224.6 | 202.2 | 224.6 | 149.8 |
| Diluted UHT liquid milk (2/3) | |||||
| Milk maximum amount/milk meal (mL) | 80 | 100 | 120 | 133 | 200 |
| Total daily milk consumed (mL) | 640 | 800 | 720 | 800 | 500 |
| Total daily sodium consumption (mg) | 519.9 | 649.9 | 584.9 | 649.9 | 406.2 |
| Sodium consumption compared to AI (%) | 433.28 | 541.6 | 487.4 | 541.6 | 338.5 |
| UHT liquid milk without dilution | |||||
| Milk maximum amount/milk meal (mL) | 120 | 150 | 180 | 200 | 200 |
| Total daily milk consumed (mL) | 960 | 1200 | 1080 | 1200 | 500 |
| Total daily sodium consumption (mg) | 779.9 | 974.9 | 877.4 | 974.9 | 406.2 |
| Sodium consumption compared to AI (%) | 649.9 | 812.4 | 731.2 | 812.4 | 338.5 |
AI, adequate intake; UHT, ultra-high temperature.
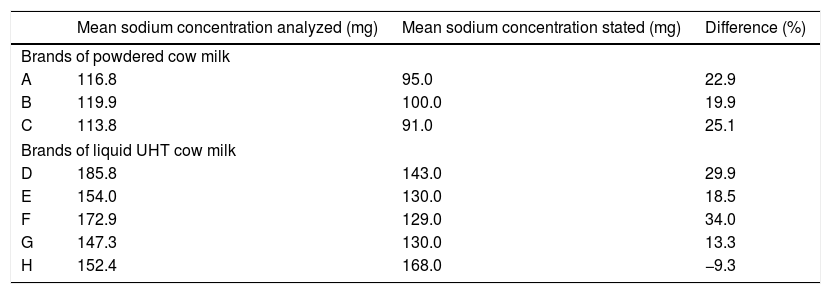
The present study also compared the mean sodium concentrations determined by chemical analysis in product samples with those stated on the labels of the respective milk samples. It was observed that, with the exception of brand H, all the others declared values that were 13–30% lower than those found in the chemical analysis (Table 3).
Mean sodium concentrations per portion of powdered (26g) and UHT liquid (200mL) cow milk analyzed compared to those stated on the labels of the respective products.
| Mean sodium concentration analyzed (mg) | Mean sodium concentration stated (mg) | Difference (%) | |
|---|---|---|---|
| Brands of powdered cow milk | |||
| A | 116.8 | 95.0 | 22.9 |
| B | 119.9 | 100.0 | 19.9 |
| C | 113.8 | 91.0 | 25.1 |
| Brands of liquid UHT cow milk | |||
| D | 185.8 | 143.0 | 29.9 |
| E | 154.0 | 130.0 | 18.5 |
| F | 172.9 | 129.0 | 34.0 |
| G | 147.3 | 130.0 | 13.3 |
| H | 152.4 | 168.0 | −9.3 |
UHT, ultra-high temperature.
Direct determination of sodium in cow milk available for sale commercially is the main contribution of the present study. As limitations, we point out that the availability of the analyzed brands of milk across the national territory was not evaluated, and infant cow milk intake was not measured, allowing us to only estimate sodium intake.
The results presented here reinforce the importance of diluting UHT cow milk, but show that even the dilution is not able to promote the adequacy of sodium intake. Despite the recommendation to not offer whole cow milk to feed infants aged under 6 months, it is widely used for this age group in cases of no breastfeeding or as a supplement with breast milk, especially in economically backward families.2
Methods adopted in Brazil for the treatment of water do not apply sodium salts. National mineral water manufacturers indicate the presence of around 100mg of sodium per liter of water. Therefore, the sodium content in the water is likely to make a very small contribution to the sodium consumed by infants through cow milk. As in the present study, the average levels of sodium found in UHT liquid milk are approximately 39% higher than in powdered milk and even considering the sodium occasionally present in water, the amount of sodium in UHT liquid milk would still be higher.
Cow milk is inadequate for infant nutrition, both in qualitative and quantitative terms. It is contraindicated for infant feeding in the first year of life, due to the inadequacy of its composition in relation to the infant’s nutritional needs and gastrointestinal and renal functional capacities.21,22 Cow milk has high protein content; an inadequate proportion of casein to whey proteins; a low amount of essential fatty acids; very high concentrations of electrolytes and micronutrients such as calcium and phosphorus; and insufficient levels of iron, zinc, copper, and vitamin C.21,22 The bioavailability of nutrients in cow milk is lower than that of nutrients in breast milk, and the process of industrialization leads to a loss of nutrients and the addition of sodium salts.7
Daily consumption of extremely high amounts of sodium by infants may be an important risk factor for diseases and may cause health problems in the first months of life and adulthood.7,23,24 A double-blind randomized study published early in the 1980s observed the effects of sodium intake during the first six months of life in 245 newborns who were fed with a diet with normal sodium content and 231 newborns fed with a diet containing almost three times less sodium. Systolic blood pressure was measured every month from the first week to the 25th week. After 25 weeks, systolic blood pressure was 2.1mmHg lower in the group that consumed a low-sodium diet. The difference between the groups increased significantly during the first 6 months of life. This study showed that sodium intake is related to blood pressure levels in infants.9 Fifteen years later, to investigate whether contrasting levels of sodium intake in childhood are associated with differences in blood pressure in adolescence, Geleijnse et al.9 measured blood pressure in 167 individuals and found that systolic blood pressure was 3.6mmHg lower and diastolic blood pressure was 2.2mmHg lower in individuals who, in their childhood, received a low-sodium diet (n=71), than in the control group (n=96). This finding suggests that high sodium intake in childhood is associated with differences in blood pressure in adolescence.
Among the dietary components, high consumption of sodium is strongly related to the elevation of blood pressure, one of the risk factors responsible for approximately 80% of cardiovascular diseases, which is the main cause of death in the world.23,24
Attention should also be given to the high renal solute load of processed whole cow milk due to the application of various additives in the form of sodium salts during the industrialization process.7 Consumption of such milk by infants in the first months of life may predispose them to hydroelectrolytic disorders and, as a consequence, hypernatremia dehydration.22,25–28 This risk increases when the mean environmental temperature is at or above 34°C (characteristic in Brazil and other tropical countries) or if infants are affected by fever or diarrhea.29 The risk of a child fed with cow milk developing hypernatremia dehydration is quite high because, in addition to the high solute load, the absence of protection afforded by breast protection per se predisposes them to diarrhea.28,29 In Brazil, where poor sanitation and water quality are illustrated by the fact that 60 of the 100 largest Brazilian municipalities have low rates of sewage collection, this other major threat to infant health results in high rates of hospitalization in children with diarrhea.30
This study also indicates that the information on processed milk labels is not reliable, and in disagreement with the levels recommended by Brazilian law.31 This finding indicates the need for an increased inspection by regulatory agencies. Food labeling is an important tool in public health because it allows health professionals and consumers to access reliable information on the basic characteristics of food products.
In view of the fact that infant formulas are not affordable for most Brazilian families, and cow milk is widely consumed by infants, Brazilian primary health care authorities must be able to promote, protect, and support breastfeeding; to guide the consumption of cow milk such that health risks are reduced, and to regulate the amount of sodium content in this product.
The present study aimed to determine the sodium concentration in cow milk available for sale and to estimate the amount of sodium consumed via cow milk by infants up to 6 months old.
The present study showed chemical evidence that liquid UHT and powdered whole cow milk have high sodium content and that the sodium content per portion is higher in liquid UHT milk than in powdered milk. Further, the estimated consumption of sodium through these products can far exceed the AI for infants aged 0–6 months, regardless of how milk is presented and even when the dilution and maximum daily volumes recommended are respected.
Conflicts of interestThe authors declare no conflicts of interest.


