

To estimate the prevalence of excessive weight and to identify associations with socioeconomic, demographic, biological, and lifestyle factors in adolescents.
MethodsIt is a cross-sectional school-based study, with a stratified and complex sample. The evaluated individuals were adolescents (2404), aged 12–17 years old, participating in the Study of Cardiovascular Risk Factors in Adolescents (ERICA). Demographic, socioeconomic, biological, anthropometric, and lifestyle variables were assessed. Poisson regression was used to verify the association between excess weight and independent variables.
ResultsThe prevalence of excessive weight was 26.3% in the study population, being 16.3% for overweight and 10% for obesity. In the multivariate analysis (hierarchical model), were associated with excessive weight: private education network, a higher number of televisions in the residence, eating habits related to the breakfast consumption, snacks purchase in the canteen, snacks in front to screens consumption and consumption of carbohydrates and lipids, in addition to age group (12–14 years) and sexual maturation (post-pubertal).
ConclusionsThe prevalence of excessive weight among the school adolescents studied is high, with a value higher than the national average and the results of previous studies with adolescents. Its distribution is associated with different factors, which are socioeconomic, demographic, biological, and related to lifestyle, reinforcing the complexity of this condition, which deserves a broad coping approach, involving not only individual efforts but social and public ones as well.
Excessive weight, a term which refers to overweight or obese individuals, has increased in adolescents over the decades worldwide.1,2 Adolescence is a phase of vulnerability, in which the individual undergoes physiological, psychological, and behavioral changes. The development of excess weight in this period is associated with impairments in health-related quality of life, and the development of diseases such as cardiovascular diseases, diabetes, musculoskeletal disorders and some cancers.1–3 In addition, overweight/obesity in adolescence is linked to its persistence in other stages of life, requiring special attention.4
The global prevalence of obesity among children and adolescents aged 5–19 years old increased considerably, between 1975 and 2016, among boys (from 0.9% to 7.8%) and girls (0.7%–5.6%), according to a joint analysis study of population-based worldwide studies.5 In Brazil, from 1974/1975 to 2008/2009, there was an increase in the prevalence of excessive weight among adolescents from 3.7% and 7.6% to 21.7% and 19.4% in males and females, respectively.6,7
Studies have shown that excessive weight in adolescents is related to several factors, such as socioeconomic, demographic, biological, and lifestyle-related reasons.8,9 Brazilian adolescents have undergone changes in their eating patterns, characterized by increased consumption of ultra-processed foods and decreased intake of natural foods, such as fruits and vegetables.10 In addition, this population has seen a decrease in the level of physical activity, which can be evidenced by the increasing use of screens.11
The Study of Cardiovascular Risk Factors in Adolescents (ERICA) represents a multicenter study that aims to evaluate the prevalence of factors associated with obesity and cardiovascular risk in Brazilian adolescents, including socioeconomic, demographic and behavioral aspects.12 Considering that in Brazil more than 80.0% of adolescents attend public or private school, a school base of the ERICA sample is considered very expressive for its purposes, according to Block et al.,13 with representation for the country, capitals and other municipalities with more than 100 thousand inhabitants.14
Research that evaluates overweight/obesity in adolescents in different regions of Brazil with representative samples at the local level is scarce. Due to the multifactorial nature of excess weight, it is necessary to develop studies that provide its prevalence and assess the factors associated locally, especially when there is the possibility of using representative and well-structured data, such as those in the ERICA. In this sense, the present study aimed to estimate the prevalence of excess weight and to identify associations with socioeconomic, demographic, biological, and lifestyle factors in adolescents.
MethodsDesign and samplingThis is a cross-sectional school-based study, carried out with adolescents aged 12–17, enrolled in public and private schools, in secondary or elementary education, in the city of Recife (Pernambuco). This study was linked to the ERICA. Data collection was carried out from October 2013 to May 2014.
For this series, only the data collected in the city of Recife, Pernambuco was used. The sample calculation was performed using the Epi-info version 7.1.5 statistical program, considering an infinite population, and was based on a prevalence of excessive weight of 16.2%,15 a confidence limit of 5%, a design effect 1.1, and a 95% confidence level. The minimum sample size was 2299 adolescents.
The sample selection was probabilistic and stratified in three stages: school, class and students. The sample units were schools and classes, and the units of analysis were adolescents aged 12–17, regularly enrolled in 39 selected public or private schools. Three classes were chosen by selected schools and all students were invited to participate in the study. Thus, the total sample of the present study was composed of 2404 adolescents. People with physical disabilities that made anthropometric assessment impossible; pregnant teenagers.
Data collectionData collection was performed by a team of technicians previously trained to apply the questionnaires and measure anthropometric measurements. The application of demographic, socioeconomic and lifestyle questionnaires was done with the aid of a Personal Digital Assistant (PDA).
Anthropometric measurements of weight and height were collected to assess the nutritional status of adolescents. The weight was obtained using a digital scale from Líder®, model P150m with a maximum capacity of 200kg and precision of 50g. Height was measured in duplicate, assuming a maximum variation of 0.5cm between the two measurements and averaging. A portable Alturexata® stadiometer was used, with millimeter resolution, maximum height of 213cm and precision of 0.1cm. For the rating of anthropometric measurements, the adolescents were barefoot, in an orthostatic position and wearing light clothing. The BMI indicator (Body Mass Index) for Age was used, in which the BMI was calculated by dividing the weight (kg) by the square height (meters). The classification of BMI/age results was performed according to WHO recommendations16: thinness: <−2 Z score (EZ); eutrophy: ≥−2 EZ and ≤+1 EZ and excessive weight >+1 EZ. In this study, adolescents who had a nutritional diagnosis of weight deficit were not included in the analyzes. The nutritional status of the adolescents was categorized as not excessive weight and excessive weight.
To analyze the factors associated with excessive weight, these variables were grouped into socioeconomic and demographic; biological (sex, age-range and sexual maturation) and lifestyle (physical activity and diet).
The socioeconomic and demographic variables evaluated were: mother's education in years of study, skin color (self-reported), education network (public or private), socioeconomic class according to criteria of the Brazilian Association of Research Companies (ABEP),17 number of people in the household and number of televisions in the residence.
Sexual maturation was evaluated according to the growth of pubic hair and breasts, for females, and according to the growth of pubic hair and genitals, for males. A spreadsheet with figures referring to the stages of sexual maturation proposed by Tanner,18 where the teenagers identified which stage they were in (from 1 to 5). This variable was categorized into: prepubertal (stage 1), pubertal (stages 2, 3, and 4), and postpubertal (stage 5).
Physical activity was assessed during the interview using the questionnaires available in PDA. The adolescents answered questions about the type, duration, and frequency of activity based on the International Physical Activity Questionnaire (IPAQ), in which the adolescent identified which types of activities he/she performed and reported the frequency and duration. The adolescent was classified as: active (≥300min per week) or insufficiently active (<300min per week).19
Eating habits were assessed through questions about breakfast consumption; snacks purchase in the canteen; school meals consumption; snacks in front of screens consumption (popcorn, cookies, pretzels, sandwiches, chocolate, or sweets), meals in front of screens consumption; and daily water intake. Answer options included never, sometimes, almost/every day.
A 24-h food record (R24h) was applied to each adolescent individually through face-to-face interviews using the Multiple-Pass Method to obtain the median intake of calories and macronutrients in the group, which were then classified into two categories, according to the level of intake: lower or equal to the median and above the median. Dietary variables were collected with a specific software developed for the direct entry of information into netbooks (ERICA-REC24). Consumption was estimated using the Nutritional Composition Table of Food Consumption in Brazil and the Table of Referred Measures for Food Consumption in Brazil.
Statistical analysisThe ERICA sample is considered complex, as it employs stratification and conglomeration, in addition to unequal probabilities in its selection stages, requiring an analysis directed to this type of sampling. All statistical analysis was performed using the Stata 14.0 survey library. Continuous variables were tested for normality by the Shapiro–Wilk test, wherein the non-normal distribution was verified and, therefore, the use of the median and interquartile ranges was chosen. The relationship between excessive weight in adolescents and independent variables was assessed using the chi-square test and Poisson regression. The independent variables that presented a value of p<0.20 in the bivariate analysis entered the multivariate analysis. In the hierarchical model, socioeconomic and demographic variables constituted level 1 (most distal), lifestyle variables, level 2 and biological variables, level 3 (most proximal). Within each hierarchical level, risk factors for excessive weight were considered as variables with p≤0.05, which remained in the multiple models in the analyzes of the subsequent level.
Ethical aspectsThe research project was approved by the Human Research Ethics Committee of the Health Sciences Center, Federal University of Pernambuco, under registration number CAAE: 05185212.2.2002.5208, in compliance with Resolution no. 466/12 “Research involving Human Beings”, from the National Health Council. The parents or legal guardians signed the Free and Informed Consent Form and the adolescents signed the Free and Informed Assent Form.
ResultsThe sample of the present study was composed of 2404 adolescents of both sexes, corresponding to an estimated population of 142,421 individuals. The median age was 15 years old (IQ=13–16).
The prevalence of excessive weight (Fig. 1) was of 26,3% (IC95%: 23,8–29), being 16,3% (IC95%: 14,2−18,5) overweight and 10% (IC95%: 8,4–11,8) obesity. Nutritional deficit was identified in 4% (95% CI: 3.2–5.1) of the adolescents, being more prevalent in males (4.9%) than in females (3.1%).

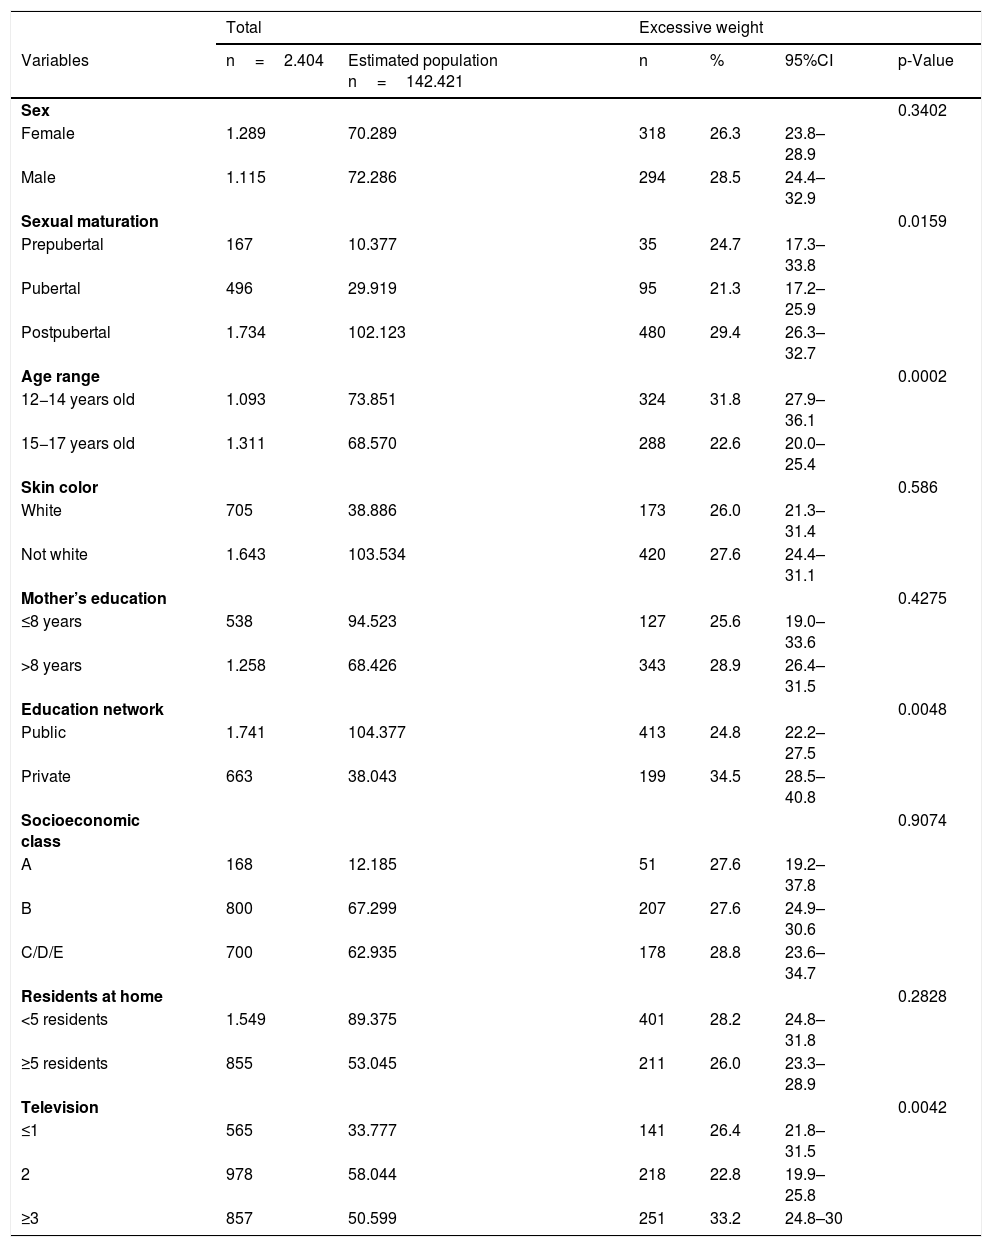
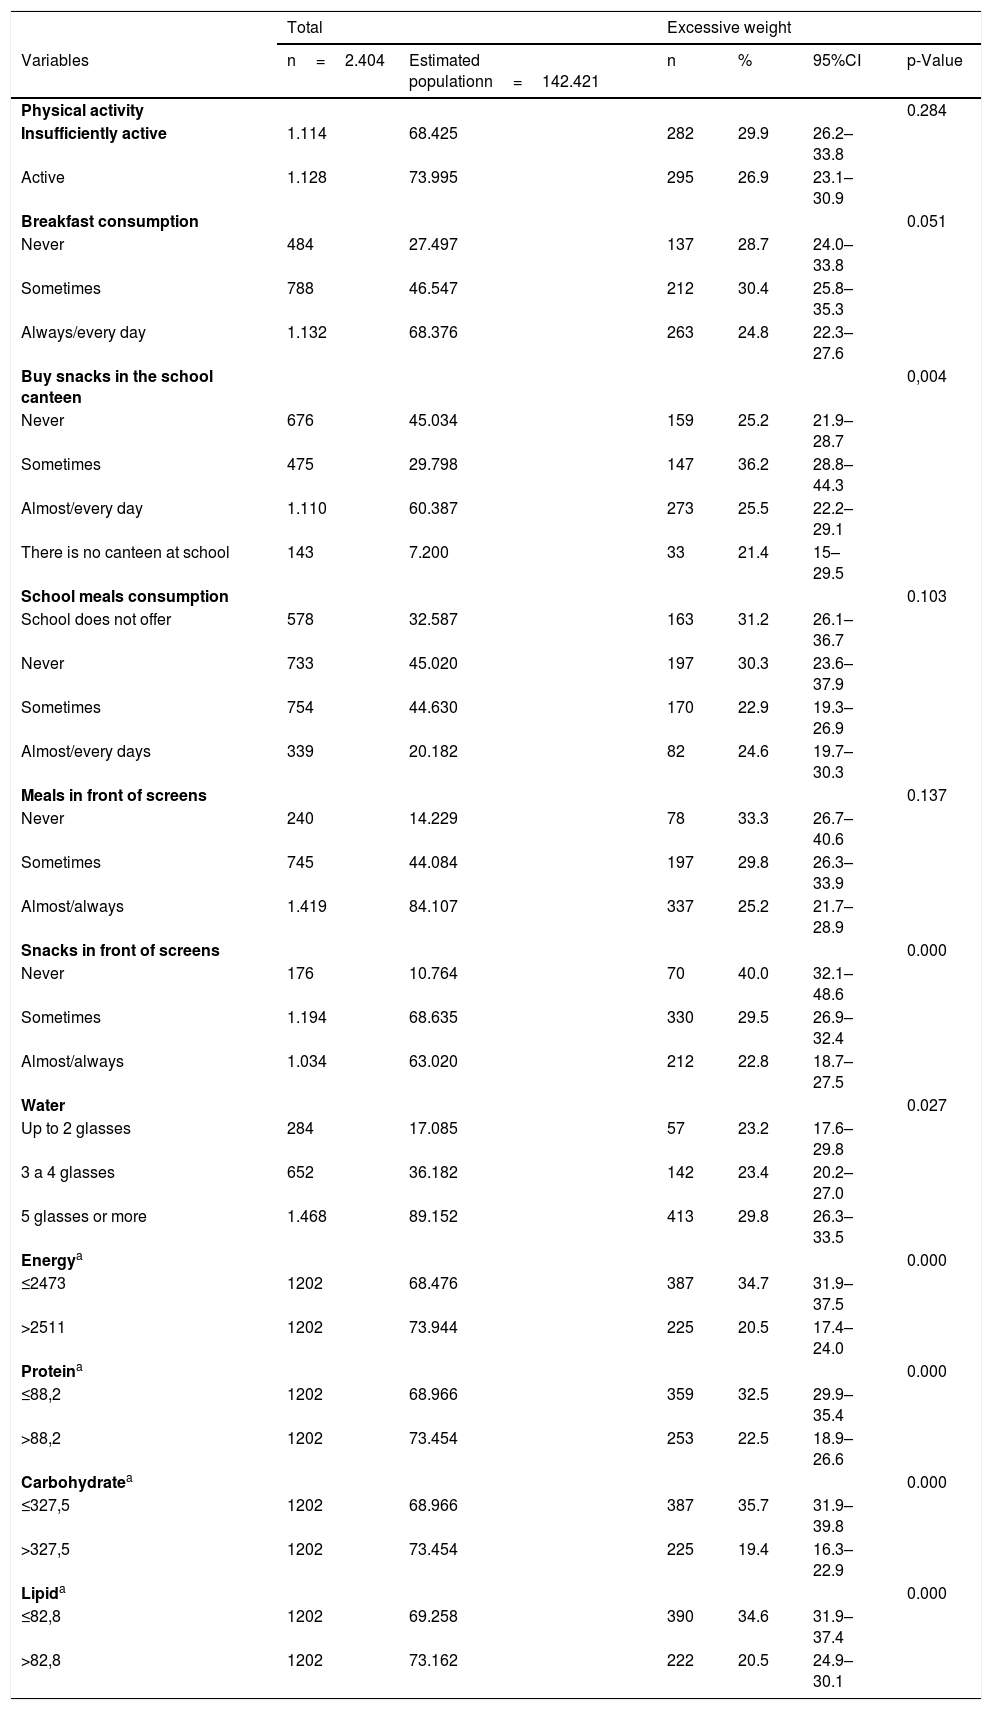
In the bivariate analysis, excess weight was statistically more prevalent in adolescents aged 12–14, post-pubertal sexual maturation stage, adolescents who attended private schools, those who had 4 or more television sets at home, adolescents who mentioned “sometimes eating breakfast”, “sometimes buying snacks in the canteen”, “never consuming snacks in front of screens”, “drinking 5 or more glasses of water”, and those whose energy and macronutrient consumption were found below the median (Tables 1 and 2).
Excessive weight adolescents aged 12–17 years old according to socioeconomic, demographic and biological variables. Recife, Pernambuco, 2013–2014.
| Total | Excessive weight | |||||
|---|---|---|---|---|---|---|
| Variables | n=2.404 | Estimated population n=142.421 | n | % | 95%CI | p-Value |
| Sex | 0.3402 | |||||
| Female | 1.289 | 70.289 | 318 | 26.3 | 23.8–28.9 | |
| Male | 1.115 | 72.286 | 294 | 28.5 | 24.4–32.9 | |
| Sexual maturation | 0.0159 | |||||
| Prepubertal | 167 | 10.377 | 35 | 24.7 | 17.3–33.8 | |
| Pubertal | 496 | 29.919 | 95 | 21.3 | 17.2–25.9 | |
| Postpubertal | 1.734 | 102.123 | 480 | 29.4 | 26.3–32.7 | |
| Age range | 0.0002 | |||||
| 12−14 years old | 1.093 | 73.851 | 324 | 31.8 | 27.9–36.1 | |
| 15−17 years old | 1.311 | 68.570 | 288 | 22.6 | 20.0–25.4 | |
| Skin color | 0.586 | |||||
| White | 705 | 38.886 | 173 | 26.0 | 21.3–31.4 | |
| Not white | 1.643 | 103.534 | 420 | 27.6 | 24.4–31.1 | |
| Mother’s education | 0.4275 | |||||
| ≤8 years | 538 | 94.523 | 127 | 25.6 | 19.0–33.6 | |
| >8 years | 1.258 | 68.426 | 343 | 28.9 | 26.4–31.5 | |
| Education network | 0.0048 | |||||
| Public | 1.741 | 104.377 | 413 | 24.8 | 22.2–27.5 | |
| Private | 663 | 38.043 | 199 | 34.5 | 28.5–40.8 | |
| Socioeconomic class | 0.9074 | |||||
| A | 168 | 12.185 | 51 | 27.6 | 19.2–37.8 | |
| B | 800 | 67.299 | 207 | 27.6 | 24.9–30.6 | |
| C/D/E | 700 | 62.935 | 178 | 28.8 | 23.6–34.7 | |
| Residents at home | 0.2828 | |||||
| <5 residents | 1.549 | 89.375 | 401 | 28.2 | 24.8–31.8 | |
| ≥5 residents | 855 | 53.045 | 211 | 26.0 | 23.3–28.9 | |
| Television | 0.0042 | |||||
| ≤1 | 565 | 33.777 | 141 | 26.4 | 21.8–31.5 | |
| 2 | 978 | 58.044 | 218 | 22.8 | 19.9–25.8 | |
| ≥3 | 857 | 50.599 | 251 | 33.2 | 24.8–30 | |
CI, 95% confidence interval; n, sample; %, prevalence.
Excessive weight adolescents aged 12–17 years old according to lifestyle variables. Recife, Pernambuco, 2013–2014.
| Total | Excessive weight | |||||
|---|---|---|---|---|---|---|
| Variables | n=2.404 | Estimated populationn=142.421 | n | % | 95%CI | p-Value |
| Physical activity | 0.284 | |||||
| Insufficiently active | 1.114 | 68.425 | 282 | 29.9 | 26.2–33.8 | |
| Active | 1.128 | 73.995 | 295 | 26.9 | 23.1–30.9 | |
| Breakfast consumption | 0.051 | |||||
| Never | 484 | 27.497 | 137 | 28.7 | 24.0–33.8 | |
| Sometimes | 788 | 46.547 | 212 | 30.4 | 25.8–35.3 | |
| Always/every day | 1.132 | 68.376 | 263 | 24.8 | 22.3–27.6 | |
| Buy snacks in the school canteen | 0,004 | |||||
| Never | 676 | 45.034 | 159 | 25.2 | 21.9–28.7 | |
| Sometimes | 475 | 29.798 | 147 | 36.2 | 28.8–44.3 | |
| Almost/every day | 1.110 | 60.387 | 273 | 25.5 | 22.2–29.1 | |
| There is no canteen at school | 143 | 7.200 | 33 | 21.4 | 15–29.5 | |
| School meals consumption | 0.103 | |||||
| School does not offer | 578 | 32.587 | 163 | 31.2 | 26.1–36.7 | |
| Never | 733 | 45.020 | 197 | 30.3 | 23.6–37.9 | |
| Sometimes | 754 | 44.630 | 170 | 22.9 | 19.3–26.9 | |
| Almost/every days | 339 | 20.182 | 82 | 24.6 | 19.7–30.3 | |
| Meals in front of screens | 0.137 | |||||
| Never | 240 | 14.229 | 78 | 33.3 | 26.7–40.6 | |
| Sometimes | 745 | 44.084 | 197 | 29.8 | 26.3–33.9 | |
| Almost/always | 1.419 | 84.107 | 337 | 25.2 | 21.7–28.9 | |
| Snacks in front of screens | 0.000 | |||||
| Never | 176 | 10.764 | 70 | 40.0 | 32.1–48.6 | |
| Sometimes | 1.194 | 68.635 | 330 | 29.5 | 26.9–32.4 | |
| Almost/always | 1.034 | 63.020 | 212 | 22.8 | 18.7–27.5 | |
| Water | 0.027 | |||||
| Up to 2 glasses | 284 | 17.085 | 57 | 23.2 | 17.6–29.8 | |
| 3 a 4 glasses | 652 | 36.182 | 142 | 23.4 | 20.2–27.0 | |
| 5 glasses or more | 1.468 | 89.152 | 413 | 29.8 | 26.3–33.5 | |
| Energya | 0.000 | |||||
| ≤2473 | 1202 | 68.476 | 387 | 34.7 | 31.9–37.5 | |
| >2511 | 1202 | 73.944 | 225 | 20.5 | 17.4–24.0 | |
| Proteina | 0.000 | |||||
| ≤88,2 | 1202 | 68.966 | 359 | 32.5 | 29.9–35.4 | |
| >88,2 | 1202 | 73.454 | 253 | 22.5 | 18.9–26.6 | |
| Carbohydratea | 0.000 | |||||
| ≤327,5 | 1202 | 68.966 | 387 | 35.7 | 31.9–39.8 | |
| >327,5 | 1202 | 73.454 | 225 | 19.4 | 16.3–22.9 | |
| Lipida | 0.000 | |||||
| ≤82,8 | 1202 | 69.258 | 390 | 34.6 | 31.9–37.4 | |
| >82,8 | 1202 | 73.162 | 222 | 20.5 | 24.9–30.1 | |
CI, 95% confidence interval; n, sample; %, prevalence.
Physical activity: active (≥300min per week) and insufficiently active (<300min per week).
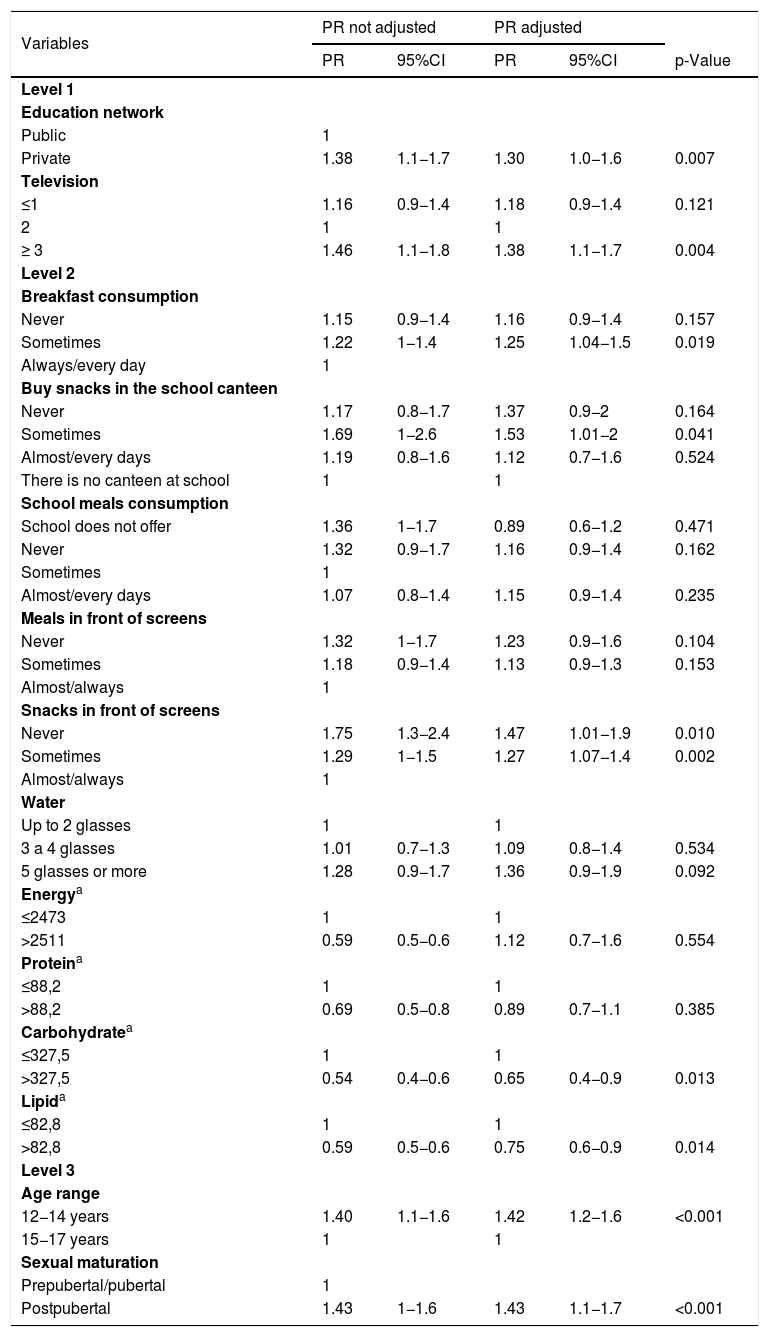
After adjusting for the confounding variables, in the hierarchical analysis, the factors that were shown to be associated with excessive weight were: adolescents from the private school network, with a higher number of television sets in the residence, “sometimes eating breakfast”, “sometimes buying snacks in the canteen”, “never or sometimes eating snacks in front of screens” and consumption of carbohydrate and lipid below the median. The biological variables that remained associated after adjusting the variables were: age range (12–14 years old) and sexual maturation (post-pubertal) (Table 3).
Prevalence ratio for excessive weight adolescents from 12 to 17 years old, according to socioeconomic, demographic, biological and lifestyle variables. Recife, Pernambuco, 2013–2014.
| Variables | PR not adjusted | PR adjusted | |||
|---|---|---|---|---|---|
| PR | 95%CI | PR | 95%CI | p-Value | |
| Level 1 | |||||
| Education network | |||||
| Public | 1 | ||||
| Private | 1.38 | 1.1−1.7 | 1.30 | 1.0−1.6 | 0.007 |
| Television | |||||
| ≤1 | 1.16 | 0.9−1.4 | 1.18 | 0.9−1.4 | 0.121 |
| 2 | 1 | 1 | |||
| ≥ 3 | 1.46 | 1.1−1.8 | 1.38 | 1.1−1.7 | 0.004 |
| Level 2 | |||||
| Breakfast consumption | |||||
| Never | 1.15 | 0.9−1.4 | 1.16 | 0.9−1.4 | 0.157 |
| Sometimes | 1.22 | 1−1.4 | 1.25 | 1.04−1.5 | 0.019 |
| Always/every day | 1 | ||||
| Buy snacks in the school canteen | |||||
| Never | 1.17 | 0.8−1.7 | 1.37 | 0.9−2 | 0.164 |
| Sometimes | 1.69 | 1−2.6 | 1.53 | 1.01−2 | 0.041 |
| Almost/every days | 1.19 | 0.8−1.6 | 1.12 | 0.7−1.6 | 0.524 |
| There is no canteen at school | 1 | 1 | |||
| School meals consumption | |||||
| School does not offer | 1.36 | 1−1.7 | 0.89 | 0.6−1.2 | 0.471 |
| Never | 1.32 | 0.9−1.7 | 1.16 | 0.9−1.4 | 0.162 |
| Sometimes | 1 | ||||
| Almost/every days | 1.07 | 0.8−1.4 | 1.15 | 0.9−1.4 | 0.235 |
| Meals in front of screens | |||||
| Never | 1.32 | 1−1.7 | 1.23 | 0.9−1.6 | 0.104 |
| Sometimes | 1.18 | 0.9−1.4 | 1.13 | 0.9−1.3 | 0.153 |
| Almost/always | 1 | ||||
| Snacks in front of screens | |||||
| Never | 1.75 | 1.3−2.4 | 1.47 | 1.01−1.9 | 0.010 |
| Sometimes | 1.29 | 1−1.5 | 1.27 | 1.07−1.4 | 0.002 |
| Almost/always | 1 | ||||
| Water | |||||
| Up to 2 glasses | 1 | 1 | |||
| 3 a 4 glasses | 1.01 | 0.7−1.3 | 1.09 | 0.8−1.4 | 0.534 |
| 5 glasses or more | 1.28 | 0.9−1.7 | 1.36 | 0.9−1.9 | 0.092 |
| Energya | |||||
| ≤2473 | 1 | 1 | |||
| >2511 | 0.59 | 0.5−0.6 | 1.12 | 0.7−1.6 | 0.554 |
| Proteina | |||||
| ≤88,2 | 1 | 1 | |||
| >88,2 | 0.69 | 0.5−0.8 | 0.89 | 0.7−1.1 | 0.385 |
| Carbohydratea | |||||
| ≤327,5 | 1 | 1 | |||
| >327,5 | 0.54 | 0.4−0.6 | 0.65 | 0.4−0.9 | 0.013 |
| Lipida | |||||
| ≤82,8 | 1 | 1 | |||
| >82,8 | 0.59 | 0.5−0.6 | 0.75 | 0.6−0.9 | 0.014 |
| Level 3 | |||||
| Age range | |||||
| 12−14 years | 1.40 | 1.1−1.6 | 1.42 | 1.2−1.6 | <0.001 |
| 15−17 years | 1 | 1 | |||
| Sexual maturation | |||||
| Prepubertal/pubertal | 1 | ||||
| Postpubertal | 1.43 | 1−1.6 | 1.43 | 1.1−1.7 | <0.001 |
PR, prevalence ratio; CI, 95% confidence interval.
Energy, carbohydrate, protein, lipids: median intake of calories and macronutrients.
In this study, the prevalence of excessive weight found reflects the universalization of the nutritional transition, with values above the national average,8 the values found in developed countries, and the values expected for a healthy population, according to WHO.1 These findings show that excessive weight continues to be a serious public health problem despite the public policies adopted, with epidemic proportions, indicating the need for more effective measures to contain the progress of cases, and, to prevent cardiometabolic diseases.1,2
When performing a temporal comparison of the evolution of excess weight in adolescents in the city of Recife, through studies carried out in the region, it is observed that there is an ascending curve, and the increase in overweight/obesity constituting an alarming problem. Leal et al. using data from the III State Health and Nutrition Survey (PESN), carried out in 2006, found a prevalence of 16.2% of excessive weight among children and adolescents aged 5–19 years in the metropolitan region of Recife, 15% among adolescents aged 10–19 years.15 The study by Pinto et al. (2010), found a prevalence of excessive weight in 2007 of 20.4% in adolescents aged 10–14 years old in the capital of Pernambuco.20 And a study conducted in 2014 found a prevalence of excessive weight of 36.4% among adolescents aged 10–19 years, in a low-income neighborhood of Recife.21
The study of Pinto et al. (2010) conducted Recife, Pernambuco, found a prevalence of overweight and obesity of 15.9% and 4.5%, respectively.20 In the present study, in the age group of adolescents from 12 to 14 years old, we found a prevalence of overweight (9.4%) and obesity (6.5%). Thus, we observed that despite the reduction in overweight, there was a significant increase (51%) in the prevalence of obesity.
In this study, several determinants of excessive weight were analyzed considering its multifactorial nature in a population-based sample. Among the biological determinants, that adolescents of a younger age group were more likely to be excessive weight, corroborating with a previous study.22 It is possible that in this group older adolescents are more concerned with weight and body shape, leading them to perform restrictive behaviors (restrictive diets and fasting) and this may have protected them from being overweight. Because the cult of female thinness is widespread in the media, concerns about body weight are more frequent among women and this may have been the reason why the prevalence of overweight was lower in females when compared to males in our study.
In the present study, excessive weight was associated with the post-pubertal maturation stage, a contradictory fact, since excessive weight was also associated with younger chronological age. It is known that in adolescence, chronological age plays a secondary role since adolescents of the same age are often at different stages of puberty. Thus, the nutritional assessment of adolescents is complex since puberty events are more associated with maturation stages than chronological age. Therefore, age alone is not able to predict the degree of development of puberty in which the adolescent is, as he/she is influenced by both intrinsic and environmental factors.23 In another study, higher BMI was associated with the final stages of sexual maturation, with girls being associated with increased body fat and fat-free mass, and boys with increased fat-free mass.20
In relation to socioeconomic factors, the higher prevalence of excessive weight was associated with the private education network and the higher number of televisions in the residence, that is, the best financial condition. Brazilian adolescents with better financial conditions and from private schools are more likely to be sedentary, and factors such as time of practice of moderate-vigorous physical activities, the total time of sedentary lifestyle and sleep time are associated. However, inequities related to screen time seem to be the main responsible for this condition.24 Despite the association found, many studies indicate that being excessive weight becomes increasingly prevalent in disadvantaged social classes as a result of a dietary pattern with low nutritional value, with more calories and yet low cost.21
Among lifestyle factors, the habit of not consuming breakfast daily was associated with being excessive weight, even after adjusting for multivariate analysis. The omission of breakfast and the substitution of meals for quick snacks is a common habit among adolescents.25 The study indicated a positive association between skipping breakfast and markers of global and abdominal adiposity (BMI, waist circumference, waist-to-height ratio) regardless of sex. Breakfast should provide 25% of the recommended daily energy intake, and the omission habit contributes to an unbalanced diet and increased energy intake throughout the day.26
Adolescents who sometimes reported buying snacks in the school cafeteria had a 69% higher risk of being excessive weight, which can be explained by the nutritional inadequacy of snacks purchased in these places. In addition, can be suggested, but not stated based on the information obtained in this study, that snacks brought from home to school by adolescents may also have inadequate nutritional composition, because adolescents who “sometimes” buy snacks in the canteen certainly take them from home, in the other part of the time (a small portion of adolescents consumed school meals). In addition, the prevalence of excessive weight among those who “never” and those who “almost/every day” buy snacks in the canteen were similar.
The change in eating patterns that have occurred in the last four decades healthy snacks have been replaced by junk food, snacks with excessive amounts of sugar, sodium, saturated and trans fats, and with high energy density. Childhood and adolescence are phases in which eating habits can last during adulthood and the inclusion of junk food from an early age characterizes an inappropriate eating habit, which can cause excessive weight and chronic diseases. It is important to highlight that these habits are subject to the influence of peers, the search for group acceptance, in addition to greater palatability, practicality and advertising of such foods.27
In the present study, the consumption of snacks in front of screens was observed in more than half of the adolescents and was associated with excess weight, even after multivariate analysis. However, the associations did not present the expected standard, since those who reported “never consuming” and “sometimes consuming snacks in front of screens” presented 75% and 29% risk of being excessive weight, respectively, in contrast to other studies.21,28 Possibly, had been necessary to reformulate this question in the interview form (answered by the adolescent through the PDA), to make it clear that the “screen” referred does not only concern television, but also equipment such as cell phones, video games, tablets, and computers.
The consumption of carbohydrates and lipids was higher among eutrophic adolescents when compared to those with excessive weight, thus contradicting the initial hypothesis of an association between diet and excessive weight. Similar results were found by other authors from studies with adolescents.29,30 Reverse causality can be identified as responsible for this finding. This result may also be due to bias such as the omission of food consumed by those overweight or obese, or restriction of dietary intake at the time of the study, typical of cross-sectional research.
As a limitation of the research, it is not possible to infer causality relationships because it is a cross-sectional study, where the outcome and independent variables are analyzed simultaneously and punctually. Furthermore, it was not possible to carry out analyzes of the adolescents’ body composition. Another limitation was the use of a single R24H to assess food consumption in view of the fact that it does not characterize habitual consumption. However, this option was valid for the present study in view of the representative sample number, being able to provide mean estimates of energy and nutrient intake.
The results of this study show that the prevalence of overweight and obesity in adolescents in Recife is high and confirms that the distribution of excess weight is associated with different factors. A lower age group, a higher level of sexual maturation, higher purchasing power and eating habits were associated with excessive weight in the population studied. Immediate public policies are needed to combat overweight/obesity in adolescence, which consider the determining factors of the problem, since it is a complex life cycle phase, where individuals are vulnerable due to physical, physiological, psychological, and environmental change.
FundingFINEP (Study and Project Funding Agency) (grant number: 01090421) and CNPq (National Council of Scientific and Technological Research) (grant numbers: 565037/2010-2, 405.009/2012-7).
Conflicts of interestThe authors declare no conflicts of interest.


