
To verify the influence of low birth weight and rapid postnatal weight gain and associated factors on blood pressure in adolescence in a population of low socioeconomic status, considering that injuries occur in the perinatal period can be predictors of future metabolic changes and are still poorly explored.
MethodsA cohort study was carried out with 208 adolescents, 78 born with low weight and 130 born with appropriate weight. The infants were followed up during the first six postnatal months and reassessed at 8 and 18 years of age. The independent variables were birthweight and postnatal weight gain. Rapid postnatal weight gain was defined when above 0.67 z score. The co-variables were sex, maternal height and family income at birth, nutritional status at eight years old, socioeconomic conditions, nutritional status, fat mass index, and physical activity level at 18 years. The outcome variable was blood pressure at 18 years old. The bivariate and multivariable logistic regression analysis were realized and p < 0,05 was considered significant.
ResultsThe proportion of adolescents with elevated blood pressure was 37.5%. The multivariable logistic regression analysis showed the variables independently associated with a higher chance of elevated blood pressure in adolescence were rapid postnatal weight gain (OR = 2.74; 95% CI 1.22–6.14; p = 0.014), male sex (OR = 4.15; 95% CI 1.66–10.38; p = 0.002) and being physically active (OR = 2.70; 95% CI 1.08–6.74; p = 0.034).
ConclusionsThe rapid postnatal weight gain was a predictor for elevated blood pressure in adolescence, independently of other factors.
Hypertension appears more frequently throughout adulthood, however, an increase in the number of cases in children1 and adolescents2 has been observed. Factors related to increased blood pressure (BP) should be controlled in childhood, considering that the occurrence of high BP in childhood/adolescence is related to hypertension in adulthood.3
Hypertension is resulting from diverse factors, such as the aging process, a poor-quality diet, inadequate physical activity, excess weight, and exposure to persistent stress.4 In adolescents, other factors can be associated with hypertension, these can start even in the early stages of the life cycle and during growth phases.5
The concept of the Developmental Origin of Health and Disease proposes that disturbances that occur at critical stages of development, such as the perinatal period, may be the first predictors of future metabolic problems.6 Thus, low birth weight, a proxy for fetal growth restriction7 and rapid postnatal weight gain, a compensatory growth mechanism,8 may be early related factors to higher blood pressure levels in later stages of the life cycle, still little investigated, mainly in populations born in regions of low socioeconomic status.
Therefore, the present study aimed to verify the influence of low birthweight and rapid postnatal weight gain and associated factors on blood pressure in adolescence in a population of low socioeconomic status.
MethodsSetting and populationA cohort study was conducted with 208 children recruited at birth, followed up for the first six months of life, and reevaluated at eight and 18 years old. This study was conducted at six maternities in urban areas of five cities of the Zona da Mata in the state of Pernambuco, northeastern Brazil.9
Birth cohort and follow-up dataInformation from the birth cohort, follow-up and reassessment at eight years were described by Ashworth et al.9 and Amorim et al. 10
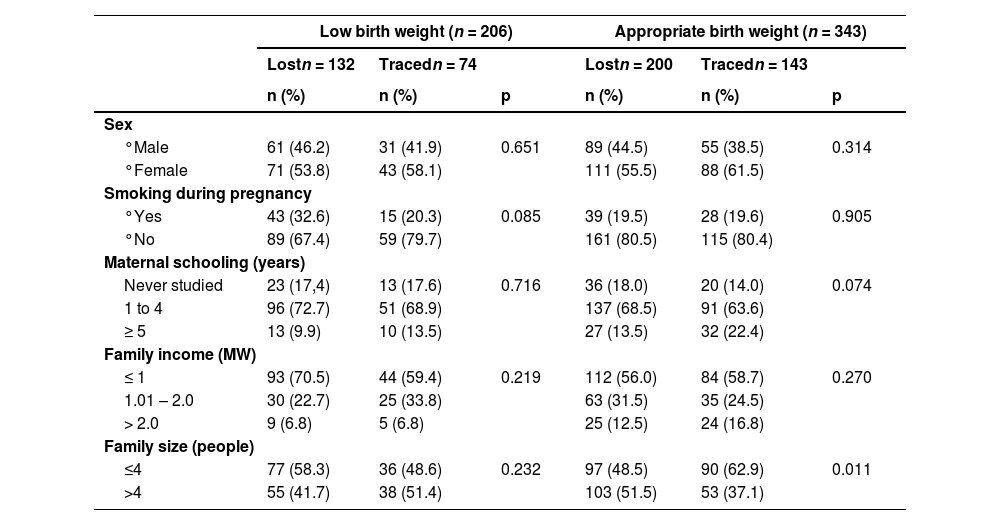
Between April and September 2012, at 18 years old, 217 adolescents were found and reevaluated with regard to socioeconomic status, family income per capita, anthropometric characteristics (weight, height, and waist circumference), blood pressure, percentage of body fat, and level of physical activity. Follow-up losses accounted for 60.5% of the initial sample. Most losses occurred due to difficulty locating individuals and changes of address to another state. Despite the losses, no statistically significant differences were found between those who remained in the study and who dropped out (Table 1).
Socioeconomic and maternal characteristics at birth of adolescents traced and those lost to follow-up according to birth weight.
Yates corrected chi-square. Significance level p ≤ 0.05.
MW, minimum wage.
Therefore, after 18 years of recruitment, 217 adolescents were found - 74 with low birth weight and 143 with adequate birth weight. The sample size of the present study consisted of 208 adolescents (71 with LBW and 137 with ABW) whose BP was measured (nine adolescents were not analyzed because the cuff of the equipment was inadequate due to obesity). The adolescents in the sample of this study were those with data from six months, eight and 18 years old.
Variables of interestThe independent variables were birthweight and postnatal weight gain. The following were the covariables in each evaluation phase: at birth – child's sex, mother's height and exposure to smoke during pregnancy, family income; at eight years of age: body mass index (BMI), waist circumference and gain in BMI between six months and eight years; at 18 years of age: per capita family income, gain in BMI between eight and 18 years, height, BMI, fat mass index, and physical activity level. The outcome variable was blood pressure at 18 years old.
Anthropometric evaluationAnthropometric measurements and gestational age were assessed as described by Asworth et al.9 Weight at birth and at 6 months was measured using a portable digital scale with a capacity of 15 kg and sensitivity of 10 g (Soehnle model 725, Hamburg, Germany). At 6 months, weight and length were measured during household visits. The length was measured with a neonatal anthropometer with an accuracy of 0.1 cm (Harpenden Infantomer, Holtain Ltd, Crymych, UK).
Postnatal weight gain was classified as rapid when the difference in the Z score for the weight for age index between six months of age and birth was more than 0.67 standard deviations,9 considering the curves of the WHO.11
At school age (between eight years and eight years and five months), the children were weighed with a Filizola digital scale (São Paulo, Brazil), with a capacity of 150 kg and an accuracy of 0.1 kg. Height was measured with a moving scale stadiometer (Leicester Height Measure, Child Growth Foundation) with an accuracy of 0.1 cm. BMI according to age and sex was calculated with the aid of the Anthro Plus software and classified as excess weight (when higher than one standard deviation) or normal weight (≤ one standard deviation), considering the curves of the WHO.12 Waist circumference was measured at the midpoint between the edge of the last rib and the iliac crest using a non-elastic metric tape (Lasso; Child Growth Foundation). The measurement was performed in triplicate for all individuals and the mean of the three values was considered for the data analysis. The cutoff point for the classification of high central fat mass was the 80th percentile proposed by Taylor et al.13
The weight and height of the adolescents, at age 18.6 years (SD 0.03), were determined using a digital scale (Filizola) with a capacity of up to 150 kg and was recorded with a precision of 0.1 kg and using a stadiometer with a moving scale (Leicester Height Measure – Child Growth Foundation), respectively, according to the recommended techniques by Gibson.14 These parameters were used for the calculation of the BMI (kg/m2). Median height according to sex was considered as the cutoff point to establish categories.
BMI at six months, eight and 18 years old was transformed into z scores based on the distribution curve of the studied population. Differences in BMI in z scores between eight years and six months and between 18 years and eight years were considered to determine the growth gain in these periods. The same cutoff point for weight gain between birth and six months was adopted.
Waist circumference was measured on the adolescents in the same manner as performed at eight years old. The waist circumference of three female adolescents who were pregnant for more than 12 weeks was not considered in the study.
Bioelectrical impedance analysisBioelectrical impedance analysis (BIA) was performed to determine the body composition of the adolescents using the Maltron tetrapolar BF-906 device. The adolescents were instructed to avoid physical exercise in the 12 h prior to the exam, not ingest alcohol, tea, coffee, effervescent or energy beverages in the 24 h prior to the exam, eat up to three hours prior to the exam, and urinate 30 min prior to the exam. The measurement techniques recommended by Lukaski et al.15 were used. Pregnant adolescents, those suspected to be pregnant, and those who did not follow the instructions were not submitted to this evaluation, which led to the exclusion of 12 subjects.
The fat weight obtained through BIA was used to identify the proportion of body fat mass using the fat mass index [fat mass (kg)/height squared (m2)].16 Adolescents with a fat mass index higher than the median for their sex were considered to have excess body fat.
Physical activityThe level of physical activity was classified based on intensity, frequency and duration of activity on a weekly basis. For such, the short version of the International Physical Activity Questionnaire (IPAQ) was used.17 Individuals who did not practice any physical activity and those who practiced only light activities were classified as sedentary, whereas those who practiced light activities plus moderate or intense activities and those who practiced moderate or intense activities were classified as active.
Blood pressureBP was measured on the right arm, which was relaxed and supported on a table, with the adolescent in the sitting position with feet supported on the floor. A digital device (Omron, HEM FL 31) with a precision of 1 mmHg and a 22–42 cm cuff was used. The reading was performed twice after five minutes of rest and with a five-minute rest period between readings. When the difference between readings was more than 1 mmHg, a third reading was performed 10 min after the first reading. The mean of the two closest readings was used for analysis. Values of > 120 mmHg for systolic pressure and/or > 80 mmHg for diastolic pressure were considered for the classification of elevated blood pressure.18
Statistical analysisThe processing of the data was performed with the aid of the Statistical Package for the Social Sciences, version 15.0 for Windows (SPSS Inc., Chicago, IL, USA). The normality of the outcome variables was verified by the Kolmogorov-Smirnov test and the null hypothesis was accepted. The systolic and diastolic blood pressure were treated as continuous variables and the hypothesis of difference in means of systolic and diastolic pressure was verified by the Student's t Test. Pearson's correlation analysis was performed and multicollinearity was observed between BMI and waist circumference at 8 years and BMI and waist circumference at 18 years old. Subsequently, blood pressure was categorized and the difference in proportion between high and normal blood pressure was verified by Pearson's chi-square test. A significance level of 5% (p ≤ 0.05) was used.
Multivariate logistic regression was used to verify the predictive effect of the independent variables on the outcomes and a block modeling process was used, considering a logical relationship between the exposure variables and the outcome. All variables with a p-value < 0.10 in the bivariate analysis were selected for the regression analysis. As BMI and waist circumference were highly correlated, only the latter was included in the regression analysis due to its relation to greater cardiovascular risk and the quantity of visceral adipose tissue.19 All variables remained in the final model and a statistical significance (p < 0,05) was considered.
Ethical aspectsThis study was approved by the Human Research Ethics Committee of the Center for Health Sciences of the Federal University of Pernambuco (number: 336/08). Written informed consent was signed by their legal guardians.
ResultsAmong the 208 adolescents evaluated, the female sex accounted for 59.6% and the prevalence of elevated blood pressure was 37.5%. A total of 66.6% of the adolescents had a per capita family income less than half the Brazilian monthly minimum wage and 20.2% had excess weight. Low birthweight was found in 32.1% and rapid weight gain from birth to six months among 39.7%.
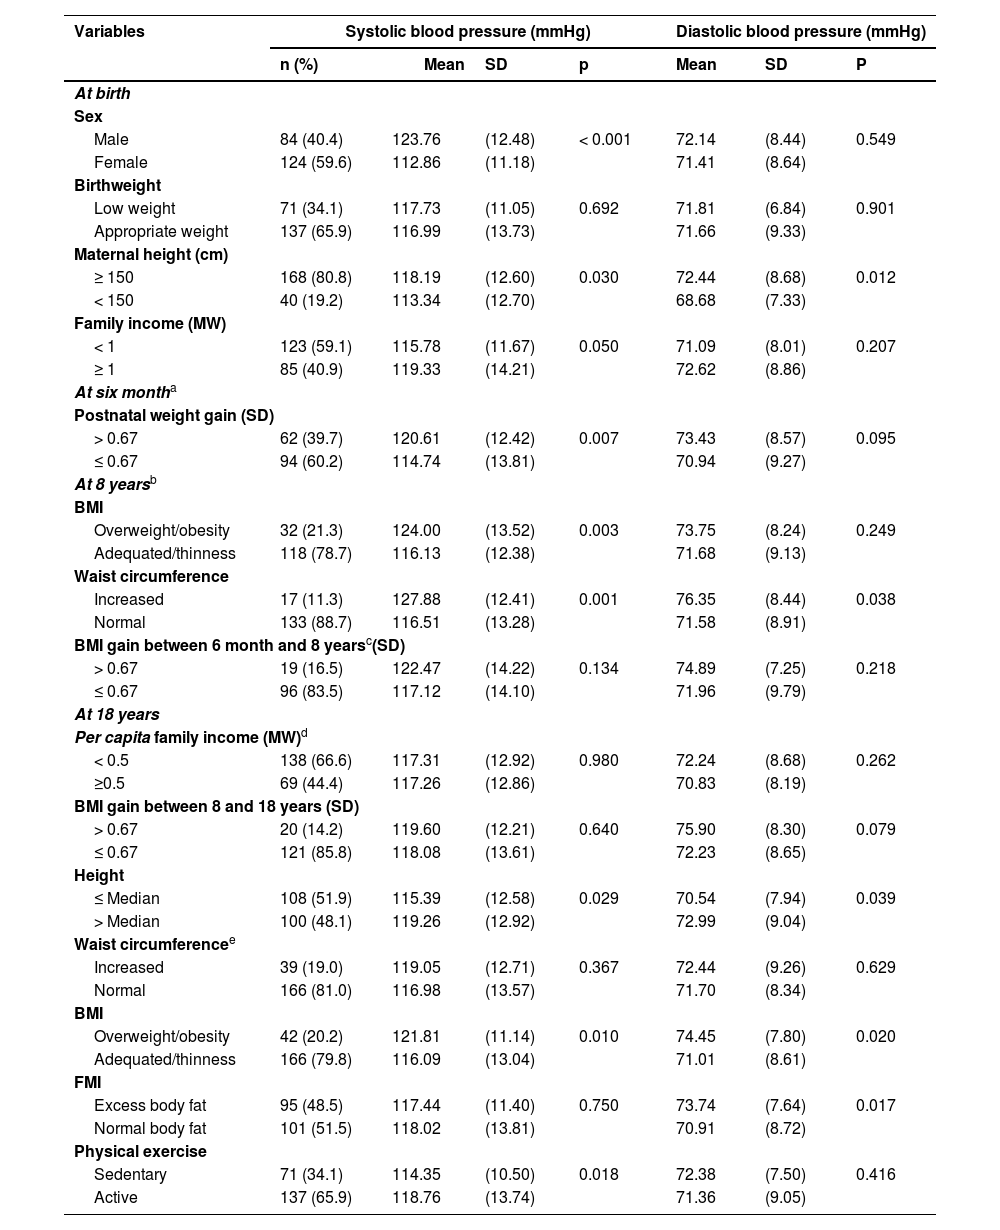
Table 2 shows the variables associated with higher systolic blood pressure in adolescence were: male gender, higher mothers, family income equal to or higher than the Brazilian monthly minimum wage at birth; rapid postnatal weight gain at 6 months, excess weight and waist circumference elevated at eight years and, at 18 years, height above the median, overweight and being physically active.
Mean systolic and diastolic blood pressure of adolescents according to variables at birth, in childhood and adolescence.
| Variables | Systolic blood pressure (mmHg) | Diastolic blood pressure (mmHg) | ||||||
|---|---|---|---|---|---|---|---|---|
| n (%) | Mean | SD | p | Mean | SD | P | ||
| At birth | ||||||||
| Sex | ||||||||
| Male | 84 (40.4) | 123.76 | (12.48) | < 0.001 | 72.14 | (8.44) | 0.549 | |
| Female | 124 (59.6) | 112.86 | (11.18) | 71.41 | (8.64) | |||
| Birthweight | ||||||||
| Low weight | 71 (34.1) | 117.73 | (11.05) | 0.692 | 71.81 | (6.84) | 0.901 | |
| Appropriate weight | 137 (65.9) | 116.99 | (13.73) | 71.66 | (9.33) | |||
| Maternal height (cm) | ||||||||
| ≥ 150 | 168 (80.8) | 118.19 | (12.60) | 0.030 | 72.44 | (8.68) | 0.012 | |
| < 150 | 40 (19.2) | 113.34 | (12.70) | 68.68 | (7.33) | |||
| Family income (MW) | ||||||||
| < 1 | 123 (59.1) | 115.78 | (11.67) | 0.050 | 71.09 | (8.01) | 0.207 | |
| ≥ 1 | 85 (40.9) | 119.33 | (14.21) | 72.62 | (8.86) | |||
| At six montha | ||||||||
| Postnatal weight gain (SD) | ||||||||
| > 0.67 | 62 (39.7) | 120.61 | (12.42) | 0.007 | 73.43 | (8.57) | 0.095 | |
| ≤ 0.67 | 94 (60.2) | 114.74 | (13.81) | 70.94 | (9.27) | |||
| At 8 yearsb | ||||||||
| BMI | ||||||||
| Overweight/obesity | 32 (21.3) | 124.00 | (13.52) | 0.003 | 73.75 | (8.24) | 0.249 | |
| Adequated/thinness | 118 (78.7) | 116.13 | (12.38) | 71.68 | (9.13) | |||
| Waist circumference | ||||||||
| Increased | 17 (11.3) | 127.88 | (12.41) | 0.001 | 76.35 | (8.44) | 0.038 | |
| Normal | 133 (88.7) | 116.51 | (13.28) | 71.58 | (8.91) | |||
| BMI gain between 6 month and 8 yearsc(SD) | ||||||||
| > 0.67 | 19 (16.5) | 122.47 | (14.22) | 0.134 | 74.89 | (7.25) | 0.218 | |
| ≤ 0.67 | 96 (83.5) | 117.12 | (14.10) | 71.96 | (9.79) | |||
| At 18 years | ||||||||
| Per capita family income (MW)d | ||||||||
| < 0.5 | 138 (66.6) | 117.31 | (12.92) | 0.980 | 72.24 | (8.68) | 0.262 | |
| ≥0.5 | 69 (44.4) | 117.26 | (12.86) | 70.83 | (8.19) | |||
| BMI gain between 8 and 18 years (SD) | ||||||||
| > 0.67 | 20 (14.2) | 119.60 | (12.21) | 0.640 | 75.90 | (8.30) | 0.079 | |
| ≤ 0.67 | 121 (85.8) | 118.08 | (13.61) | 72.23 | (8.65) | |||
| Height | ||||||||
| ≤ Median | 108 (51.9) | 115.39 | (12.58) | 0.029 | 70.54 | (7.94) | 0.039 | |
| > Median | 100 (48.1) | 119.26 | (12.92) | 72.99 | (9.04) | |||
| Waist circumferencee | ||||||||
| Increased | 39 (19.0) | 119.05 | (12.71) | 0.367 | 72.44 | (9.26) | 0.629 | |
| Normal | 166 (81.0) | 116.98 | (13.57) | 71.70 | (8.34) | |||
| BMI | ||||||||
| Overweight/obesity | 42 (20.2) | 121.81 | (11.14) | 0.010 | 74.45 | (7.80) | 0.020 | |
| Adequated/thinness | 166 (79.8) | 116.09 | (13.04) | 71.01 | (8.61) | |||
| FMI | ||||||||
| Excess body fat | 95 (48.5) | 117.44 | (11.40) | 0.750 | 73.74 | (7.64) | 0.017 | |
| Normal body fat | 101 (51.5) | 118.02 | (13.81) | 70.91 | (8.72) | |||
| Physical exercise | ||||||||
| Sedentary | 71 (34.1) | 114.35 | (10.50) | 0.018 | 72.38 | (7.50) | 0.416 | |
| Active | 137 (65.9) | 118.76 | (13.74) | 71.36 | (9.05) | |||
M, minimum wage (equivalent to US70); BMI, body mass index; FMI, fat mass index.
Student's t-test.
Higher mean diastolic arterial pressure was found among adolescents whose mothers were taller, had a high waist circumference at eight years of age and was taller, and had excess weight and excess body fat at 18 years old.
Birth weight correlated with waist circumference (0.179; p = 0.025) and BMI at 8 years (0.160; p = 0.045). At 8 years old, BMI showed a strong correlation with waist circumference at this age (0.936; p < 0.001) and correlated with BMI (0.246; p = 0.003) and waist circumference (0.254; p = 0.002) at 18 years old. Height and waist circumference at 18 years old were correlated (0.192; p = 0.005). BMI and waist circumference at age 18 showed a strong correlation (0.916; p < 0.001) (data not presented in the table).
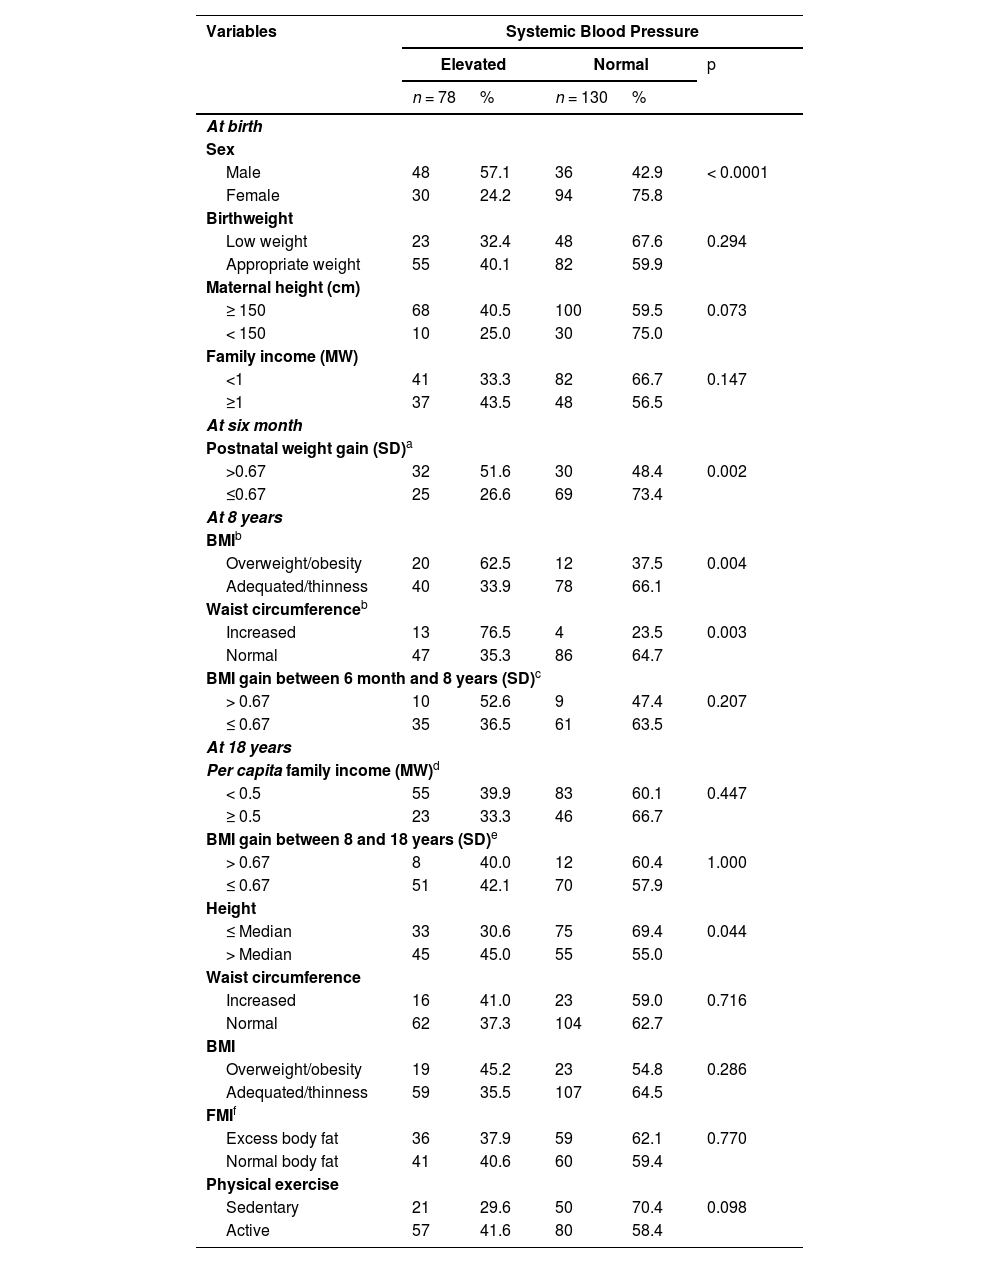
Table 3 shows the greater frequency of elevated blood pressure in adolescence was found among males, those who had rapid postnatal weight gain, excess body weight, a high weight circumference, and among those taller in adolescence.
Frequency of systemic arterial blood pressure in adolescents according to variables at birth, in childhood and adolescence.
| Variables | Systemic Blood Pressure | ||||
|---|---|---|---|---|---|
| Elevated | Normal | p | |||
| n = 78 | % | n = 130 | % | ||
| At birth | |||||
| Sex | |||||
| Male | 48 | 57.1 | 36 | 42.9 | < 0.0001 |
| Female | 30 | 24.2 | 94 | 75.8 | |
| Birthweight | |||||
| Low weight | 23 | 32.4 | 48 | 67.6 | 0.294 |
| Appropriate weight | 55 | 40.1 | 82 | 59.9 | |
| Maternal height (cm) | |||||
| ≥ 150 | 68 | 40.5 | 100 | 59.5 | 0.073 |
| < 150 | 10 | 25.0 | 30 | 75.0 | |
| Family income (MW) | |||||
| <1 | 41 | 33.3 | 82 | 66.7 | 0.147 |
| ≥1 | 37 | 43.5 | 48 | 56.5 | |
| At six month | |||||
| Postnatal weight gain (SD)a | |||||
| >0.67 | 32 | 51.6 | 30 | 48.4 | 0.002 |
| ≤0.67 | 25 | 26.6 | 69 | 73.4 | |
| At 8 years | |||||
| BMIb | |||||
| Overweight/obesity | 20 | 62.5 | 12 | 37.5 | 0.004 |
| Adequated/thinness | 40 | 33.9 | 78 | 66.1 | |
| Waist circumferenceb | |||||
| Increased | 13 | 76.5 | 4 | 23.5 | 0.003 |
| Normal | 47 | 35.3 | 86 | 64.7 | |
| BMI gain between 6 month and 8 years (SD)c | |||||
| > 0.67 | 10 | 52.6 | 9 | 47.4 | 0.207 |
| ≤ 0.67 | 35 | 36.5 | 61 | 63.5 | |
| At 18 years | |||||
| Per capita family income (MW)d | |||||
| < 0.5 | 55 | 39.9 | 83 | 60.1 | 0.447 |
| ≥ 0.5 | 23 | 33.3 | 46 | 66.7 | |
| BMI gain between 8 and 18 years (SD)e | |||||
| > 0.67 | 8 | 40.0 | 12 | 60.4 | 1.000 |
| ≤ 0.67 | 51 | 42.1 | 70 | 57.9 | |
| Height | |||||
| ≤ Median | 33 | 30.6 | 75 | 69.4 | 0.044 |
| > Median | 45 | 45.0 | 55 | 55.0 | |
| Waist circumference | |||||
| Increased | 16 | 41.0 | 23 | 59.0 | 0.716 |
| Normal | 62 | 37.3 | 104 | 62.7 | |
| BMI | |||||
| Overweight/obesity | 19 | 45.2 | 23 | 54.8 | 0.286 |
| Adequated/thinness | 59 | 35.5 | 107 | 64.5 | |
| FMIf | |||||
| Excess body fat | 36 | 37.9 | 59 | 62.1 | 0.770 |
| Normal body fat | 41 | 40.6 | 60 | 59.4 | |
| Physical exercise | |||||
| Sedentary | 21 | 29.6 | 50 | 70.4 | 0.098 |
| Active | 57 | 41.6 | 80 | 58.4 | |
MW, minimum wage; BMI, body mass index; FMI, fat mass index.
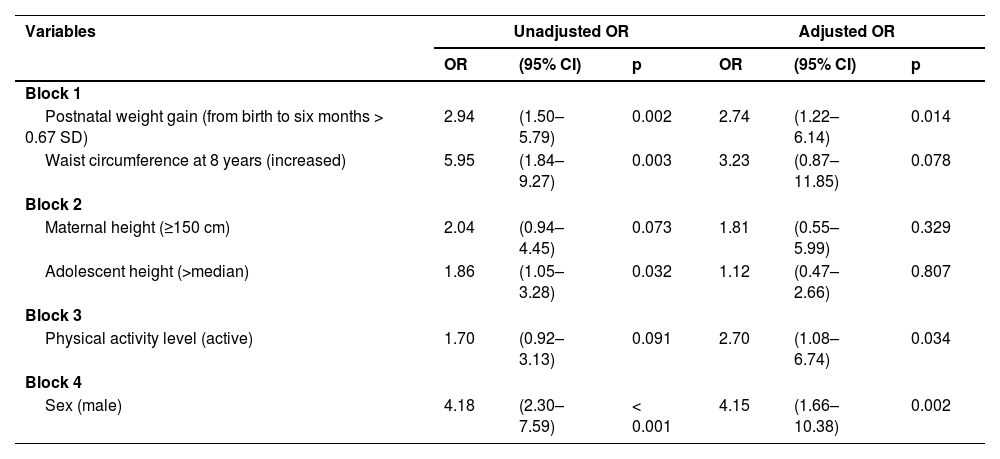
Table 4 presents the results of the logistic regression analysis of factors associated with elevated blood pressure in adolescence. Rapid weight gain in the first six months of life, being physically active, and being male were the variables that remained associated with elevated blood pressure at 18 years old, with the biological determinant (sex) being the variable with the highest odds-adjusted ratio (4.15), followed by rapid weight gain in the first six months of life (OR 2.74) and physical activity (OR 2.70). Although waist circumference lost statistical significance (p = 0.078), it had a relevant OR 3.23, with important biological significance.
Logistic regression of factors associated with elevated blood pressure in adolescents aged 18 years.
Reference categories: Block 1. Postnatal weight gain (from birth to six months ≤ 0.67SD); Waist circumference (normal).
Block 2. Maternal height (< 150 cm); Adolescent height (≤ median). Block 3. Physical activity level (sedentary). Block 4. Sex (female).
This study investigated the influence of intrauterine growth and early rapid weight gain and associated factors on blood pressure in adolescents of low socioeconomic status. The authors identified that rapid postnatal weight gain, but not low birthweight, was an associated factor with a greater chance of elevated blood pressure in adolescence and being male and having a higher level of physical activity was also associated with higher levels of blood pressure.
Low birthweight is associated with a greater risk of rapid postnatal weight gain8. However, this compensatory mechanism can lead to changes in hormone concentrations and hormonal sensitivity in different tissues, the inadequate development of organs, and, consequently, a predisposition to metabolic and cardiovascular complications in adulthood, including hypertension.20
Bustos et al.,21 reported no association between low birthweight and higher BP in adolescence and in environments with a low social economic status, the association between low birthweight and higher BP levels was found when children also exhibited rapid postnatal weight gain. Apparently, only the rapid postnatal weight gain was at greater risk for hypertension.22 This suggests that rapid weight gain may be an early determinant of the risk for hypertension in subsequent phases of the life cycle.
Regarding the effect of postnatal weight gain on health in adulthood, Metcalfe and Monaghan23 presented the notion of “grow now, pay later”, by which rapid growth at the onset of life is associated with metabolic and cardiovascular complications in adulthood. Singhal et al.24 concluded that rapid weight gain at the onset of life, independently of the type of feeding in this period, promoted an increase in BP at six and eight years of age. The same findings were seen in adolescence.22
The mechanisms involved in the late-onset increase in BP after rapid postnatal weight gain have not yet been clarified. According to Singhal,25 rapid postnatal weight gain is associated with obesity, low sensitivity to insulin, low HDL cholesterol, high triglyceride levels, and markers of atherosclerosis at 18 years old. These factors predispose individuals to hypertension and the risk of cardiovascular disease.
Park et al.26 finding an association between low birth weight and rapid weight gain with increased uric acid and BP at three years of age and suggest that being born with a low weight leads to less development of the renal system, promoting hyperfiltration due to the lower number of nephrons and systemic hypertension. This response may be more accentuated in those with rapid postnatal weight gain. Besides the lower number of nephrons, there is also a lower quantity of glomeruli, which, when associated with the increase in metabolic demand stemming from the accelerated weight gain, leads to the early development of hypertension.26
Children with a high waist circumference at eight years of age were threefold more likely to have elevated blood pressure in adolescence. This association had borderline significance in multivariate logistic regression, probably due to the small sample size. This association has biological relevance, as a high waist circumference indicates greater deposition of body fat, especially visceral fat, an independent predictor of morbidity and mortality from cardiovascular diseases.19 Therefore, it warrants further investigation.
Adolescents active had a greater likelihood of elevated blood pressure. This finding is contrary to the well-documented benefits of physical activity regarding the prevention and control of hypertension.27 Teh et al.28 reported a similar result and justified this unexpected finding as a possible overestimation of physical activity performed by the respondents because the IPAQ is self-reported. According to Lee et al.,29 there is a possible overestimation in the level of physical activity reported through the IPAQ of around 84%.
A higher probability of high blood pressure was found in male adolescents. According to Maranon and Reckelhoff,30 this finding may be secondary to sex hormones, as female hormones are associated with protective factors (vasodilation, reduced angiotensin II synthesis and reduced response to aldosterone), and androgens contribute to greater activation of the nervous system sympathetic, increased sodium reuptake in the proximal tubule and increased angiotensin synthesis). Differences between sex also mediate the relationships of catecholamines in alpha and beta-adrenergic receptors, promoting greater sympathetic activity and, consequently, increased BP in men.30
After 18 years of follow-up, it was possible to investigate whether deviations from normal growth that occurred during the “window of opportunity” for child development could be risk factors for future health problems, however, the present study has limitations to be considered. Losses to follow-up are common in longitudinal studies, especially in developing countries, and prevent the assessment of all individuals at all stages of the investigation. It was not possible to assess body fat with other more accurate methods and to investigate the association with blood pressure. Added to this, it would be important to assess the level of physical activity through a more accurate instrument.
The authors cannot disregard the possibility of confounding bias, considering that anthropometric and growth variables may be associated at the same time with exposure to the outcome. However, the authors minimized this risk by verifying the biological relationship between the variables and applied correlation analysis to verify multicollinearity.
The authors can consider that rapid weight gain in the first months after birth, but not birth weight is a factor associated with higher blood pressure in adolescence in children born in precarious socioeconomic conditions. Therefore, greater attention to the evolution of blood pressure in these children is necessary. Special attention should also be observed in children who have an increased waist circumference at school age. More studies can be applied in different populations to ratify and identify other risk factors.
FundingWellcome Trust-UK (Grant Numbers: 036605/Z/92, 064220Z/01Z) and the Conselho Nacional de Desenvolvimento Científico e Tecnológico (CNPq [National Council of Scientific and Technological Development], Brazil (grant numbers: 476891/2001–9, 472706/2009–8)
The authors deeply appreciate the participation of the mothers, children and adolescents and the dedication of the field workers during the data collection process.


