

The relationship between lipid metabolism and pneumonia in under-five children remains unclear. The aim of the study was to explore the association of several lipids, lipoproteins and apolipoproteins with the risk of childhood pneumonia, and to initially reveal the mechanisms involved.
MethodsThere were 1000 children with confirmed severe pneumonia and 1000 healthy controls (18–59 months old) in the study. Serum levels of several lipids, lipoproteins and apolipoproteins were measured. The occurrence of hypoxaemia and serum level of C-reactive protein were recorded. Multivariate logistic regression and spearman correlation analysis were adopted to assess the correlation between these variables to achieve the research objective.
ResultsFirst, higher triglycerides, total cholesterol, LDL cholesterol, VLDL cholesterol and apolipoprotein B levels were associated with the elevated risk of severe pneumonia (OR: 1.407, 95%CI: 1.336∼1.480; OR: 1.947, 95%CI: 1.741∼2.175; OR: 1.153, 95%CI: 1.116∼1.189; OR: 1.310, 95%CI: 1.222∼1.404; OR: 1.075, 95%CI: 1.003∼1.151). Higher HDL cholesterol and apolipoprotein A1 levels were associated with a decreased risk of the disease (OR: 0.903, 95%CI: 0.873∼0.933; OR: 0.921, 95%CI: 0.891∼0.952). Second, higher triglycerides level was associated with an increased risk of hypoxemia in these children (OR: 1.142, 95%CI: 1.072∼1.215). Third, serum HDL cholesterol level was linearly associated with C-reactive protein level in these children (ρ = -0.343, P < 0.001).
ConclusionAbnormal levels of several lipids, lipoproteins and apolipoproteins were related to severe childhood pneumonia. The findings that triglycerides and HDL cholesterol were respectively implicated in hypoxaemia and inflammation might partly explain the mechanisms linking lipid metabolism to severe pneumonia.
Pneumonia is one of the leading causes of death in children under the age of five all around the world.1,2 According to statistics, pneumonia caused more than 800,000 childhood deaths in 2017, which accounts for 15% of all deaths of under-five children that year.2 In China, the prevalence of childhood pneumonia is also very high.3 The disease not only seriously affects the children's health, but also significantly increases the financial burden on their families and the psychological burden on their guardians.4 Although doctors have made great efforts to treat pneumonia and reduce mortality, the results have not been satisfactory.5 One very important reason for this is that a great number of factors may influence the susceptibility and prognosis of pneumonia, such as socioeconomic status, malnutrition, and so on.2
Currently, obesity has gradually become a new global health problem in children under the age of five.6 One published study reported a prognostic significance of obesity and overweight on pneumonia in this group of children.7 Then, whether lipid metabolism was also related to childhood pneumonia attracted the attention of researchers. But a series of related studies failed to provide consistent results. Some studies believed that the increased levels of some lipid metabolic markers such as triglycerides may worsen the prognosis of childhood pneumonia.8 Others suggested that cholesterol metabolism and the elevated levels of several apolipoproteins may have a protective effect on the disease.9,10 So, a firmed conclusion has not been drawn until then.
Therefore, the present study enrolled 3000 children under the age of five in China to reveal the association of several lipids, lipoproteins, and apolipoproteins with the risk of childhood pneumonia, and to further explore the association of these lipid metabolic markers with the risk of hypoxemia induced by pneumonia and the levels of C-reactive protein (CRP) in serums. The results obtained from the study may help people to determine whether lipid metabolism may be a potential effective factor in childhood pneumonia.
Materials and methodsEthics statementThe study was approved by the ethics committee of Henan provincial people's hospital and was performed in accordance with the Declaration of Helsinki (Supplemental Fig. 1). The guardians of the included children agreed to participate in the study and signed the written consents.
Data sourceThe data of the study were collected from the medical records of Henan provincial people's hospital. Briefly, all patients admitted to the hospital were told that their medical records might be used anonymously for scientific research. If the patients or their families agreed, the written informed consent forms would be signed. After the patients were discharged from the hospital, their medical records would be included in the scientific research database.
SubjectsA total of 1000 children with common pneumonia, and 1000 children with severe pneumonia were randomly included from the database, and all of them were admitted to the hospital between January 2010 and December 2020 due to pneumonia. Their age was limited to 18 to 60 months.
Pneumonia was diagnosed and classified using the criteria of the World Health Organization (WHO), which included: a history of cough or difficulty breathing, and if present, respiratory rate > 50 breaths/minute (age < 12 months) or > 40 breaths/minute (age ≥ 12 months).11 Severe pneumonia indicated that the disease met the above diagnostic criteria and was accompanied by at least one of the danger signs, which included (1) nasal flaring, (2) subcostal retractions, (3) convulsions, (4) Blantyre coma scale < 5, (5) “alert, voice, pain, unresponsive” scale less than “alert” and (6) inability to drink or feed. Common pneumonia was defined as meeting the above diagnostic criteria without the danger signs. Children with tuberculosis infection, congenital lung diseases, dysplasia disorders and other serious diseases were excluded. All the children with pneumonia were treated according to the protocolized guidelines for the diagnosis and treatment of pneumonia in China and the world.11
Other 1000 healthy children were randomly included from the database, and all of them came to the hospital for consultation at the same period, but no obvious disease was detected. They served as controls. Their ages ranged from 18 to 60 months.
Data collection and definitionResearch data were obtained from the database using predefined questionnaires. For the children with pneumonia, age, gender, ethnic group, height, weight, household income, clinical manifestations (i.e., hyperpyrexia, dehydration, diarrhea and hypoxemia), serological data (i.e., serum white blood cell (WBC) count, creatinine level and CRP) and use of antibiotics were collected. For the controls, age, gender, ethnic group, height, weight and household income were collected.
Hyperpyrexia was a body temperature greater than 39°C. Hypoxaemia was defined as SpO2 < 90%. High creatinine referred to plasma creatinine levels greater than 35 mmol/l in infants and greater than 62 mmol/l in children.
Generally, obesity is assessed using the body mass index (BMI), which is calculated based on weight and height. However, children under 60 months of age are in a rapid growth and development phase. To increase the comparability, BMI Z-scores were calculated in the study to standardize the data, and its formula was (BMI - mean of BMI) / (standard deviation of BMI).12 The mean and standard deviation of BMI for the local population were obtained from the local Center for Disease Control and Prevention. A BMIZ score greater than 2.00 was considered overweight, a score greater than 3.00 was diagnosed as obesity, and the score between −2.00 and 2.00 was defined as normal.12
Lipid metabolismThe serum levels of several lipids, lipoproteins and apolipoproteins were adopted to reflect lipid metabolism. The lipid metabolic markers included triglycerides (TG), total cholesterol (TC), low-density lipoprotein cholesterol (LDL-C), very low-density lipoprotein cholesterol (VLDL-C), high-density lipoprotein cholesterol (HDL-C), apolipoprotein A1 (ApoA1), apolipoprotein B (ApoB) and lipoprotein A (Lp-a).
These data were also collected from the database, and the blood specimen collection and testing process was briefly described below. When each child presented to the hospital, his or her fasting venous blood was routinely collected to measure a range of serological markers (such as blood lipids) in order to guide the diagnosis and treatment. The blood sample was immediately sent to the laboratory center of the hospital. After centrifugation and extraction, the serum sample was used to measure the levels of these lipid metabolic markers mentioned above. Serum levels of TG, TC, LDL-C, VLDL-C and HDL-C were detected using an ADVIA-1650 Chemistry System (Bayer Co., USA). Serum levels of ApoA1, ApoB and Lp-a were determined by several latex-particle-enhanced immunonephelometric assays on a BN ProSpec nephelometer (Dade Behring Co., Germany). Each serological marker was measured twice, and their average value was recorded in the database.
Statistical analysisAccording to the Shapiro-Wilk test, all continuous variables in this study did not follow a normal distribution. Therefore, these variables were expressed by medians (25th quartiles, 75th quartiles), while the differences between groups were compared by Kruskal-Wallis H test. Categorical variables were expressed by frequencies, and the difference of the two categorical variables was measured using the Chi-square test. If there were three categorical variables to be compared at the same time, the maximum and minimum values were compared. The linear association of two continuous variables was determined using spearman correlation analysis. A P-value less than 0.05 was considered statistically significant. The Association of the lipids, lipoproteins and apolipoproteins with the risk of childhood pneumonia and hypoxemia was determined using univariate and multivariate logistic regression. The odds ratios (ORs) and 95% confidence intervals (CIs) were reported. In the multivariate analyses, demography data, clinical manifestations, serological data and use of antibiotics were adjusted. If a 95%CI did not include value one, it was considered statistically significant. All analyses were conducted using SPSS 23.0 (USA).
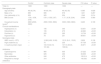
ResultsCharacteristics of the subjects in the studyAs shown in Table 1, compared with the common case group, the children in the severe case group had more opportunities to suffer from hyperpyrexia, dehydration, diarrhea, hypoxemia, high creatinine, high CRP (P < 0.001, P < 0.001, P < 0.001, P < 0.001, P < 0.001, P < 0.001), to receive the cephalosporins treatment (P < 0.001) and to change the antibiotics (P < 0.001). Compared with the severe case group, the children in the common case group had more possibilities to receive the macrolides treatment (P < 0.001). In addition, there was no difference in WBC count between the common case and severe case groups (P = 0.106). There was no difference in age, gender, and nationality, BMI Z-score, and household income among all the three groups (P = 0.826, P = 0.267, P = 0.214, P = 0.080, P = 0.199). Among them, household income indicated average monthly income per capita.
Characteristics of the subjects in the study.a
| Control | Common case | Severe case | F/H value | P value | |
|---|---|---|---|---|---|
| Total (n) | 1000 | 1000 | 1000 | — | — |
| Demography data | |||||
| Age (months) | 48 (42, 54) | 49 (43, 54) | 49 (42, 55) | 0.383 | 0.826 |
| Male (n,%) | 699 | 685 | 676 | 1.231 | 0.267 |
| Han nationality (n,%) | 939 | 925 | 934 | 1.546 | 0.214 |
| BMI Z-score | 1.00 (−0.58, 2.46) | 0.91 (−0.58, 2.67) | 1.17 (−0.35, 2.84) | 5.054 | 0.080 |
| Household income (yuan)b | 2900 (2000, 3900) | 2900 (1900, 3900) | 3000 (1800, 3800) | 3.225 | 0.199 |
| Clinical manifestations | |||||
| Hyperpyrexia (n) | — | 195 | 340 | 53.651 | <0.001 |
| Dehydration (n) | — | 155 | 275 | 42.660 | <0.001 |
| Diarrhea (n) | — | 225 | 295 | 12.734 | <0.001 |
| Hypoxemia (n) | — | 78 | 231 | 89.601 | <0.001 |
| Serological data | |||||
| WBC count (× 109/l) | — | 12.89 (9.69, 16.06) | 12.31 (9.41, 15.93) | 2.609 | 0.106 |
| High creatinine (n) | — | 75 | 235 | 97.729 | <0.001 |
| C-reactive protein (mg/l) | — | 103.19 (54.18, 161.84) | 137.10 (63.03, 198.04) | 45.871 | <0.001 |
| Antibiotics | |||||
| Cephalosporins | — | 865 | 935 | 27.222 | <0.001 |
| Macrolides | — | 625 | 490 | 36.939 | <0.001 |
| Other antibiotics | — | 240 | 475 | 120.214 | <0.001 |
| Required to change antibiotics | — | 310 | 575 | 142.332 | <0.001 |
Continuous variables were expressed by medians (25th quartiles, 75th quartiles). The difference of the continuous variables was measured using Kruskal-Wallis H test. Categorical variables were expressed by frequencies. The difference of two categorical variables was measured using Chi-square test, and the difference of three categorical variables was measured by comparing the maximum and minimum values using Chi-square test.
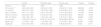
As shown in Table 2, with the exception of Lp-a (P = 0.433), the serum levels of the other lipid metabolic markers differed significantly in the control, common case, and severe case groups (P < 0.001, P < 0.001, P < 0.001, P < 0.001, P < 0.001, P < 0.001, P = 0.014). Briefly, compared with the common case group, the serum levels of TG, TC, LDL-C, and VLDL-C were significantly higher and the serum levels of HDL-C and ApoA1 were significantly lower in the severe case group (P < 0.05). Compared with the control group, the serum level of TC was significantly higher in the common case group (P < 0.05).
Serum levels of lipids, lipoproteins and apolipoproteins in the study.a
| Control | Common case | Severe case | H value | P value | |
|---|---|---|---|---|---|
| Total (n) | 1000 | 1000 | 1000 | ||
| TG (mmol/l) b | 0.83 (0.66, 0.96) | 0.83 (0.67, 0.99) | 0.98 (0.76, 1.19) ‡ | 298.258 | <0.001 |
| TC (mmol/l) | 3.49 (2.73, 4.25) | 3.63 (2.83, 4.38) † | 4.09 (3.26, 4.87) ‡ | 193.845 | <0.001 |
| LDL-C (mmol/l) | 2.01 (1.77, 2.26) | 2.03 (1.76, 2.30) | 2.19 (1.85, 2.49) ‡ | 110.759 | <0.001 |
| VLDL-C (mmol/l) | 0.33 (0.20, 0.45) | 0.33 (0.24, 0.46) | 0.39 (0.26, 0.53) ‡ | 85.380 | <0.001 |
| HDL-C (mmol/l) | 1.36 (1.06, 1.67) | 1.34 (1.08, 1.60) | 1.25 (1.00, 1.49) ‡ | 66.823 | <0.001 |
| Lp-a (mmol/l) | 57.23 (32.77, 84.77) | 58.26 (31.32, 87.33) | 59.42 (29.99, 88.18) | 1.675 | 0.433 |
| ApoA1 (g/l) | 1.17 (0.87, 1.48) | 1.16 (0.88, 1.42) | 1.07 (0.84, 1.34) ‡ | 39.981 | <0.001 |
| ApoB (g/l) | 0.47 (0.36, 0.59) | 0.48 (0.35, 0.62) | 0.48 (0.36, 0.63) | 8.524 | 0.014 |
The serum levels of lipids, lipoproteins and apolipoproteins were expressed using medians (25th quartiles, 75th quartiles). The difference of these markers was measured using Kruskal-Wallis H test. “†” indicated “compared with control group, P<0.05″; “‡” indicated “compared with common case group, P<0.05″.
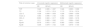
As shown in Table 3, the higher level of TC in serum was associated with the increased risk of common pneumonia (OR = 1.110, 95%CI = 1.014 ∼ 1.214). In addition, the other lipid metabolic markers were not related to the risk of the disease (Table 3).
Association of serum lipids, lipoproteins and apolipoproteins with the risk of common and severe pneumonia.a
| Risk of common case | Univariate logistic regression | Multivariate logistic regression | ||
|---|---|---|---|---|
| OR | 95%CI | OR | 95%CI | |
| TGb | 1.045 | 0.995 ∼ 1.097 | 1.046 | 0.995 ∼ 1.098 |
| TC | 1.109 | 1.013 ∼ 1.214 | 1.110 | 1.014 ∼ 1.214 |
| LDL-C | 1.028 | 0.999 ∼ 1.059 | 1.028 | 0.999 ∼ 1.059 |
| VLDL-C | 1.063 | 0.996 ∼ 1.134 | 1.064 | 0.996 ∼ 1.135 |
| HDL-C | 0.990 | 0.963 ∼ 1.017 | 0.992 | 0.963 ∼ 1.018 |
| Lp-a | 1.011 | 0.983 ∼ 1.040 | 1.011 | 0.984 ∼ 1.040 |
| ApoA1 | 0.979 | 0.953 ∼ 1.007 | 0.980 | 0.953 ∼ 1.008 |
| ApoB | 1.039 | 0.979 ∼ 1.102 | 1.039 | 0.979 ∼ 1.103 |
The association of serum lipids, lipoproteins and apolipoproteins with the risk of common and severe pneumonia was performed by univariate and multivariate logistic regression, and their ORs and 95%CIs were reported. In the multivariate analyses, demography data, clinical manifestations, serological data and antibiotics were adjusted.
Besides, the higher levels of TG, TC, LDL-C, VLDL-C and ApoB were associated with the elevated risk of severe pneumonia (OR = 1.407, 95%CI = 1.336 ∼ 1.480; OR = 1.947, 95%CI = 1.741 ∼ 2.175; OR = 1.153, 95%CI = 1.116 ∼ 1.189; OR = 1.310, 95%CI = 1.222 ∼ 1.404; OR = 1.075, 95%CI = 1.003 ∼ 1.151). On the contrary, the lower levels of HDL-C and ApoA1 were related to the increased risk of severe pneumonia (OR = 0.903, 95%CI = 0.873 ∼ 0.933; OR = 0.921, 95%CI = 0.891 ∼ 0.952). In addition, the serum of Lp-a was not associated with the risk of the disease (OR = 1.012, 95%CI = 0.979 ∼ 1.046).
Association of the lipid metabolic markers with the risk of hypoxemiaAs shown in Table 4, the higher level of TG in serum was associated with the risk of hypoxemia in this group (OR = 1.172, 95%CI = 1.028 ∼ 1.336). However, the serum levels of the other lipid metabolic markers were not related to the risk of hypoxemia in the common case group (Table 4).
Association of serum lipids, lipoproteins and apolipoproteins with the risk of hypoxemia in common and severe case group.a
| Risk of hypoxemia in common case | Univariate logistic regression | Multivariate logistic regression | ||
|---|---|---|---|---|
| OR | 95%CI | OR | 95%CI | |
| TGb | 1.171 | 1.028 ∼ 1.335 | 1.172 | 1.028 ∼ 1.336 |
| TC | 0.982 | 0.773 ∼ 1.249 | 0.983 | 0.774 ∼ 1.249 |
| LDL-C | 1.050 | 0.976 ∼ 1.130 | 1.051 | 0.976 ∼ 1.131 |
| VLDL-C | 1.031 | 0.859 ∼ 1.237 | 1.032 | 0.859 ∼ 1.237 |
| HDL-C | 1.060 | 0.981 ∼ 1.145 | 1.060 | 0.981 ∼ 1.146 |
| Lp-a | 0.992 | 0.923 ∼ 1.066 | 0.993 | 0.923 ∼ 1.066 |
| ApoA1 | 1.021 | 0.946 ∼ 1.103 | 1.021 | 0.947 ∼ 1.103 |
| ApoB | 0.971 | 0.831 ∼ 1.135 | 0.972 | 0.831 ∼ 1.136 |
The association of serum lipids, lipoproteins and apolipoproteins with the risk of hypoxemia in common and severe case group was performed by univariate and multivariate logistic regression, and their ORs and 95%CIs were reported. In the multivariate analyses, demography data, clinical manifestations, serological data and antibiotics were adjusted.
Similar to the common case group, only the higher level of TG in serum was relate to the increased risk of hypoxemia in the severe case group (OR = 1.142, 95%CI = 1.072 ∼ 1.215). And the serum levels of the other lipid metabolic markers were not related to the risk of hypoxemia in this group (Table 4).
Linear association of the lipid metabolic markers with serum C-reactive proteinAs shown in supplemental Table 1, in the common case group, the serum level of HDL-C was inversely associated with the serum level of C-reactive protein (ρ = −0.097, P = 0.002). In the severe case group, the serum level of HDL-C was also inversely associated with the serum level of C-reactive protein (ρ = −0.343, P < 0.001), and the serum level of TC was positively correlated with the serum level of the inflammatory marker (ρ = 0.064, P = 0.042).
DiscussionAs mentioned above, pneumonia is one of the major health challenges in children under 5 years of age, and obesity is another emerging health issue for these children that have become increasingly important in recent years.13,14 And the Han Chinese are the dominant ethnic group in China and are also widely distributed in Southeast Asia, North America and Western Europe, with a population of over 1.2 billion. These two diseases mentioned above also severely affect Han Chinese children.13-15 Therefore, it is of great scientific and practical importance to explore the correlation between lipid metabolism and pneumonia in Han Chinese children of this age group.
Based on the results of this study, the authors found that lipid metabolism was more closely related to severe pneumonia than common pneumonia. For severe pneumonia, the elevated levels of TG, TC, LDL-C, VLDL-C and ApoB were implicated in the increased risk of severe pneumonia by about 7% to 90%, while the elevated levels of HDL-C and ApoA1 were associated with the decreased risk of the disease by about 8% to 10%. For common pneumonia, only one lipid metabolic marker TC was related to the risk of common pneumonia, and the elevated levels of it in serum was related to the increased risk of the disease by 10%. The study did not find any relationship between the other lipid metabolic markers and the risk of common pneumonia. Thus, the present study was partially consistent with the previous study, although it did not cover so many lipid metabolic markers and did not distinguish pneumonia into common and severe groups.8
It is well known that lipid metabolism disorders are often implicated in low-intensity metabolic inflammation in the body.16 In childhood pneumonia, inflammation is also a pathophysiological process that is inextricably linked to the disease progression and prognosis, accompanied by altered levels of numerous inflammatory factors (including CRP). More importantly, the present study confirmed that there was a certain inversely linear relationship between serum HDL and CRP both in the common and severe cases, while serum TC had a positive linear association with serum CRP in the severe cases. Therefore, both the previous knowledge as well as the authors’ findings implied that the correlation between lipid metabolism and childhood pneumonia might be explained by inflammation. However, the exact mechanisms remained unclear and need to be explored in further research.
Hypoxaemia should be a serious clinical manifestation in childhood pneumonia, which is often associated with a fatal prognosis.17 The present study found a correlation between serum TG and hypoxemia both in the common case and severe case groups. Briefly, the higher TG level in serum may suggest an increased risk of hypoxemia by more than 10% in these two groups. In fact, an association between obesity and hypoxemia had long been established in sleep apnea syndrome, and its mechanism was that obesity led to stricture of the respiratory tracts, promoting apnea and hypoxemia.18,19 However, because the present study failed to find any significant difference in obesity (BMI Z-score) levels among all three groups, the relationship between hypoxemia and serum TG should be independent of obesity. Furthermore, both hypoxemia and plasma TG levels in pneumonia were clearly factors associated with inflammation, it was possible that inflammation could be a potential mechanism linking these two factors mentioned above, but future studies were needed to verify this assumption.
In the study, pneumonia was diagnosed primarily based on the WHO criteria. However, cough and difficulty breathing were neither specific nor sensitive symptoms of the disease. So, the pneumonia children included in the study must be supported by the results of chest auscultation or chest x-ray, which increased the accuracy of the diagnosis.
There were two advantages in the present study. First, the inclusion of 3000 children provided a sufficiently large sample size and test power. Second, the data in the study were analyzed at multiple levels. For example, the included children were grouped according to the severity of pneumonia, and a series of lipid metabolic markers were also analyzed separately. This helped the researchers discover more valuable information.
The most significant limitation of this study came from its cross-sectional design. The correlation between obesity and lipid profile was clear. In the present study, the authors did not find any significant differences in obesity levels between the three groups, so pneumonia (especially severe pneumonia) was the most likely factor associated with altered lipid profiles in children. However, due to the lack of reliable longitudinal data, the authors were unable to determine whether altered lipid profiles preceded the onset of pneumonia. After all, pneumonia or other acute inflammatory states can also alter an individual's lipid profile.20 Therefore, the available evidence did not yet support a direct independent pathogenic effect of lipid metabolism on disease severity. Cohort studies as well as Mendelian randomization studies can continue to explore these questions at both phenotypic and genotypic levels, in the expectation that they may provide more definitive conclusions, and the present study could be an important basis for these future studies.
In conclusion, there was a significant relationship between lipid metabolism and severe pneumonia (but not common pneumonia) in under-five children. Briefly, the elevated peripheral concentrations of TG, TC, LDL-C, VLDL-C and ApoB might be related to the increased risk of severe pneumonia, and the elevated peripheral concentrations of HDL-C and ApoA1 might be related to the decreased risk of the disease. Furthermore, the peripheral concentration of TG was associated with the development of hypoxemia both in common and severe pneumonia in these children. In addition, these relationships might be partly explained by inflammation. More studies should be conducted to further validate this conclusion.
Data availability statementsData can not be shared at present due to this is an ongoing study. When the study was completed, the data will be shared immediately.


