To analyze the prevalence evolution of Guthrie, hearing, and eye screening testing among newborns in Brazil, between 2013 and 2019, according to demographic and socioeconomic characteristics.
MethodsThis is a cross-sectional study with data from 5231 infants from the Pesquisa Nacional de Saúde (PNS), in 2013, and 6637 infants, in 2019, for the Guthrie test, hearing, and red reflex tests. The authors analyzed the outcomes according to the region of residence, self-reported color/race, having health insurance, and per capita household income. By using bivariate and multivariate Poisson regression models, the prevalence ratios and their respective 95 % Confidence Intervals (CI95%) were calculated for each year.
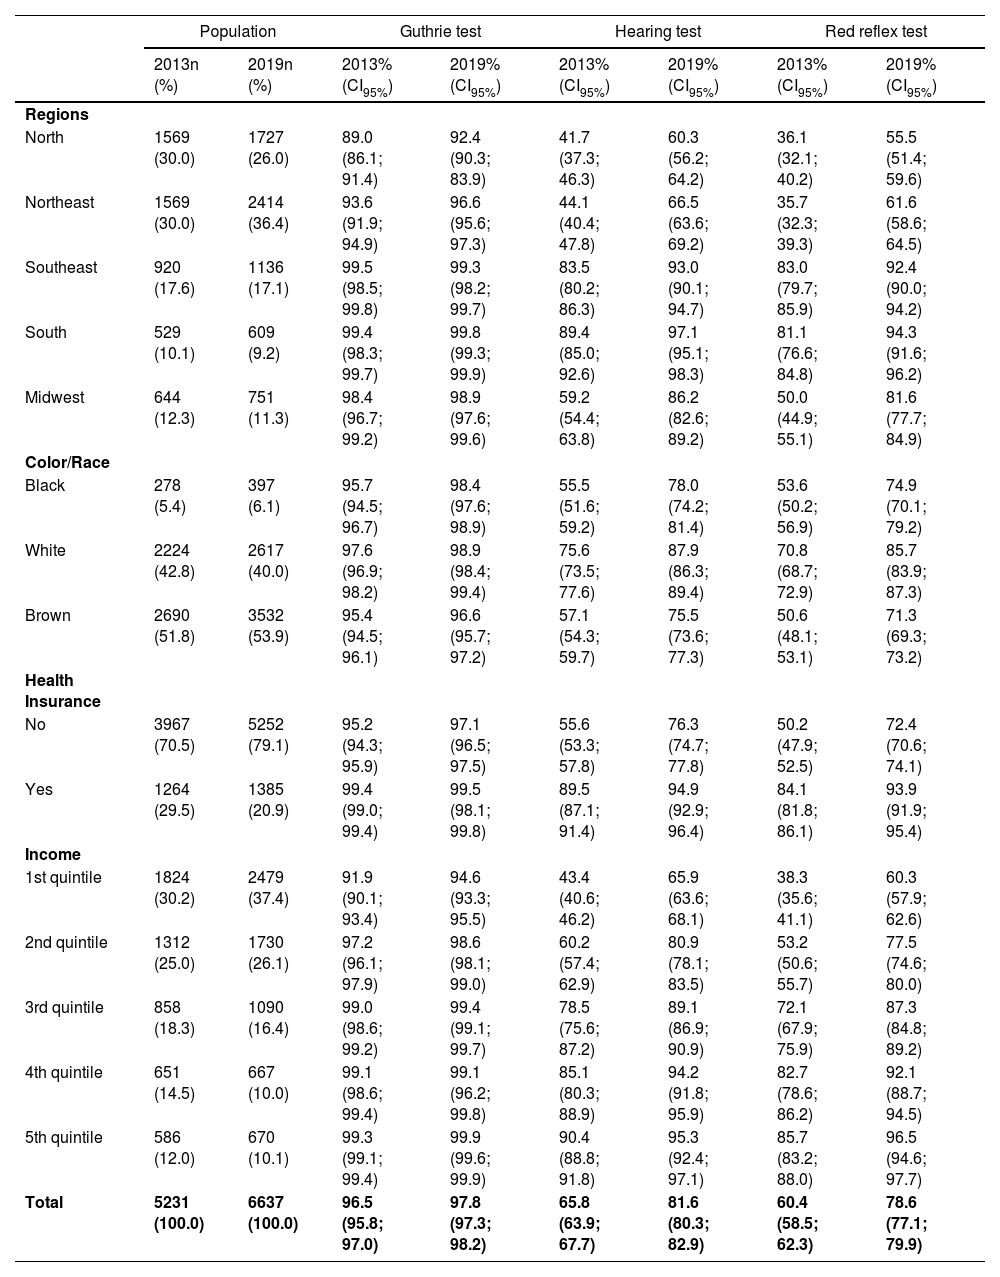
ResultsIn 2013, Guthrie test, hearing, and red reflex tests were performed in 96.5 % (95%CI 95,8;97,0), 65.8 % (95%CI 63,9;67,7), and 60.4 % (95%CI 58,5;62,3) of infants, respectively. In 2019, the prevalence was 97.8 % (95%CI 97,3;98,2) in the Guthrie test, 81.6 % (95%CI 80,3;82,9) in the hearing test, and 78.6 % (95%CI 77,1;79,9) in the red reflex test. The testing frequency was higher among residents of the Southeast and South regions of Brazil, among infants whose mother or guardian was white, had health insurance, and was in the higher income strata; and the most evident differences were in the eye and hearing testing.
ConclusionsThe coverage inequalities according to the region of residence, income, and having health insurance highlight the need to use strategies that enable exams to be carried out, with more information about their importance, encompassing actions from primary care, prenatal care to the puerperium, aiming at universal access and equity.
Neonatal screening is part of an important public policy that should identify disorders and diseases in newborns it must be a good tool for tracking, and it enables early treatment or adequate follow-up of children with a positive diagnosis.1 This is particularly relevant in the case of children with rare and hereditary diseases.2 In the global context, each year approximately 8 million newborns have a severe malformation or congenital anomaly, and approximately 3 million die before reaching the age of five.3 Three of the five most common congenital disorders can be identified or managed through newborn screening: Congenital heart defects, hemoglobin disorders, and glucose-6-phosphate dehydrogenase deficiency.4 The diseases most frequently identified in the screenings have a relatively low incidence considering all newborns, however, they are highly significant and represent vulnerability due to their morbid, incapacitating, and sequelae potential, with high severity and social and economic relevance.5
Neonatal screening has been present in public policies in several countries since the 1960s but with a wide variation in the tests incorporated into the clinical guidelines of each location.6 The different contexts of countries – whether economic, political, social, or cultural – result in different adoption and conducting models for the screening tests, thus leading to inequalities in both the access to diagnoses and treatments. A study carried out with 51 European countries between 2010 and 2020 showed that, in most of them, the percentage of newborns who underwent screening was greater than 90.0 %.7 In Latin America, countries such as Uruguay, Costa Rica, Cuba, and Chile have the best coverage, with values greater than 99.0 % of Guthrie test neonatal screening.8
In Brazil, neonatal screening was introduced in 1976, with phenylketonuria test.9 The screening was incorporated into the Unified Health System (Sistema Único de Saúde, SUS) in 1992 through legislation that required the Guthrie test for all live newborns, with tests for phenylketonuria and congenital hypothyroidism, however, this occurred heterogeneously in different Brazilian regions.1 In 2001, the Ministry of Health created the National Neonatal Screening Program (PNTN),1 adding two more tests. Since 2015, neonatal screening has been linked to the National Policy on Children's Health (PNAISC), being one of the strategic actions in the axis of humanized and qualified care for newborns, becoming universal neonatal screening (TNU).1,6,10 In 2016 there was a new regulatory framework for the program, with the inclusion of new tests.11 Thus, the PNTN criteria for the newborn hospital discharge is performing pulse oximetry (heart test), eye screening (red reflex test), and hearing screening (ear test) in the first month of life.9,10 Recently, the Guthrie test will gradually cover 14 groups of diseases, allowing more than 50 diseases to be detected, like occurs in developed countries.12,13
With the implementation of the PNTN, there was an increase in screening coverage in Brazil. The percentage of neonatal screening tests went from 75.0 % in 2004 to 85.8 % in 2017, with a large regional variation, both in magnitude and in coverage trends over the years.13 For hearing screening, the national coverage rate was 37.2 %,14 but few studies address the coverage of tests included later. One of them, a national study showed that in Brazil, in 2013, there were screening test inequalities indicating that the region of residence and having a health insurance and a better income were factors associated with a higher prevalence of screening tests.15 Observing the existence of these inequalities is necessary for the organization, offer, and expansion of access to the program. Despite the importance of monitoring population studies to track test conducting and associated inequalities, there have been no national studies with such analyses since 2013.
The purpose of this study was to analyze the prevalence evolution of Guthrie, hearing, and eye screening tests among newborns in Brazil, between 2013 and 2019, according to demographic and socioeconomic characteristics.
MethodsThis is a cross-sectional study with data from the 2013 and 2019 editions of the Pesquisa Nacional de Saúde (PNS). The PNS is a nationwide, household-based survey developed in a partnership between the Ministry of Health and the Instituto Brasileiro de Geografia e Estatística (IBGE), with the aim of analyzing the health situation and the use of the health services by the Brazilian population.
The PNS uses a probabilistic sampling process carried out in three stages: In the first stage, the primary sampling units (UPAs) are defined based on the 2010 Population Census; in the second stage, the households were drawn; and in the third stage, the resident aged 18 years or over in 2013 and 15 years or over in 2019 (except for 3 thematic blocks) was drawn in each household to be interviewed.16–18 Data collection for the 2013 PNS took place between 2013 and 2014, and 205,546 individuals were interviewed.16 As for the 2019 PNS, it took place between August 2019 and March 2020, and 279,382 interviews were conducted.17
The health of children under two years of age was among the subjects investigated in both editions of the PNS; the information from this group was obtained from the child’s mothers or guardians. This information was obtained from Module L of the questionnaires, which addresses the use of health care, food, vaccination, and neonatal screening tests services. In total, data from 5231 children under two years of age were collected in 2013, and from 6637 children in 2019. More details on the surveys can be obtained in their official documents.16,17
In the present study, the primary outcomes were performing the Guthrie test, hearing, and red reflex tests. According to the 2013 PNS, the prevalence of individuals who underwent the tests in the first week of life was described. For the 2019 PNS, it was considered the Guthrie test within 5 days of life,1 the hearing test between 24 and 48 hours after birth, and the red reflex test within 24 h, as recommended by the Ministry of Health.10
As independent variables, data was analyzed according to the region of residence (North, Northeast, South, Southeast, Midwest), the respondent’s self-reported color/race (white, black, brown), having health insurance at the time of the interview (yes, no), and per capita household income (household total amount – in Brazilian reals – received in the last month divided by the number of people living in that household, categorized into quintiles). Due to the small number of self-reported yellow and indigenous people, these groups were excluded from the analysis.
Data was analyzed by using the Stata 14.1 statistical package (StataCorp LP, College Station, United States) and by incorporating the design effect and sample weights of the two editions of the PNS. In order to verify possible changes between 2013 and 2019 in the screening test conducting, the outcomes were analyzed according to sociodemographic and geographic factors, estimating the prevalence with their respective 95 % Confidence Intervals (CI95%) each year. Then, by using bivariate and multiple Poisson regression models, the prevalence ratio and its CI95% were calculated as a measure of association. For the univariate/bivariate logistic regression analysis, was set a p-value at < 0.20 for inclusion in the multiple model; those with the lowest p-value were ordered for inclusion in the final model, using the stepwise-forward procedure.
The PNS 2013 was approved by the Brazilian National Committee for Ethics in Research (CONEP) of the Brazilian National Health Council (CNS) in June 2013, under the Certificate of Presentation for Ethical Consideration (CAAE) 10853812.7.0000.0008, and the PNS 2019 under opinion no. 3529376, issued on August 23, 2019. Therefore, this research fully follows the ethical precepts contained in CNS Resolution No. 466 of 2012.
ResultsData from 5231 children under 2 years old in 2013, and 6637 in 2019, were analyzed. Approximately two-thirds of the adult respondents lived in the North and Northeast regions in the 2013 survey, 51.8 % were brown and 70.5 % did not have health insurance (Table 1). In 2019, 62.4 % of respondents were from the North or Northeast regions, 53.9 % were brown, and 79.1 % did not have health insurance.
Sample distribution and prevalence (CI95%) for the Guthrie test, hearing, and red reflex test conducting. Pesquisa Nacional de Saúde, 2013 and 2019, Brazil.
Data source: Pesquisas Nacionais de Saúde, 2013 and 2019.
n, total number; CI95%, 95 % confidence interval.
In 2013, 96.5 %, 65.8 %, and 60.4 % of infants underwent, at any time in their lives, the Guthrie test, the hearing test, and the red reflex test, respectively (Table 1). In 2019, the prevalence of the three tests was higher than the values observed six years earlier. In the case of the Guthrie test, the value ranged to 97.8 %. As for the hearing and red reflex tests, the increases were more expressive, reaching 81.6 % and 78.6 %, respectively.
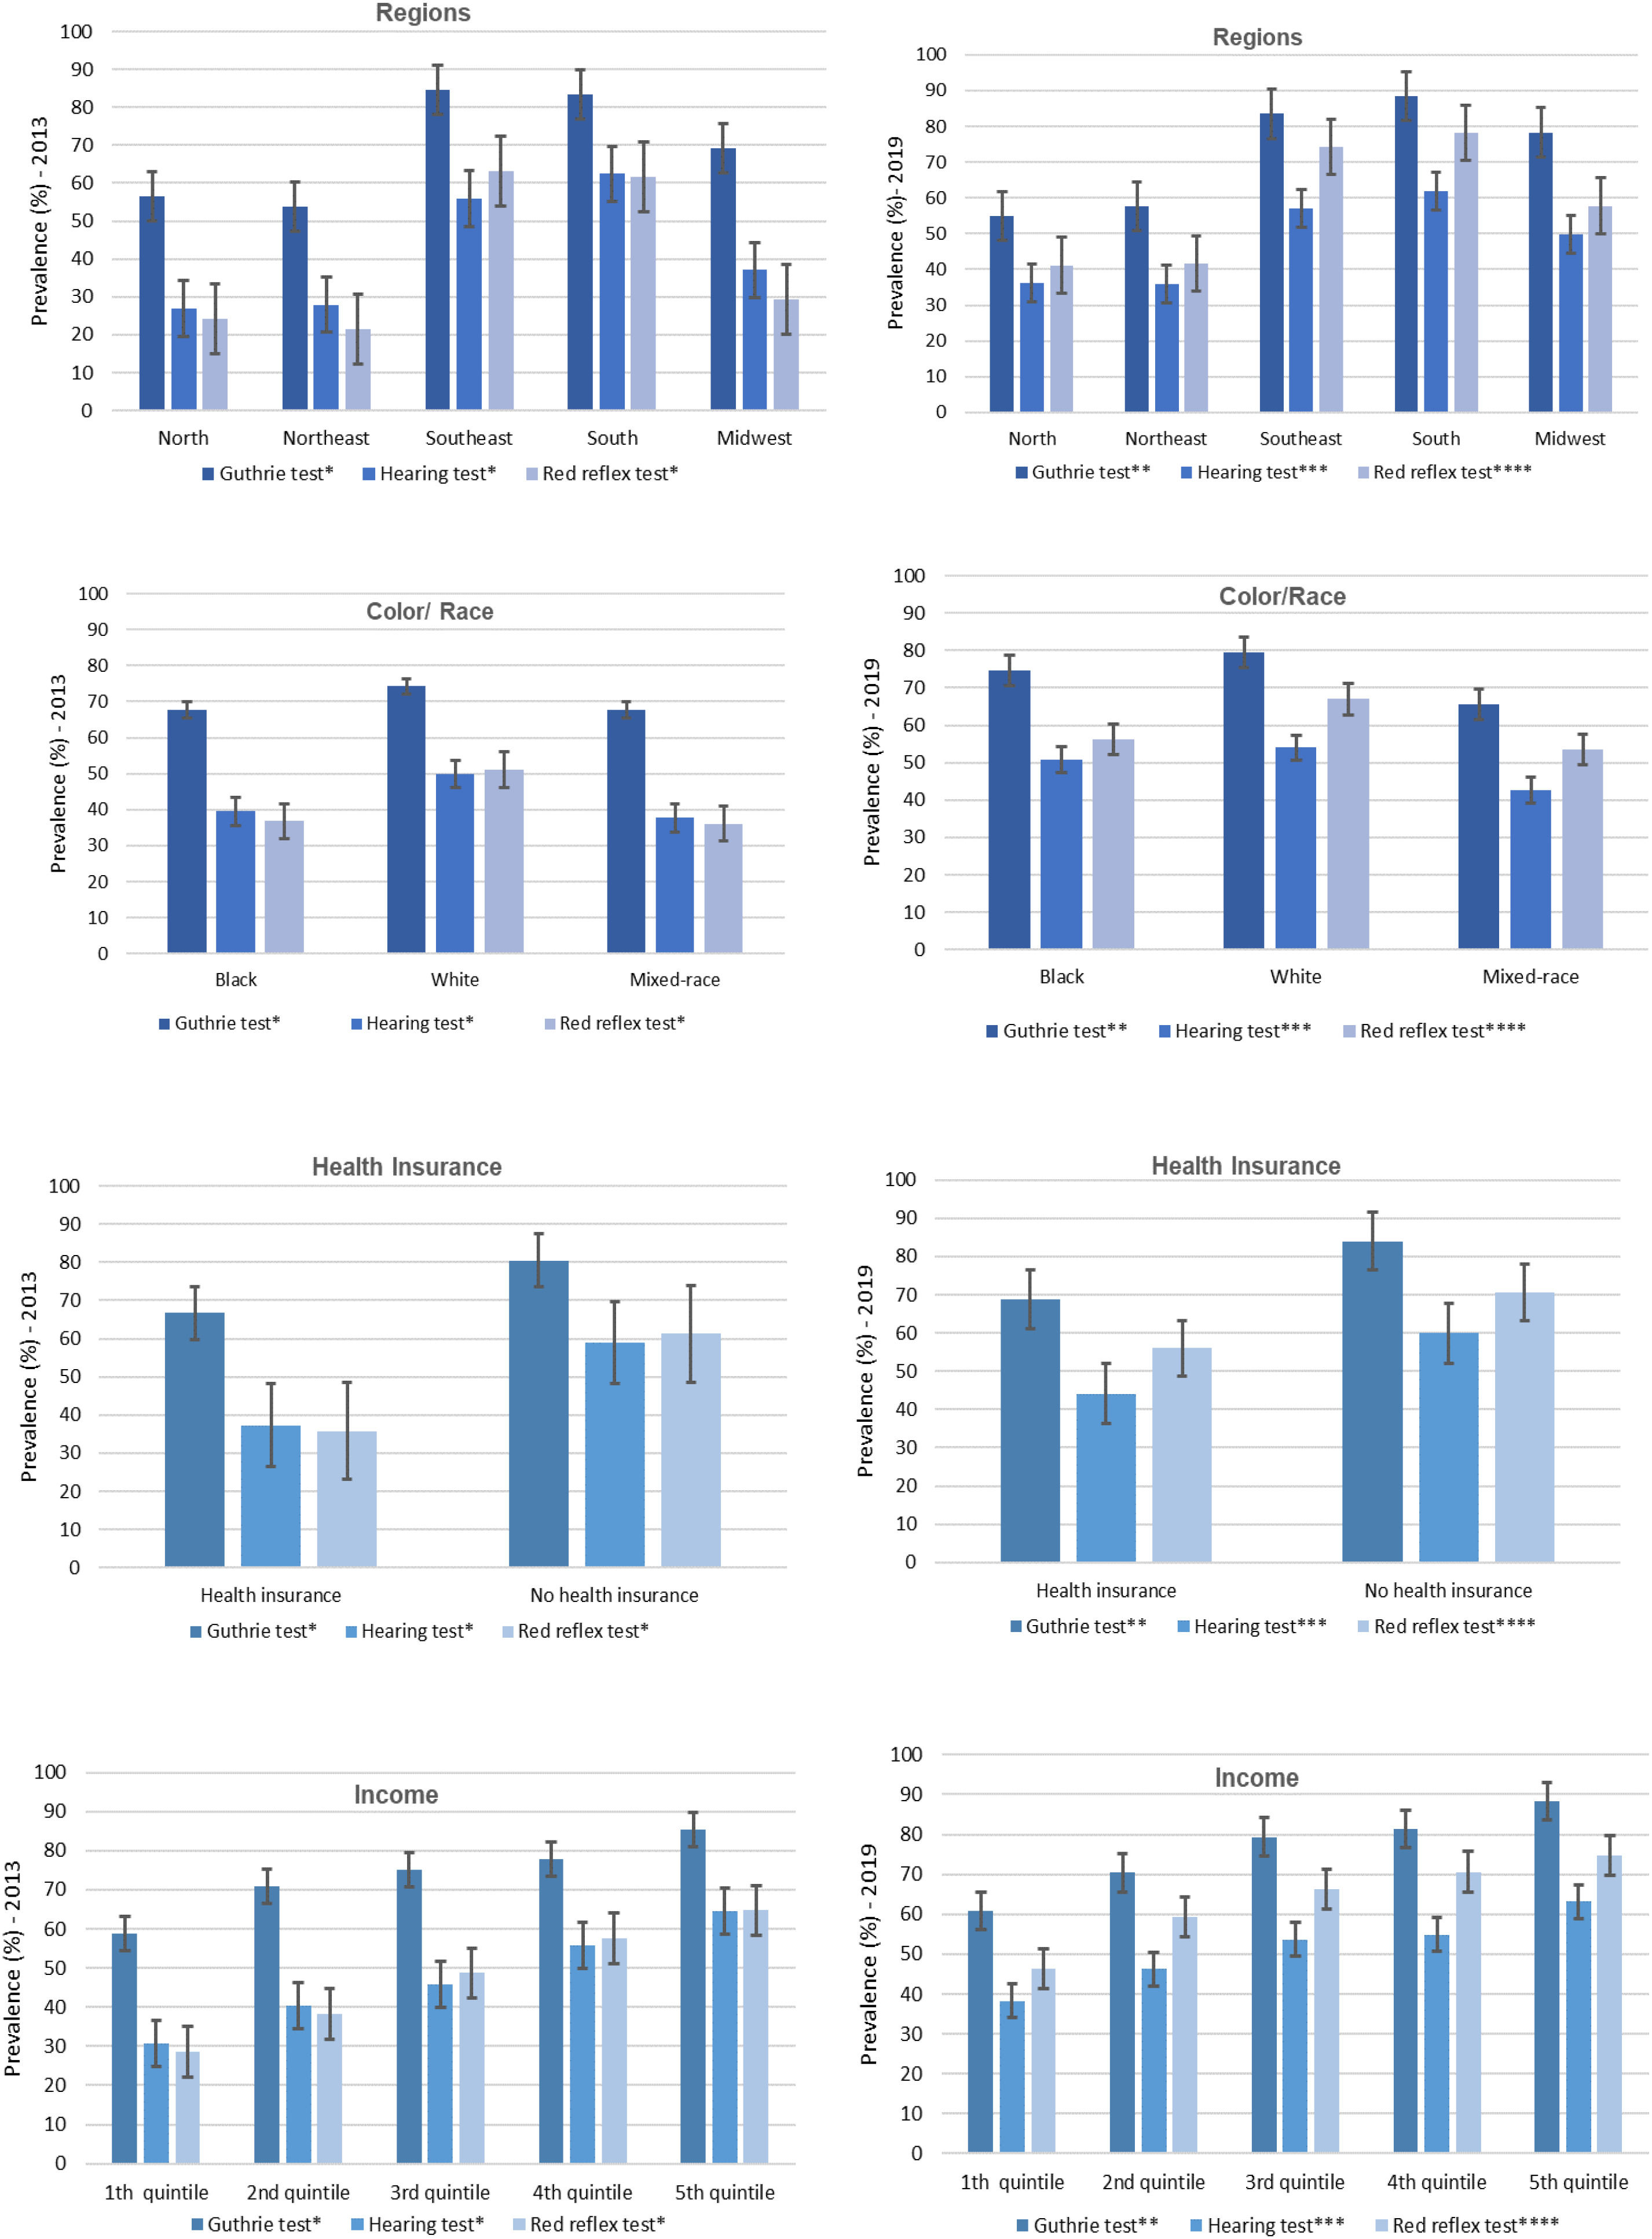
The authors observed that in 2013 and 2019, the testing frequency at any time in life was higher among residents of the Southeast and South regions (Figure 1). In both samples, the authors identified that adequacy was higher among infants whose mother or guardian was white, had health insurance, and was in strata with more income, and the most evident differences were in the eye and hearing test conducting.

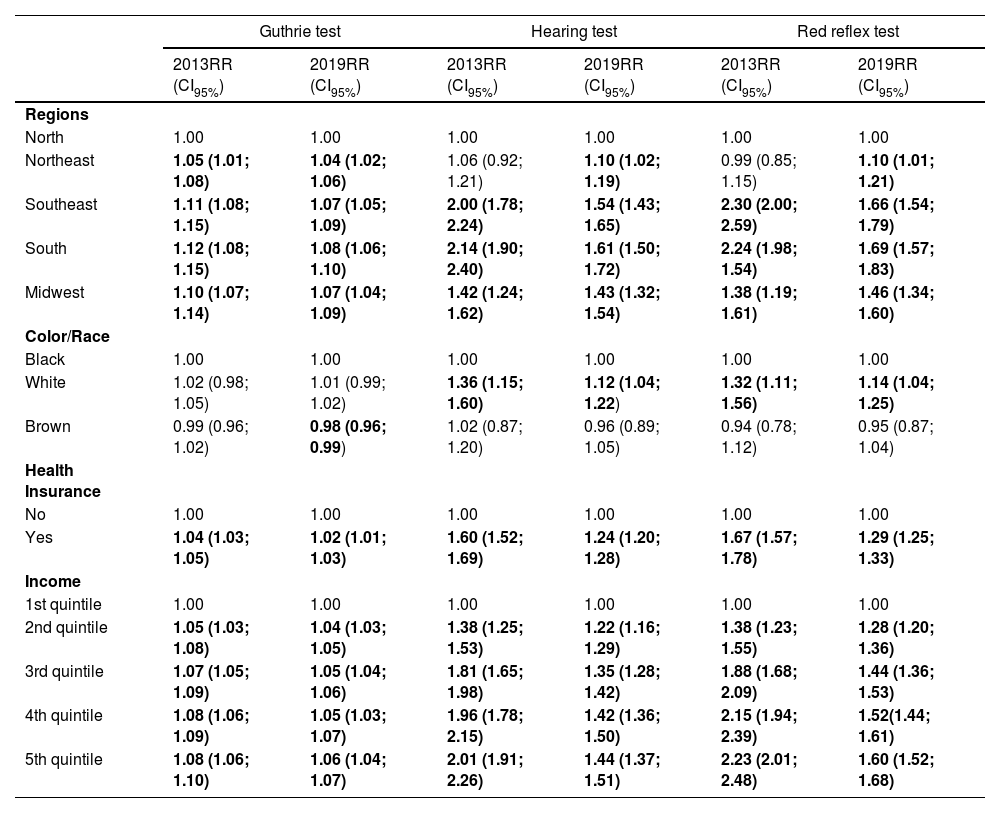
In the bivariate analysis, a positive association was found in 2013 and 2019 between performing the Guthrie test and per capita household income, residing in the Southeast, South, and Midwest regions, and having health insurance (Table 2). For the other tests, the association of the color/race outcome showed a higher prevalence ratio among white individuals, health insurance holders, and higher income, and in 2013 there was a greater association for conducting the red reflex test for the highest income quintile.
Bivariate Poisson analysis for carrying out the Guthrie test, hearing, and red reflex tests at any time, according to sociodemographic variables. Pesquisa Nacional de Saúde 2013 and 2019, Brazil.
Data source: Pesquisas Nacionais de Saúde, 2013 and 2019.
RR, relative risk; CI95%, 95 % confidence interval; p < 0.20.
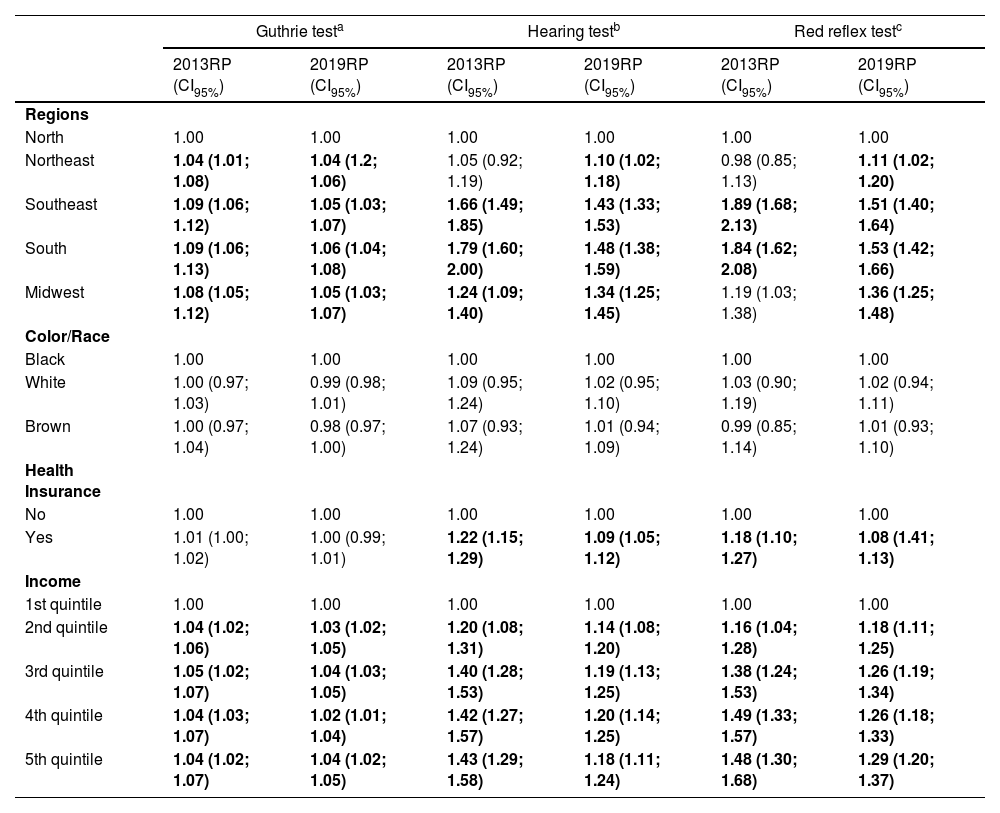
Table 3 presents the results of the multivariate analysis. The authors observed that in 2013 and 2019 there was a greater chance of the Guthrie test being conducted in the Southeast, South, Midwest, and Northeast regions compared to the North region. This was also verified for the other tests. For the year 2019, the authors verified that the North region still has a lower chance of conducting the tests, especially the hearing and red reflex tests. Although to a lesser extent than what was observed in 2013, residing in the South region means a 1.48 higher prevalence ratio for the hearing test conducting, and 1.53 higher for the red reflex test conducting.
Multivariate Poisson analysis for carrying out the Guthrie test, hearing, and red reflex tests at any time, according to sociodemographic variables. Pesquisa Nacional de Saúde 2013 and 2019, Brazil.
| Guthrie testa | Hearing testb | Red reflex testc | ||||
|---|---|---|---|---|---|---|
| 2013RP (CI95%) | 2019RP (CI95%) | 2013RP (CI95%) | 2019RP (CI95%) | 2013RP (CI95%) | 2019RP (CI95%) | |
| Regions | ||||||
| North | 1.00 | 1.00 | 1.00 | 1.00 | 1.00 | 1.00 |
| Northeast | 1.04 (1.01; 1.08) | 1.04 (1.2; 1.06) | 1.05 (0.92; 1.19) | 1.10 (1.02; 1.18) | 0.98 (0.85; 1.13) | 1.11 (1.02; 1.20) |
| Southeast | 1.09 (1.06; 1.12) | 1.05 (1.03; 1.07) | 1.66 (1.49; 1.85) | 1.43 (1.33; 1.53) | 1.89 (1.68; 2.13) | 1.51 (1.40; 1.64) |
| South | 1.09 (1.06; 1.13) | 1.06 (1.04; 1.08) | 1.79 (1.60; 2.00) | 1.48 (1.38; 1.59) | 1.84 (1.62; 2.08) | 1.53 (1.42; 1.66) |
| Midwest | 1.08 (1.05; 1.12) | 1.05 (1.03; 1.07) | 1.24 (1.09; 1.40) | 1.34 (1.25; 1.45) | 1.19 (1.03; 1.38) | 1.36 (1.25; 1.48) |
| Color/Race | ||||||
| Black | 1.00 | 1.00 | 1.00 | 1.00 | 1.00 | 1.00 |
| White | 1.00 (0.97; 1.03) | 0.99 (0.98; 1.01) | 1.09 (0.95; 1.24) | 1.02 (0.95; 1.10) | 1.03 (0.90; 1.19) | 1.02 (0.94; 1.11) |
| Brown | 1.00 (0.97; 1.04) | 0.98 (0.97; 1.00) | 1.07 (0.93; 1.24) | 1.01 (0.94; 1.09) | 0.99 (0.85; 1.14) | 1.01 (0.93; 1.10) |
| Health Insurance | ||||||
| No | 1.00 | 1.00 | 1.00 | 1.00 | 1.00 | 1.00 |
| Yes | 1.01 (1.00; 1.02) | 1.00 (0.99; 1.01) | 1.22 (1.15; 1.29) | 1.09 (1.05; 1.12) | 1.18 (1.10; 1.27) | 1.08 (1.41; 1.13) |
| Income | ||||||
| 1st quintile | 1.00 | 1.00 | 1.00 | 1.00 | 1.00 | 1.00 |
| 2nd quintile | 1.04 (1.02; 1.06) | 1.03 (1.02; 1.05) | 1.20 (1.08; 1.31) | 1.14 (1.08; 1.20) | 1.16 (1.04; 1.28) | 1.18 (1.11; 1.25) |
| 3rd quintile | 1.05 (1.02; 1.07) | 1.04 (1.03; 1.05) | 1.40 (1.28; 1.53) | 1.19 (1.13; 1.25) | 1.38 (1.24; 1.53) | 1.26 (1.19; 1.34) |
| 4th quintile | 1.04 (1.03; 1.07) | 1.02 (1.01; 1.04) | 1.42 (1.27; 1.57) | 1.20 (1.14; 1.25) | 1.49 (1.33; 1.57) | 1.26 (1.18; 1.33) |
| 5th quintile | 1.04 (1.02; 1.07) | 1.04 (1.02; 1.05) | 1.43 (1.29; 1.58) | 1.18 (1.11; 1.24) | 1.48 (1.30; 1.68) | 1.29 (1.20; 1.37) |
Data source: Pesquisas Nacionais de Saúde, 2013 and 2019.
Regarding income, the authors observed in 2013 that being among the richest quintiles increases the prevalence ratio by, at least, 1.42 times for the hearing test conducting and 1.49 times for the red reflex test conducting. For 2019, there was a higher prevalence ratio among the richest quintiles, but with a slightly lower proportion, in which the fourth quintile for the hearing test is 1.20 times greater, and 1.29 times greater in the fifth income quintile for the red reflex test.
No differences were observed in the prevalence of outcomes according to color/race. Regarding health insurance holders, there was a prevalence ratio of 1.09 higher for the hearing test and 1.08 higher for the red reflex test in 2019, a lower ratio than what was found in 2013, when having health insurance meant a prevalence ratio of 1.22 times higher for the hearing test and 1.18 times higher for the red reflex test.
DiscussionThe findings of this study allowed observing the prevalence of conducting neonatal screening tests, with a greater difference for the Guthrie test in relation to the other tests in the year 2013. Inequalities were found in the conducting of the three tests, both in 2013 and 2019, and the highest prevalence was among residents of the South and Southeast regions, of white color/race, with mothers and/or guardians with health insurance coverage and with higher income.
The Guthrie test was the first test practiced in Brazil, it has been used since 1976 and was standardized for all states of the federation with the creation of the PNTN, in 2001. For the other tests, the differences were greater. Although these exams were mandatory and implemented in 2010 and 2015, respectively, they did not achieve the recommended coverage in 2019.
It is recommended that collection for the Guthrie test be done between the newborn 3rd and 5th day of life.1,10 In 2012, 40.0 % of collections were carried out during this period; in 2018, it was 58.0 % and the target for the 2020–2023 four-year period is 70.0 %.19 In this period of life, newborns are often already at home, requiring attendance at a Primary Health Care Unit (UBS) to perform the test, which can be influenced by technical, structural, organizational, access, and postpartum issues and reflect on the expected prevalence for the test.6 In 2019, the national coverage of the program was 80.1 %, and the number of collection points for the Guthrie test increased from 21.461, in 2016, to 24.177 collection points, despite this, the percentage of collection until the 5th of life was 59.9 %.20 In addition to greater coverage, it is necessary to organize the next steps, as late care can be a missed opportunity and the development of permanent sequelae.6
Expanding the universal coverage of these tests has been complex for Brazil and for many countries. Demographic, economic, political, cultural, and logistical heterogeneity, in addition to different other issues, make all stages of this broad process that involves neonatal screening a great challenge, with the test collection representing the starting point in this sequence and which can be affected by a series of difficulties.6 Some factors may negatively affect screening rates, such as lower income and education, lack of actions to implement public policies, early hospital discharge, and births outside the hospital, without adequate subsequent health follow-up.21 On the international scenario, there are countries with 100.0 % coverage, such as Japan, only 1.0 %, such as India and Guatemala, and well-developed programs in Western Europe, the United States of America, and Canada, which also have good coverage and a wider range of investigated diseases in the Guthrie test.22 In 2018, among the Latin countries, only six of them (Cuba, Costa Rica, Chile, Uruguay, Argentina, and Paraguay) reached 90.0 % coverage or more, and another six, including Brazil, had coverage from 70.0 % to 86.0 %.8
Even with the program’s existence and a universal and public health system, the national scenario is very complex, which is reflected in differences, especially in coverage and screening access to newborns, in addition to implications in the degree of opportunities for collections, where the articulation between institutions that are not part of the public network of health services is necessary for the program success.5 Greater access to education can lead to a greater awareness of pregnant women on their rights and the objective conditions to claim them, the same applies to higher income.6 Furthermore, the authors should consider that the sample collection and transport processes, human resources with specialized professionals, and the availability of inputs also have a direct relationship with the screening quality.23 These factors may affect the conducting of tests in regions of difficult access within the country.
The authors observed that there was an increase in hearing screening coverage in 2019 compared to 2013, which occurred in almost all states. However, despite this growth, there is a difference in the concentration of speech therapist professionals between states and regions, which may contribute to a poor distribution of speech therapy services and influence the coverage of hearing screening in newborns, since most neonatal hearing screenings occur in public maternity hospitals, and less than half had the recommended 95.0 % screening rate for newborns.24 The guarantee of the universality of hearing tests is not seen in the reality of services in different regions of Brazil, whether due to difficulties in offering professionals, recording information to construct good indicators, or maintaining equipment and accessories.25
The red reflex test is low-cost and easy to perform, helping to diagnose serious eye diseases such as cataracts, glaucoma, retinoblastoma, and retinal disorders.26 Vision is a crucial sense in childhood, as it has a direct influence on the child’s neuropsychomotor development and educational needs, which makes early detection of visual impairment a factor of great relevance.27 However, studies on the prevalence of these tests are still scarce in Brazil.
As study limitations, the PNS is a cross-sectional study that uses self-reported information. In addition, there may be a memory bias in the responses given by the mothers or guardians of the newborns in relation to the moment in which the screening tests were carried out, which can interfere with the estimates, as well as with the obtained information regarding income and having health insurance being referred to the moment of the interview and not to the childbirth period. Another limitation was the moment considered for collecting the Guthrie test screening in the two surveys, making it impossible to directly compare some data. However, the authors need to highlight the importance of carrying out these population surveys at the national level in order to provide an overview of the country’s health reality, which should be designed and conducted with methodological rigor and adequate data presentation, which allows for important analyzes in different contexts and outcomes.
It is important to remember that, among the proposed goals for the 2030 Agenda of the World Health Organization (WHO), is the expansion of equitable access to health services for health promotion and disease prevention by considering the demographic, epidemiological, and cultural profile of the population, especially the differentiated and unmet needs of all people and the specific needs of groups that are in a situation of vulnerability.28 As shown in the study, different obstacles can interfere with the prevalence of testing within the period considered ideal for screening. The data shows the existence of inequalities of access according to the region of residence, income, and having health insurance in a country that has a health system and which has equity as one of its principles. Using strategies to enable conducting the tests and guarantee more information about their importance, encompassing actions from primary care, prenatal care, to postpartum care, can contribute to reducing these inequalities.
CRediT authorship contribution statementLetícia R. Dias: Methodology, Formal analysis, Writing – review & editing. Yaná T. Tomasi: Methodology, Formal analysis, Writing – review & editing. Antonio F. Boing: Conceptualization, Methodology, Data curation, Writing – review & editing.


