To study bone mineral density (BMD) in adolescent females according to five groups of chronological age (CA), bone age (BA), and breast development stage (B), and to correlate these parameters with plasma bone biomarkers (BB).
MethodsThis was a cross-sectional study performed in 101 healthy adolescent females between 10 and 20 years old. The study variables were: weight, height, body mass index (BMI), CA, B, BA, calcium intake, BMD, and BB. Osteocalcin (OC), bone alkaline phosphatase (BAP), and C-terminal telopeptide (S-CTx) were evaluated for BB. BMD was measured using dual energy X-ray absorptiometry (DXA).
ResultsBMD in lumbar spine, proximal femur, and total body increased with age, and the respective observed averages were: in CA1 (10 years old), 0.631, 0.692, 0.798g/cm2; in CA2 (11 to 12 years old), 0.698, 0.763, 0.840g/cm2; in CA3 (13 to 14 years old), 0.865, 0.889, 0.972g/cm2; in CA4 (15 to 16 years old), 0.902, 0.922, 1.013g/cm2; and in CA5 (17 to 19 years old), 0.944, 0.929, 1.35g/cm2. These results showed significant differences between 13 and 14 years of age (CA3) or when girls reached the B3 stage (0.709, 0.832, 0.867g/cm2). The highest median concentrations of BB were between 10 and 12 years of age when adolescents were in the B2–B3 (p<0.001). Median BB concentrations decreased in advanced BA and B.
ConclusionsBB concentrations were positively correlated with the peak height velocity and negatively correlated with BMD in the study sites. Increased BMD and BB concentrations were observed in B3.
Avaliar a densidade mineral óssea (DMO) em adolescentes do sexo feminino de acordo com a idade cronológica (IC), idade óssea (IO) e desenvolvimento das mamas (M) e suas correlações com biomarcadores de remodelação óssea em plasma (BO).
MétodosEste foi um estudo transversal prospectivo feito em 101 adolescentes saudáveis do sexo feminino com idade entre 10 e 20 anos. As variáveis estudadas foram: peso, altura, índice de massa corpórea (IMC), IC, IO, M, ingestão de cálcio, DMO e BO. A osteocalcina (OC), fosfatase alcalina óssea (BAP) e o telopeptídeo C terminal (S-CTx) foram os biomarcadores de remodelação óssea avaliados. A DMO foi obtida por absorciometria de raios-X de dupla energia (DXA).
ResultadosA DMO de coluna lombar, fêmur proximal e corpo total aumentou com a idade, e as respectivas médias observadas foram: IC1=0,631, 0.692, 0,798g/cm2; IC2, 0,698, 0,763, 0,840g/cm2; IC3, 0,865, 0,889, 0,972g/cm2; IC4, 0,902, 0,922, 1,013g/cm2; e IC5, 0,944, 0,929, 1,35g/cm2. Observou-se diferença significativa entre 13 e 14 anos (IC3) ou quando as meninas estavam em M3 (0,709, 0,832, 0,867g/cm2). Os valores dos BO apresentaram elevação entre 10 e 12 anos e quando as adolescentes estavam em M2–M3 (p<0,001). Os valores das medianas dos BO diminuíram com o avançar da IO e M.
ConclusõesOs BOs mostraram paralelismo com o pico de velocidade de crescimento e demonstraram correlação negativa com a DMO no sítios avaliados. O aumento da DMO e dos BOs foi observado em M3.
The skeleton was traditionally known as a passive organ; its major function was considered to be the support of the human body. However, it is currently considered a mutable organ that participates in interactions between regulatory and energetic mechanisms acting in conjunction with the adipose tissue.1,2
Puberty is considered an important time of substantial bone growth, and therefore, sensitive to external influences that have strong effects, such as diet, physical exercise, lifestyle, and medications.3
Bone metabolism is characterized by cycles of formation and reabsorption, and the balance between these two processes changes through life. During infancy and adolescence, bone formation predominates over absorption; in adult life, both processes stabilize.4 Bone remodeling is also strongly related to variations in body weight,5,6 including changes in muscle mass and body fat content. Thus, the mechanical load imposed on the skeletal system interferes with bone formation.
According to Haeney et al.,7 peak bone mass represents the highest bone mass value or maximum quantity of bone that an individual attains when their skeleton is totally mineralized or consolidated. Currently, it is not precisely established at what age biological or chronological peak bone mass occurs; there is evidence that it occurs at the end of adolescence.8
Bone mass deposition begins during fetal life and continues during infancy and adolescence, stabilizing at the beginning of adulthood. Understanding and evaluating bone mass acquisition in a population of adolescents could be a determining factor in the prevention of osteopenia/osteoporosis, which are diseases considered public health issues of high economic impact.9
Bone mineral density (BMD) is considered an important, precise, and statically valid measurement; however, BMD measurements do not reflect the dynamic changes to which bone tissue has undergone, representing only one moment in an evolving condition. To overcome this limitation and to improve the sensitivity and specificity of bone mass status evaluation, the use of bone biomarkers (BBs) has been suggested to improve the understanding of the bone remodeling process.10–12
Important serum biomarkers of bone formation include: a) osteocalcin (OC), a non-collagenous protein abundant in bone, predominantly synthesized by differentiated osteoblasts, and considered to be a sensitive biomarker of bone synthesis activity; and b) bone alkaline phosphatase (BAP), an ectoenzyme or specific glycoprotein found on the surface of osteoblasts, with an important function in bone mineralization, and considered as a highly sensitive and specific bone formation indicator.13 In addition, studies have suggested that the C-terminal telopeptide (S-CTx) fragment, a bone reabsorption marker, is a good marker to evaluate bone formation processes because it is formed when collagen type I degradation occurs.
Bone remodeling biomarkers are important tools for understanding the dynamics of bone metabolism and add information acquired from bone densitometry.
Therefore, this was the first study that evaluated bone mineral density (BMD) in Brazilian adolescent females according to chronological age (CA), bone age (BA), and breast development stage (B), correlating this parameter with bone biomarkers (BBs).
MethodsHealthy white adolescent females (non-African or non-Asian descendants) between 10 and 20 incomplete years old were invited to participate in this study. The volunteers were students at the La Salle School in Botucatu, São Paulo State, Brazil and Santa Marcelina School in Botucatu. A total of 101 out of 497 adolescent female students in the studied age group, were included in the study and participated in all evaluations.
The study was approved by the Botucatu School Medicine Ethics Committee – UNESP. Written informed consent was co-signed by each participant (101) and their parents or guardians.
The inclusion criteria comprised weigh between the 10th and 90th percentiles and height between the 10th and 97.5th percentiles for each age group,14 adequate body mass index (BMI) for age,15 and report of regular and daily consumption of dairy products.
The exclusion criteria were: history of prematurity or low birth weight; presence of diabetes mellitus; acute or chronic under-nourishment; congenital or acquired bone diseases; gastrointestinal diseases accompanied by malabsorption; history of nephropathy with or without chronic renal failure; endocrinopathies; early or late puberty; chronic drug consumption; cystic fibrosis; celiac disease; drug use that negatively affected bone metabolism (such as anticonvulsants and antacids with aluminum); more than 2h/week physical exercises, since excessive physical exercise interferes with bone mineralization; use of contraceptives 24 months prior to data collection; pregnancy at any time; and absence on dates assigned for the study data collection. The dietary exclusion criteria were: practices of an exclusively vegetarian diet and high fiber diet; caffeine consumption; soft drink consumption over 300mL/day; and lack of dairy product consumption. These rigorous selection criteria were applied in order to minimize interference from factors that could affect normal bone metabolism during puberty.
Based on the inclusion criteria, eligible adolescents were invited to have their weight and height measured. Those participants fitting the parameter criteria were subsequently questioned about smoking and alcohol consumption. Selected adolescents were invited to participate in the study as volunteers; a full explanation of methods and procedures was provided to participants and their parents or guardians, including information about the option to withdraw from the study at any time.
Parents and guardians were interviewed and participants underwent general and specific physical examinations for detection of any physical abnormality (adolescents with chronic congenital infection and major congenital anomalies) that could interfere with the study expected results. Secondary sexual characteristics were evaluated and results compared to the Tanner criteria for breast development (B). The average age at menarche in the group of participants was similar to that in the Brazilian population (12.2 years old).16 Skeletal maturation was evaluated by the determination of bone age (BA) according to the GP method described by Greulich and Pyle.17 The parameters of chronological age (CA), bone age, and pubertal stage of breasts (B) were divided into five groups. Group CA1 was composed of females aged 10 years; CA2, ages 11 and 12 years; CA3, ages 13 and 14 years; CA4, ages 15 and 16 years; and CA5, ages 17 to 20 incomplete years. The BA groups were divided into BA1: bone age (BA) 10 and 11 years; BA2: BA 12 and 13 years; BA3: BA 14 and 15 years; BA 4: BA 16 and 17 years; and BA 5: BA 18 and 19 years. Dietary characterization was subsequently measured using a non-consecutive three-day dietary record.18 Questionnaires for centesimal quantification of food were applied and analyzed using a computer system developed by the Department of Nutrition at the School of Public Health from the Universidade de São Paulo.19
Participants who completed all initial steps underwent bone mass evaluation using a bone densitometry unit and by attenuation of dual energy X-ray (DXA) using a Hologic QDR 2000-Plus (Hologic Inc., Waltham, MA, USA) according to recommendations of the International Society for Clinical Densitometry.20 BMD results were expressed in g/cm2. Measurements from the L1–L4 lumbar spinal region, total proximal femur (including the femur neck, trochanteric, and intertrochanteric regions), Ward area, and whole body densitometry were taken. The amount of radiation to which participants were exposed was considered safe and not harmful to their current and future life.20
Blood collectionBlood samples were collected by venous puncture and centrifuged by 15minutes at 1,500g for serum separation; serum samples were stored at -70°C until analyses of BAP and OC and carboxy terminal telopeptide (S-CTx) biomarkers. BAP and OC were measured using the assay (Metra™ Biosystems, San Diego, CA, USA), with intra- and inter-assay coefficients of variation of 8% and 7.6%, respectively. S-CTx was quantified by an electrochemiluminescence assay using a commercial ß-Cross Laps/serum kit (Roche Diagnostic Corporation, Indianapolis, IN, USA) and Elecsys 1010 (Roche Diagnostic Corporation, Indianapolis, IN, USA); the inter-assay coefficient of variation was 5%.
Statistical analysisDescriptive statistics data were expressed as mean±standard deviation using analysis of variance and the Student-Newman-Keuls method. Kruskal Wallis analysis of variance and the Dunn test were performed for comparisons between bone biomarkers and CA, BA, and B when the Shapiro-Wilk test showed non-normal distribution for these data. Spearman coefficients of correlation were calculated between bone biomarkers and BMD results in the evaluated locations and CA, BA, and B. Minimum statistical difference was considered at 5%. Graphical representation included mean DXA values and median bone biomarker concentrations in relation to CA, BA, and B.
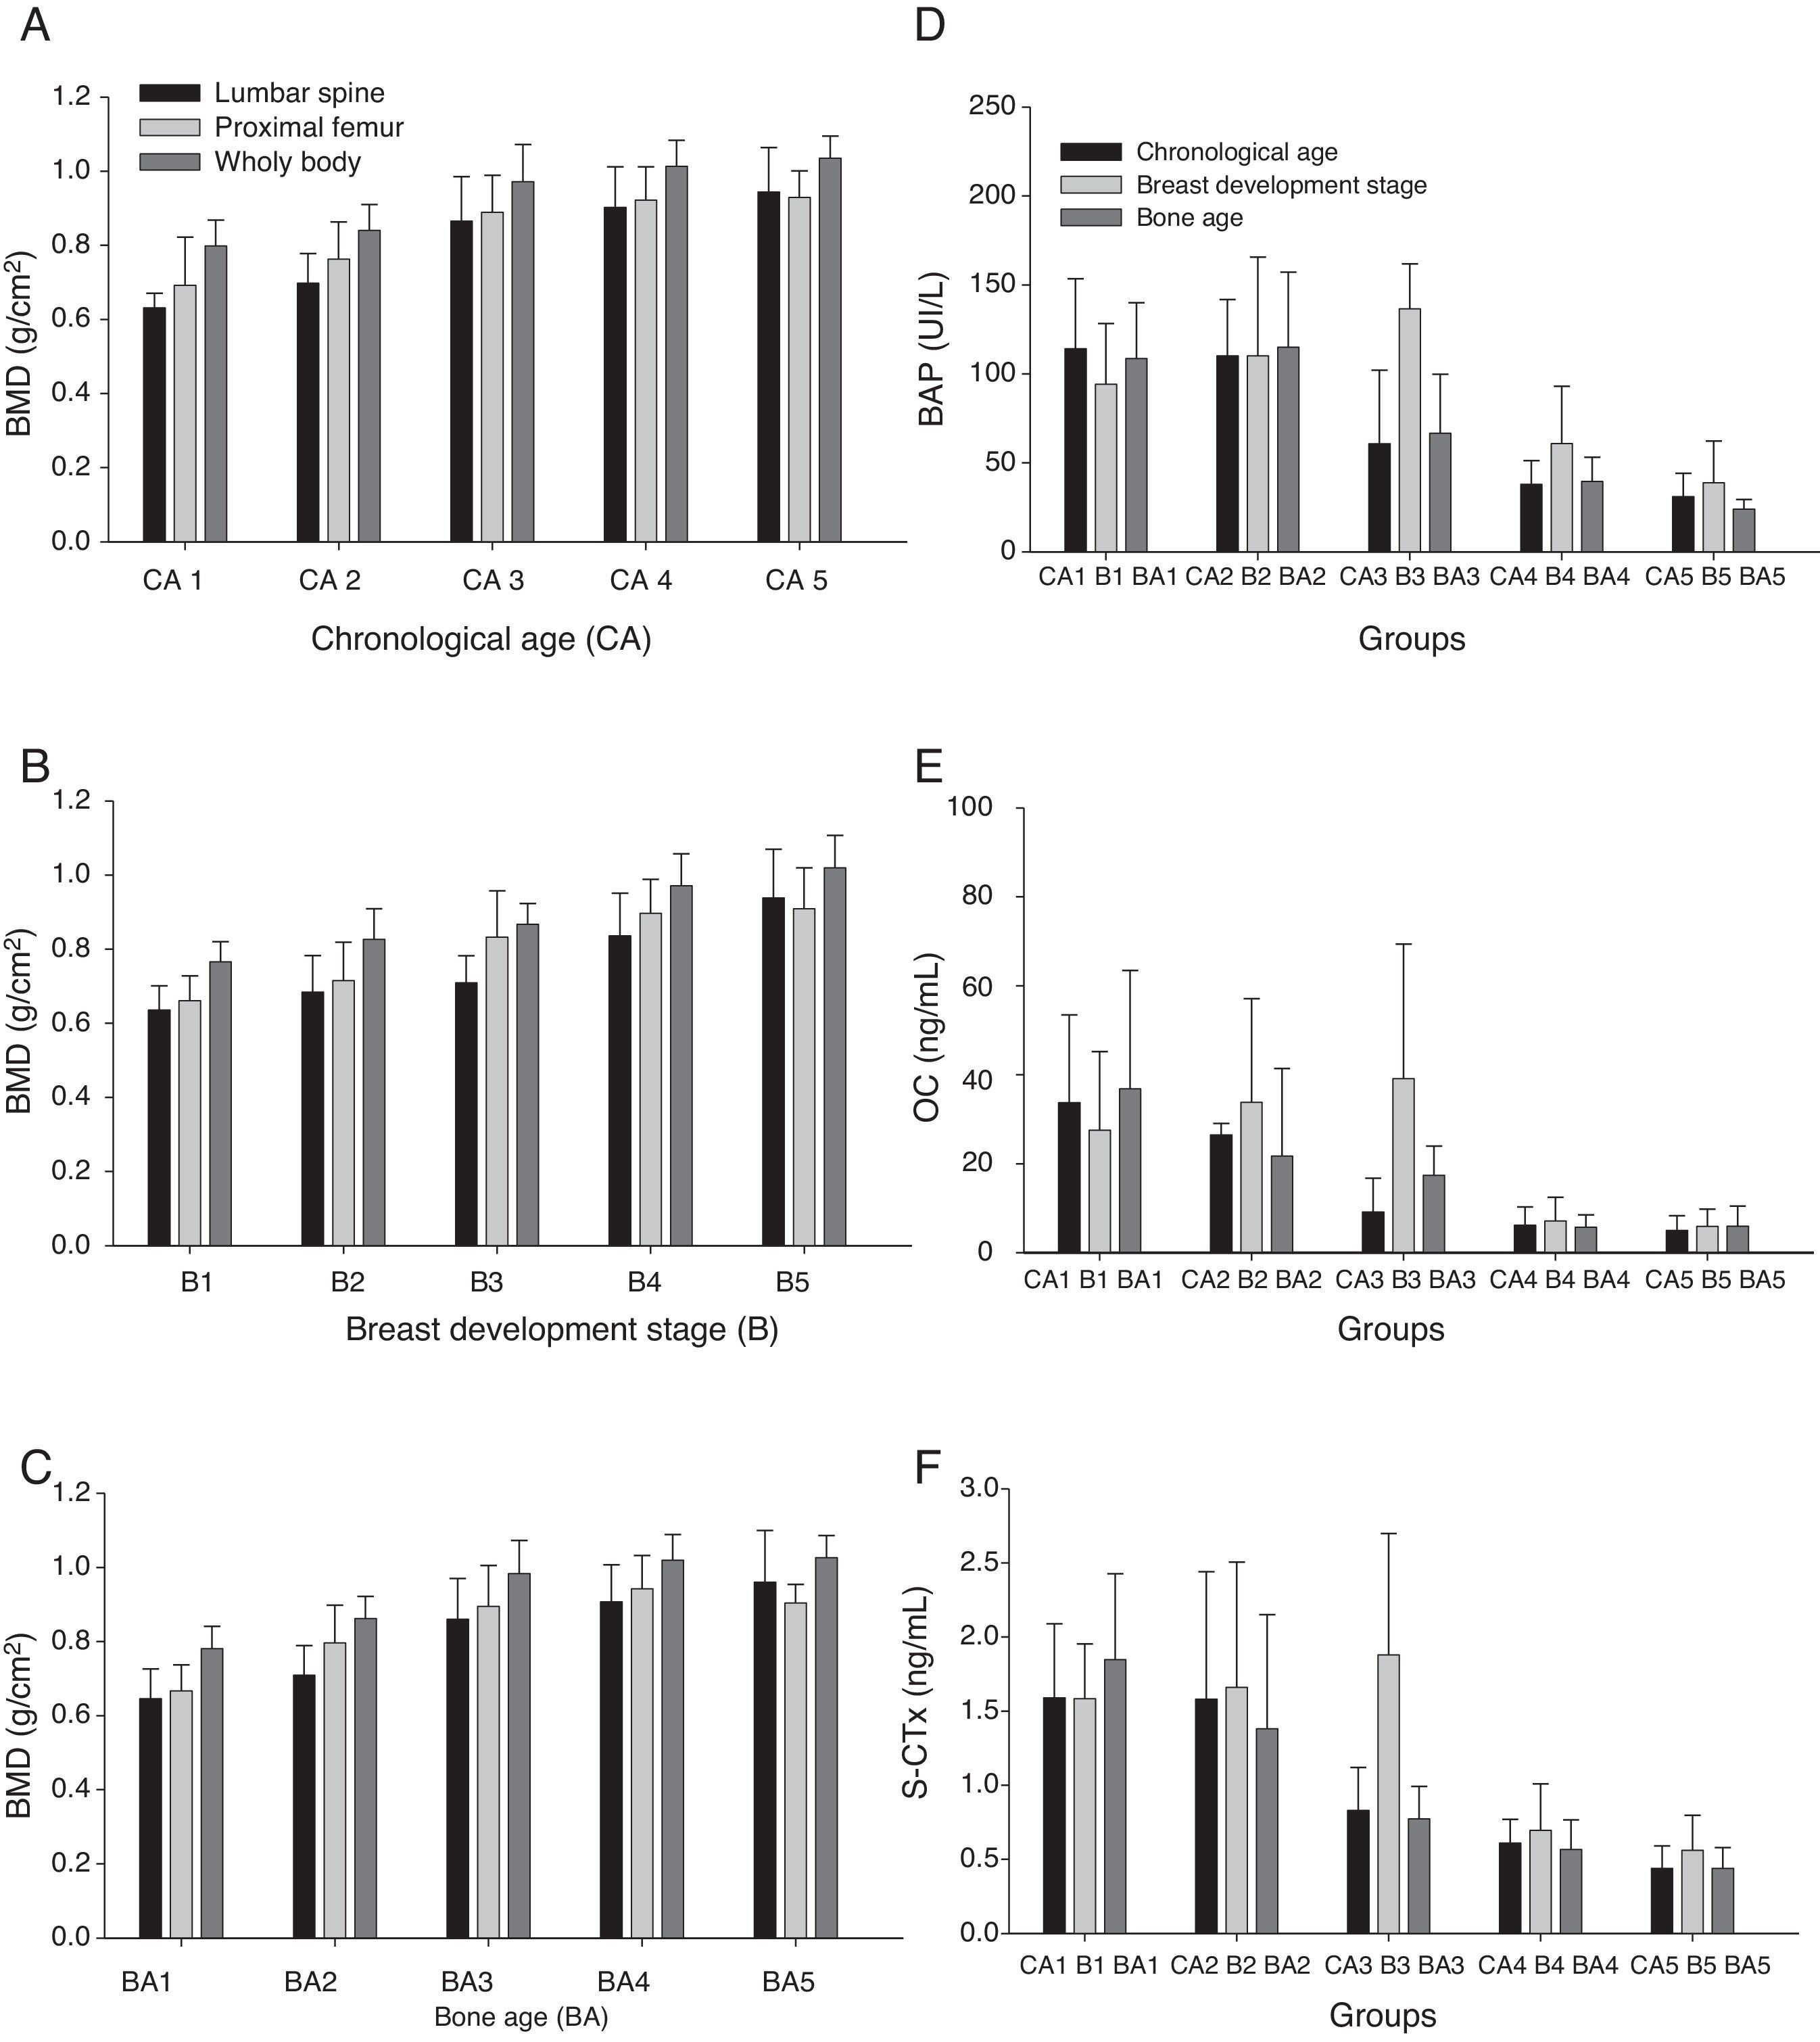
ResultsWeight, height, BMI, and BMD, measured in the three analyzed sites, increased with age, pubertal stage of breasts, and bone age (Table 1, and Fig. 1 A-C). The concentrations of all bone formation and reabsorption biomarkers (BAP, OC, and S-CTx) reduced with age; the highest concentrations were observed in CA1 and the lowest in CA5, which is the late phase of puberty (Fig. 1 D-F).
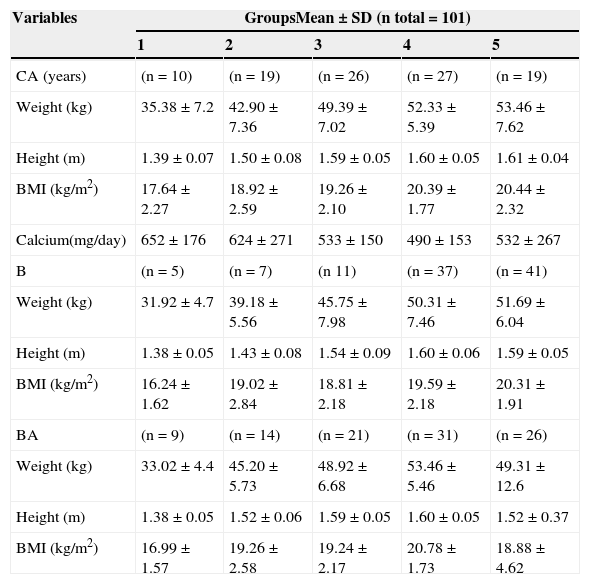
Mean and standard deviation (SD) of nutritional indicators and calcium intake according to chronological age (CA), breast development stage (B) and bone age groups (BA).
| Variables | GroupsMean±SD (n total=101) | ||||
|---|---|---|---|---|---|
| 1 | 2 | 3 | 4 | 5 | |
| CA (years) | (n=10) | (n=19) | (n=26) | (n=27) | (n=19) |
| Weight (kg) | 35.38±7.2 | 42.90±7.36 | 49.39±7.02 | 52.33±5.39 | 53.46±7.62 |
| Height (m) | 1.39±0.07 | 1.50±0.08 | 1.59±0.05 | 1.60±0.05 | 1.61±0.04 |
| BMI (kg/m2) | 17.64±2.27 | 18.92±2.59 | 19.26±2.10 | 20.39±1.77 | 20.44±2.32 |
| Calcium(mg/day) | 652±176 | 624±271 | 533±150 | 490±153 | 532±267 |
| B | (n=5) | (n=7) | (n 11) | (n=37) | (n=41) |
| Weight (kg) | 31.92±4.7 | 39.18±5.56 | 45.75±7.98 | 50.31±7.46 | 51.69±6.04 |
| Height (m) | 1.38±0.05 | 1.43±0.08 | 1.54±0.09 | 1.60±0.06 | 1.59±0.05 |
| BMI (kg/m2) | 16.24±1.62 | 19.02±2.84 | 18.81±2.18 | 19.59±2.18 | 20.31±1.91 |
| BA | (n=9) | (n=14) | (n=21) | (n=31) | (n=26) |
| Weight (kg) | 33.02±4.4 | 45.20±5.73 | 48.92±6.68 | 53.46±5.46 | 49.31±12.6 |
| Height (m) | 1.38±0.05 | 1.52±0.06 | 1.59±0.05 | 1.60±0.05 | 1.52±0.37 |
| BMI (kg/m2) | 16.99±1.57 | 19.26±2.58 | 19.24±2.17 | 20.78±1.73 | 18.88±4.62 |
Note: ANOVA followed by Student-Newman Keuls.
BMI, body mass index.
Chronological age groups (years of age): CA1-10; CA2- 11- 12; CA3- 13-14; CA4- 15; CA5- 17-19.
Weight: CA1<CA4 and CA5; CA2<CA4 and CA5; p<0.001
Height: CA1<CA2, CA3, CA4 and CA5; CA2<CA3, CA4 and CA5; p<0.001
BMI: CA1<CA4 and CA5; p<0.001
Calcium: p=0.407
Breast development stage groups (Tanner criteria)
Weight: B1<B3, B4 and B5; p<0.001
Height: B1<B4 and B5; B2<B4 and B5; p<0.001
BMI: B1<B5; B1<B4; p<0.001
Bone agegroups (Greulich&Pyle):BA1- 10-11 years, BA2-12-13 years, BA3-14-15 years, BA4-16-17 years, BA5-18-19 years
Weight: BA1<BA2, BA3, BA4 and BA5; BA2<BA4 and BA5; p<0.001
Height: BA1<BA3, BA4 and BA5; BA2<BA3, BA4 and BA5; p<0.001
BMI: BA1<BA4 and BA5; p<0.001
 means and standard deviations of lumbar spine, proximal femur, and whole body values in g/cm2 according to age ranges (A); breast development stage (B); and bone age (C). Bone alkaline phosphatase (BAP) (D); osteocalcin (OC) (E); and C-terminal telopeptide (S-CTx) (F); medians according to age-ranges, breast development stage, and bone-age groups.")
Graphic representation of bone mass density (BMD) means and standard deviations of lumbar spine, proximal femur, and whole body values in g/cm2 according to age ranges (A); breast development stage (B); and bone age (C). Bone alkaline phosphatase (BAP) (D); osteocalcin (OC) (E); and C-terminal telopeptide (S-CTx) (F); medians according to age-ranges, breast development stage, and bone-age groups.
Significant differences in weight were observed between age groups (CA4 and CA5 differed from groups CA1 and CA2, with p<0.01).
Calcium ingestion ranged from 489±153 mg/day to 652±176 mg/day; the mean±SD for the whole sample was 566±210 mg/day (Table 1).
The BMD (lumbar spine, proximal femur, and total body) analyses showed differences in groups CA3, CA4, and CA5, which differed from groups CA1 and CA2 with p<0.01 in all study sites; values in group CA3 were intermediate (Fig. 1 A-C).
BMD values (lumbar spine, proximal femur, and total body) differed significantly between B (p<0.01). Groups B4 and B5 showed the highest mean BMD values in all sites, and group B3 showed intermediate mean value (Fig. 1B).
BAP, OC, and S-CTx bone remodeling biomarkers had significantly different concentrations at the beginning of puberty. The median concentrations in CA1 and CA2 were significantly higher than those in CA3, CA4, and CA5 (p<0.001). Median BAP concentrations in CA3 were higher than those in CA5; in addition, no significant difference between CA4 and CA5 median concentrations was observed. Changes in OC concentrations according to age followed a similar trend to those observed for BAP. The same trend was observed for S-CTx (p<0.001; Fig. 1). The highest S-CTx medians were observed in CA1 and CA2, which differed from CA5 (Fig. 1 D-F).
Significant differences in weight and height were observed in participants in BA2 and BA1. These differences were also observed in the BA3, BA4, and BA5 groups, which presented means of weight and height higher than those in BA1 (Table 1).
Differences in BMD values were initially observed in the BA3 group, which differed from the BA1 and BA2 groups with p<0.01 in all BMD values and in all studied sites. The BMD means increased from the low BA groups towards the high BA groups (Fig. 1C).
Significant differences in bone remodeling biomarkers were recorded in all studied variables (BAP, OC, and S-CTx) when presented according to BA; BA1 and BA2 medians were higher than BA4 and BA5 medians (Fig. 1 D-F).
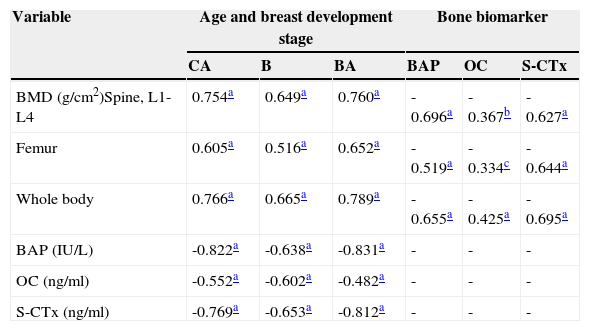
A significant positive correlation between BMD values, for both CA and BA, was observed with maturation level (Table 2); bone remodeling biomarkers (BAP, OC, and S-CTx) presented a significant negative correlation with CA, BA, and breast development (Table 2). This finding demonstrated that the more mature the participants were, the higher their BMD values were. Correlation was significant but negative between the age of participants and bone remodeling biomarker concentrations; the more mature the participants were, the lower their bone biomarker concentrations were (Table 2).
Coeficient of Spearman's correlation between bone mineral density (BMD) measurements (g/cm2), bone biomarker concentrations (bone alkaline phosphatase, osteocalcin, C- terminal teleopeptide), chronological age (CA), Breast development stage (B) and bone age (BA).
| Variable | Age and breast development stage | Bone biomarker | ||||
|---|---|---|---|---|---|---|
| CA | B | BA | BAP | OC | S-CTx | |
| BMD (g/cm2)Spine, L1-L4 | 0.754a | 0.649a | 0.760a | -0.696a | -0.367b | -0.627a |
| Femur | 0.605a | 0.516a | 0.652a | -0.519a | -0.334c | -0.644a |
| Whole body | 0.766a | 0.665a | 0.789a | -0.655a | -0.425a | -0.695a |
| BAP (IU/L) | -0.822a | -0.638a | -0.831a | - | - | - |
| OC (ng/ml) | -0.552a | -0.602a | -0.482a | - | - | - |
| S-CTx (ng/ml) | -0.769a | -0.653a | -0.812a | - | - | - |
BAP, bone alkaline phosphatase; OC, osteocalcin; S-CTx, C-terminal teleopeptide; L1-L4, lumbar spine 1 and 4.
Significance of Spearman's correlation.
Table 2 shows the data from the coefficient of correlation analysis between bone remodeling biomarkers and BMD values. These results demonstrate a negative and significant correlation between BMD values and bone biomarker concentrations.
DiscussionThe present study observed significant negative correlations between concentrations of bone remodeling biomarkers and CA, BA, breast development, and BMD values. Such evidence reveals inversely proportional outcomes in remodeling biomarkers and variables that represent time and bone mass maturation. Thus, although the BMD values increased with the advancement of maturation events, the concentrations of the three biomarkers reduced with age at the end of adolescence, starting from 15 to 16 years of age (Fig. 1).
Other authors have also observed the lowest bone biomarker concentrations at the end of puberty, and have reported biomarker concentrations in 18-year-old females that are similar to those in adults.13,21,22
Boot et al.8 observed that peak bone mass, both in the lumbar region and in the whole body, occurred between 18 and 20 years of age in a group of 360 females. Silva et al.23,24 and Moretto et al.25 showed that mean BMD values in all evaluated sites increased with age, skeletal maturation, and bone age in Brazilian adolescents. In these studies, the lowest BMD values were observed in 10-year-old females and the highest ones in females aged 17 years or over. The most critical periods for bone mass growth were reported to be between 13 and 14 years of age, in females at breast stage B3, and between 13 and 15 years in males at G4 stage. These results corroborate the present findings, suggesting the existence of a window of opportunity for bone mass gain, between 13 and 14 years of age and B3, in the cited maturation periods; the linear regression analyses showed BMD gains of 0.0574, 0.0592, and 0.0654g/cm2 in lumbar spine, proximal femur, and total body, respectively, in each year of growth in CA.
The literature is clear and in agreement that reaching the highest possible peak bone mass during adolescence is an important and possibly the main preventive factor against occurrence of senile osteoporosis.26
The fact that biomarkers produce sensitive and accurate readings of changes in bone metabolism should contribute to their wider use in clinical practice. Blood biomarker measurements can be repeated more frequently than the more commonly used quantitative radiological methods, because blood samples are comparatively easy to obtain. Despite difficulties in the analysis and interpretation of biomarker results due to their biological variability in the course of an individual's life time,3 there are advantages in the use of these markers.
It is therefore possible to anticipate that, when individuals present healthy development evolution in infancy and puberty, free of conditions that interfere with bone metabolism, bone formation markers would be found proportionally more active in the first two decades of life than reabsorption markers. Some other factors can affect bone remodeling biomarker concentrations, such as genetic factors, age, secondary sexual signs that represent visible evolution to puberty, lifestyle, nutrition, and physical exercise.27
Tuchman et al.22 observed a correlation between bone biomarkers and peak height velocity (PHV), demonstrating a parallelism between increased marker concentrations and height velocity. Despite this, Harel et al.11 emphasized that the BMD values still continued to increase with increasing age, with a maximum increase around menarche, which is when girls are already decelerating height velocity. This evolution was also observed in the present data. Sequentially, peak bone mass will finally be reached at the moment when growth rate in height reduces. The final height, in these adolescents, was attained when they reached the B4-B5 breast developmental stages. As previously stated, peak height velocity (PHV) occurs at the same time as the B3 breast developmental stage or a little after it. This behavior is similar to that observed in bone markers showing the highest concentrations in this developmental stage, reinforcing the relationship between these events and hormonal factors involved in these processes. From this perspective, van Coeverden et al.13 and Yilmaz et al.6 evaluated the magnitude of the relationship between bone turnover and peak height velocity (PHV) analyzed by the levels of some bone markers and evaluating sex steroid levels, insulin-like growth factor (IGF-1), and insulin-like growth factor binding protein 3 (IGF-BP-3).
Hence, these considerations allow for the understanding of high levels of correlation between bone biomarkers and bone mineral densities observed in our statistical analysis.
Yilmaz et al.6 evaluated 91 Turkish pubescent females and 83 males, 11 to 15 years old. Their inclusion criteria, although very precise, were not as rigid and restrictive as the present study's. The authors evaluated BMD in the lumbar spine and whole body, as well as estradiol and testosterone levels, and measured bone formation markers (OC and BAP) in both genders. Their results of maximum increase in BMD occurring in puberty stage 3 corroborate the present results. These authors observed that mean OC concentrations were higher in females in Tanner stage 3 than at B4 or B5 and steadily decreased towards the end of puberty. This behavior was not as expressive in BAP; however, it showed that concentrations from mid-puberty were higher than those at the end of puberty with significant differences in girls (p<0.001). Furthermore, Yilmaz et al.6 demonstrated significant negative correlation between BMD and the evaluated bone markers, which corroborates the results observed in the present study.
Longitudinal studies performed to evaluate height velocity curve and maximum concentrations of bone formation markers could contribute to confirm the parallelism indirectly observed between these variables.
Through analyses of biomarkers, the present study demonstrates the changes in bone remodeling occurring in the second decade of life, revealing high marker concentrations in the early adolescence years and significantly reduced concentrations in late adolescence. These analyses correlate to the BMD values, which represent bone mass incorporation, and indicate an inversely proportional behavior showing the highest BMD values associated with the lowest concentrations of formation and reabsorption of biomarkers.
Ideally, the present study should have had a longitudinal design including a higher number of participants from a more comprehensive sampling in similar cohorts (schools). Despite this limitation, the strict inclusion criteria favored an accurate interpretation of results for bone gain and metabolism during adolescence.
The results from the present study complement published work on the subject and improve the understanding of bone mass changes during adolescence.
FundingThe presente study was supported by FAPESP (Fundação de Amparo à Pesquisa do Estado de São Paulo) – Process No: 2007/07731-0 and 2011/05991.
Conflicts of interestThe authors declare no conflicts of interest.
This study received grants from FAPESP (2007/07731-0 and 2011/05991) and Prope-UNESP (Pro-Reitoria de Pesquisa da UNESP). The authors greatly thank the pediatricians, technicians of general sample collection room of the Clinical Laboratory-Botucatu General Hospital of Botucatu Medical School-UNESP, and technicians of the Pediatrics Laboratory Research of the Pediatrics Department.
Please cite this article as: Fortes CM, Goldberg TB, Kurokawa CS, Silva CC, Moretto MR, Biason TP, et al. Relationship between chronological and bone ages and pubertal stage of breasts with bone biomarkers and bone mineral density in adolescents. J Pediatr (Rio J). 2014;90:624–31.


