
Children with spina bifida (SB) are at risk for stunting and overweight. However, height and Body Mass Index (BMI) z-score distribution in children and adolescents with SB are unclear. The aim of this study was to examine height and BMI z-score distribution in Brazilian children and adolescents with and without SB. This study further aimed to examine whether height and BMI z-scores differ between individuals with and without SB.
MethodThis study included 101 participants (SB: n = 18; non-SB: n = 83, aged 7–16 years). The World Health Organization (WHO) AnthroPlus software was used to calculate height and BMI z-scores. AnthroPlus z-score distribution graphs were used to examine individual z-scores based on the 2007 WHO normal distribution curve. Effects of the group (SB vs non-SB) on height and BMI z-scores were examined with sequential regression.
ResultsIn the WHO distribution graph analysis, height z-scores of participants with SB were slightly left-shifted compared to the WHO normal distribution curve. In the regression analysis, group (SB vs non-SB) was a significant predictor of height z-scores after controlling for sex and age (ΔR2 = 0.064, p = 0.010). BMI z-scores of participants with SB were right-shifted compared to the WHO normal curve. However, there was no contribution of the group to BMI z-scores (ΔR2 = 0.011, p = 0.301).
ConclusionsThese findings suggest that Brazilian children and adolescents with SB may be at risk for reduced height and increased BMI.
Spina bifida (SB) is a condition characterized by failed neural tube closure, motor and sensory neurological deficit, and lower limb weakness or paralysis1 with birth prevalence estimates ranging from 34 to 81 per 100 000 live births.2 Compared with the general population, children and adolescents with SB have impaired executive functions, attention, and social skills,3 lower cardiorespiratory fitness,4 sleep difficulties,5 and lower levels of physical activity.6 Additionally, previous studies demonstrated that children and adolescents with SB are at risk for growth disorders7-9 compared to their peers without SB. Given that growth disorders are associated with cardiovascular and respiratory diseases, depression, and type 2 diabetes,10,11 there is a need for monitoring growth in children and adolescents with SB.
Growth is a fundamental indicator of children's well-being.10 Growth measures including height and Body Mass Index (BMI) have been extensively examined in children and adolescents.12 It has been established that school-aged children and adolescents have experienced reduced height and increased BMI,13 but this has not been clearly established in those with SB. Since individuals with SB are at risk for increased morbidity,1 it is reasonable to expect that height and BMI may be altered in individuals with SB. Three studies observed that children and adolescents with SB were at risk for reduced height.7-9 Specifically, European data demonstrated that the height data of children and adolescents with SB were below -2 z-scores compared with the European growth reference.7,8 Another study indicated that children and adolescents with SB had lower height percentiles according to Centers for Disease Control and Prevention (CDC) growth reference9 than their peers without SB. With respect to BMI, Wren et al.9 observed that school-aged children and adolescents with SB had higher mean BMI percentiles than their peers without SB.
Cross-country differences in height and BMI z-score distribution have been observed in children and adolescents, especially in those from low- and middle-income countries (LMICs).13 To our knowledge, however, there are no studies that have reported height and BMI z-score distribution in children and adolescents with SB from LMICs. Monitoring the height and BMI distribution would support programs for reducing growth disorders in SB. Therefore, the aim of this study was to examine height and BMI z-score distribution in Brazilian children and adolescents with and without SB using the World Health Organization (WHO) growth reference. This study further aimed to examine whether height and BMI z-scores differ between children and adolescents with and without SB. The authors hypothesize that children and adolescents with SB are at risk for reduced height and increased BMI.
MethodsParticipantsParticipants with SB were recruited via the Rehabilitation Center at the University of São Paulo, Ribeirão Preto, Brazil. Controls without SB (non-SB) were recruited from nearby communities. The inclusion criteria were: (1) ages 5-19 years based on WHO growth reference age criteria; (2) independent ambulation; (3) no orthopedic conditions that could limit testing performance; and (4) ability to understand testing procedures. The study included participants who met all the inclusion criteria: i) 18 participants with SB (7 males and 11 females; aged 8-15 years); all were residents from Ribeirão Preto mesoregion, São Paulo state, Brazil; ii) 83 non-SB participants (46 males and 37 females; aged 7-16 years); all were from Ribeirão Preto city. The study protocol was approved by the ethics committee of the Ribeirão Preto Clinical Hospital, University of São Paulo. Ethical guidelines of the Declaration of Helsinki were used to guide all procedures. Written informed consent was obtained from all participants and their parents/guardians.
ProceduresParticipants and parents/guardians provided demographics (age and sex) and health condition status. Thereafter, participants underwent anthropometrics (weight and standing height). Experienced technicians obtained the participant's body weight and height following standardized procedures. Body weight and height were obtained with participants wearing light clothing and no shoes. Body weight was measured with a digital scale to the nearest 0.1 kg. Standing height was measured with a stadiometer to the nearest 0.1 cm. The WHO AnthroPlus software14 was used to calculate BMI (kg m−2) values, and height and BMI z-scores.
Height and BMI z-scoresTo obtain height and BMI z-scores, age (in months), sex (male or female), height (in cm), and weight (in kg) were imported into WHO AnthroPlus software. This software derives the exact z-scores based on interpolation using the L, M, and S values from the WHO growth reference for school-aged children and adolescents.12 Weight z-scores were not considered in this study because there is no weight-for-age reference data for participants aged > 10 years. The authors examined outliers using the AnthroPlus default lower and upper z-scores boundaries (i.e., BMI: −6 and +6 z-scores; and height: −5 and +5 z-scores).
Statistical analysesParticipants’ height and BMI z-score distribution were compared to the WHO height and BMI z-score normal distribution curve using the Anthroplus distribution graph.14 Mean height and BMI z-scores were determined using the AnthroPlus software. Independent-sample t-tests were used to compare mean height and BMI z-scores between participants with and without SB. Mann-Whitney U tests were used to compare sex, age, and BMI between participants with and without SB. Sequential multiple regression was used to examine the prediction of the group (SB vs non-SB) on height and BMI z-scores after controlling for sex and age. Independent variables were entered in the following order: (1) sex; (2) age; and (3) group. The alpha level was set at 0.05. SPSS Statistics 22 (IBM, Armonk, NY) was used to perform statistical analyses.
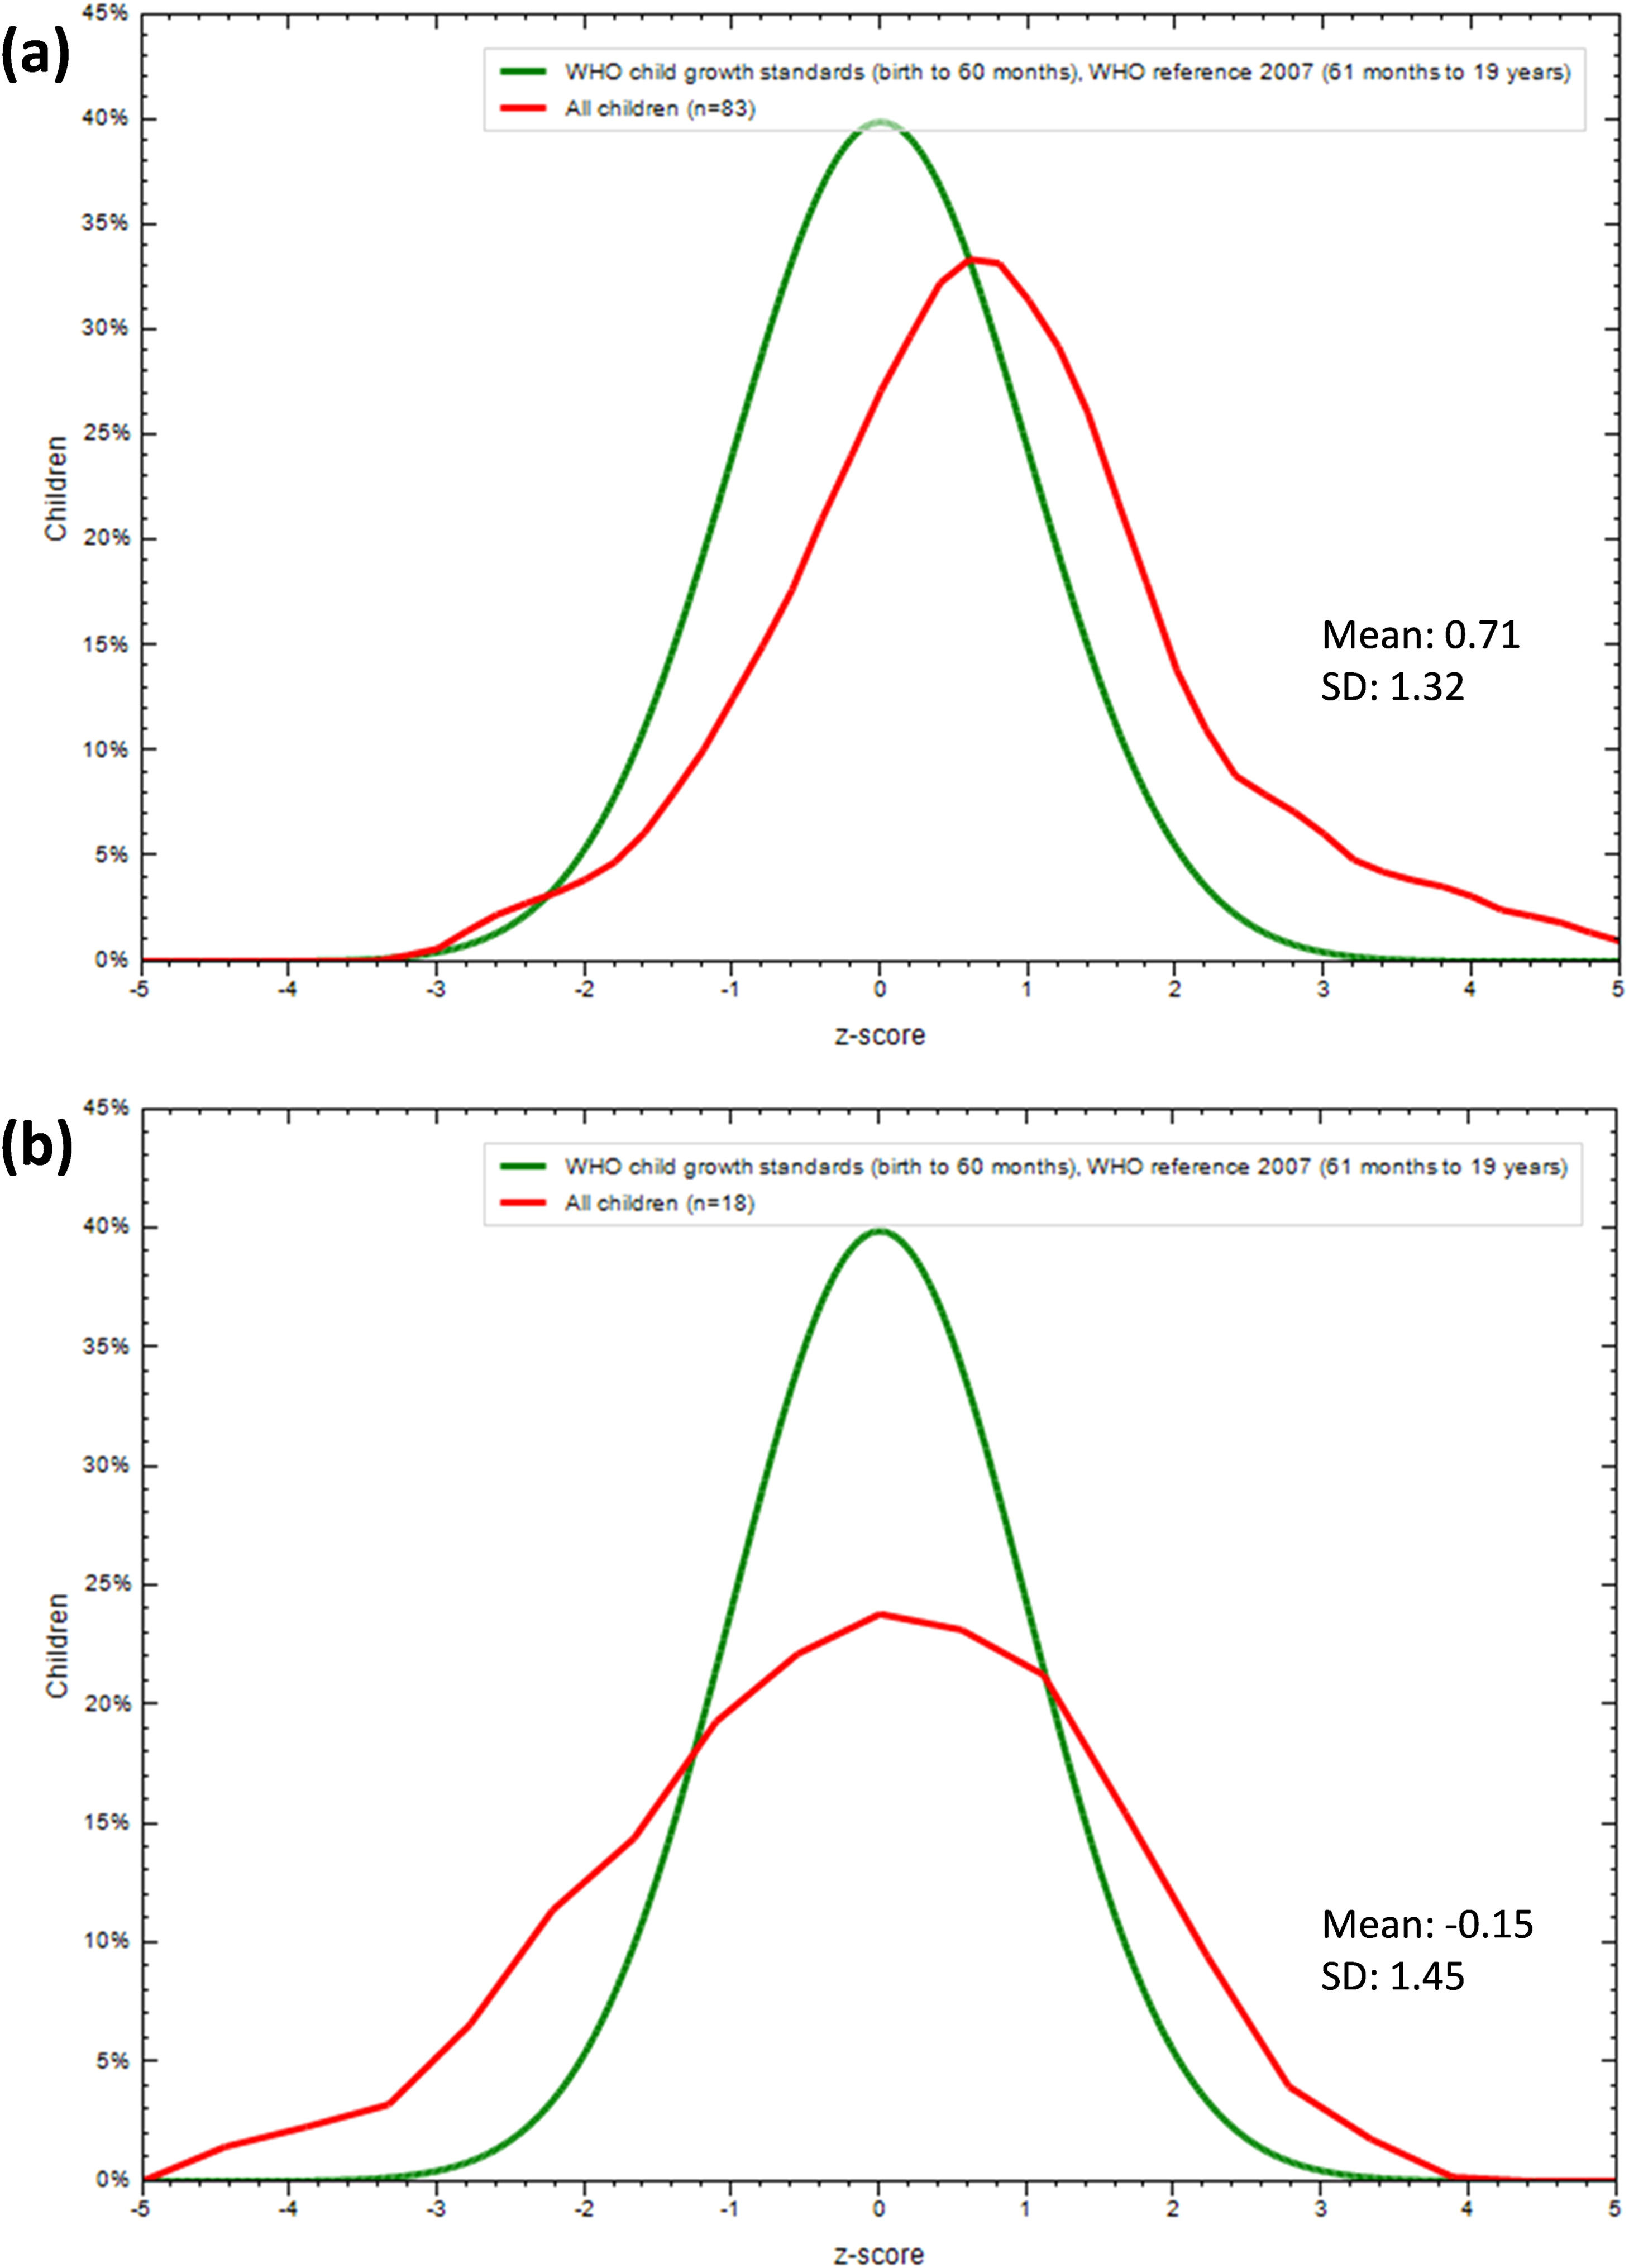
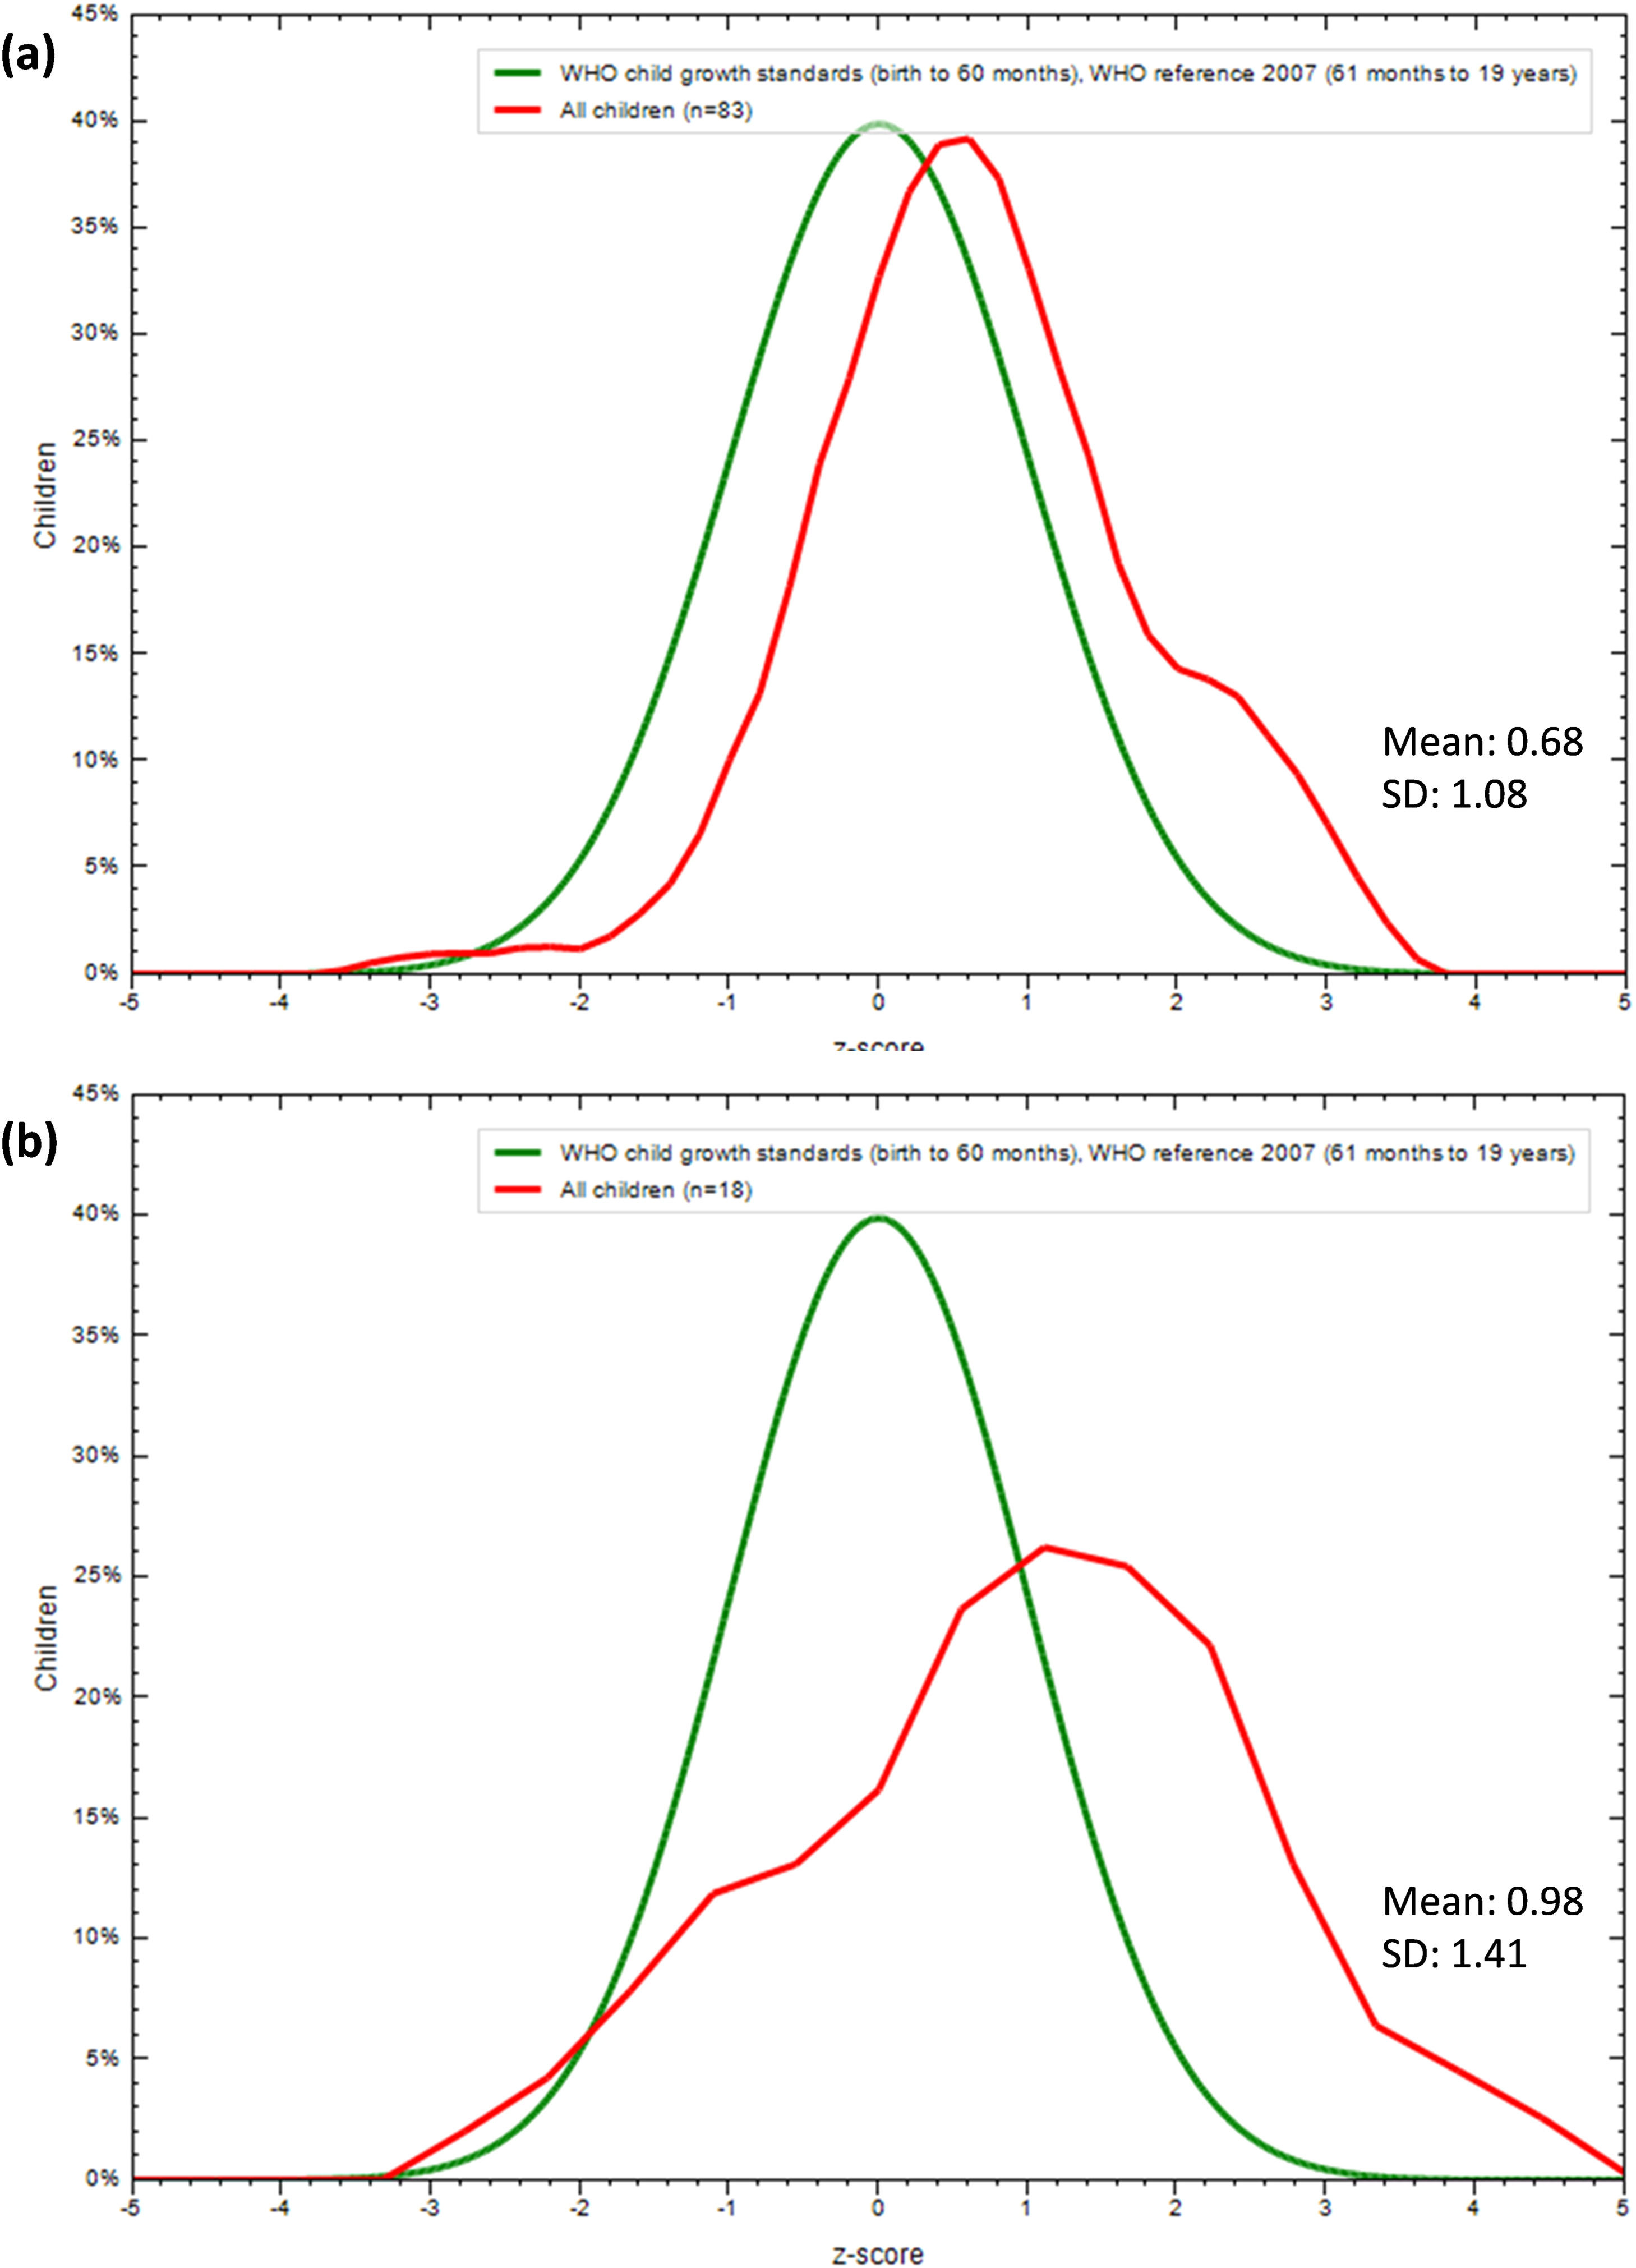
ResultsCharacteristics of the participants are presented in Table 1. The authors included 101 participants (SB: n = 18; 11.10 ± 2.49 years; non-SB: n = 83, 12.13 ± 2.75 years). Participants with SB had lower height than their peers without SB (p < 0.05). There were no significant differences in age and BMI between participants with and without SB. Mean height z-scores differed significantly between groups (SB: −0.15 ± 1.45 z-scores; non-SB: 0.71 ± 1.32 z-scores; p = 0.015). There were no significant differences in mean BMI z-scores between groups (SB: 0.98 ± 1.41 z-scores; non-SB: 0.68 ± 1.08 z-scores; p = 0.320).
Characteristics of participants with and without spina bifida.
| Characteristics | Non-SB (n = 83) | SB (n = 18) | P |
|---|---|---|---|
| Male: Female (n) | 46: 37 | 7: 11 | 0.205b |
| Age (years) | 12.13 ± 2.75 | 11.10 ± 2.49 | 0.158b |
| Height (cm) | 153.59 ± 15.21 | 142.89 ± 15.78 | 0.008a⁎ |
| BMI (kg•m−2) | 20.21 ± 4.04 | 20.79 ± 4.46 | 0.424b |
| WHO Height z-score | 0.71 ± 1.32 | −0.15 ± 1.45 | 0.015a⁎ |
| WHO BMI z-score | 0.68 ± 1.08 | 0.98 ± 1.41 | 0.320a |
Note: data are presented as mean ± SD, and frequencies (n); SB, spina bifida; BMI, Body Mass Index; WHO, World Health Organization.
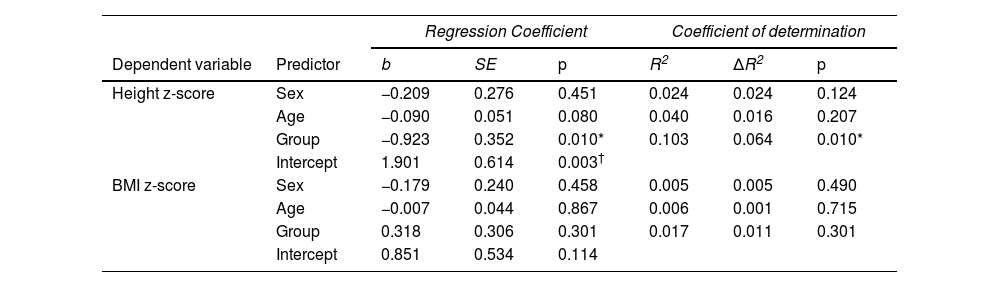
Height and BMI z-score distribution are presented in Figures 1 and 2. Height and BMI z-scores of participants without SB were slightly right-shifted compared to the WHO normal distribution curve (Figures 1A and 2A). Z-scores of participants with SB were slightly left-shifted for height (Figure 1B) and right-shifted for BMI (Figure 2B) compared to the WHO normal curve. Sequential multiple regression analysis is presented in Table 2. As shown, group (SB vs non-SB) was a significant predictor of height z-scores after controlling for sex and age (ΔR2 = 0.064, p = 0.010). However, there was no significant contribution of the group to BMI z-scores (ΔR2 = 0.011, p = 0.301).
. Height z-score distribution of children and adolescents with spina bifida aged 8-15 years compared to the WHO normal distribution curve (b).")
Height z-score distribution of children and adolescents without spina bifida aged 7-16 years compared to the WHO normal distribution curve (a). Height z-score distribution of children and adolescents with spina bifida aged 8-15 years compared to the WHO normal distribution curve (b).
. Body Mass Index z-score distribution of children and adolescents with spina bifida aged 8-15 years compared to the WHO normal distribution curve (b).")
Body Mass Index z-score distribution of children and adolescents without spina bifida aged 7-16 years compared to the WHO normal distribution curve (a). Body Mass Index z-score distribution of children and adolescents with spina bifida aged 8-15 years compared to the WHO normal distribution curve (b).
Regression analysis of sex, age, and disability condition on height and Body Mass Index z-scores.
| Regression Coefficient | Coefficient of determination | ||||||
|---|---|---|---|---|---|---|---|
| Dependent variable | Predictor | b | SE | p | R2 | ΔR2 | p |
| Height z-score | Sex | −0.209 | 0.276 | 0.451 | 0.024 | 0.024 | 0.124 |
| Age | −0.090 | 0.051 | 0.080 | 0.040 | 0.016 | 0.207 | |
| Group | −0.923 | 0.352 | 0.010* | 0.103 | 0.064 | 0.010* | |
| Intercept | 1.901 | 0.614 | 0.003† | ||||
| BMI z-score | Sex | −0.179 | 0.240 | 0.458 | 0.005 | 0.005 | 0.490 |
| Age | −0.007 | 0.044 | 0.867 | 0.006 | 0.001 | 0.715 | |
| Group | 0.318 | 0.306 | 0.301 | 0.017 | 0.011 | 0.301 | |
| Intercept | 0.851 | 0.534 | 0.114 | ||||
Note: b, unstandardized coefficient; SE, standard error; ΔR2, R2 change; Sex, 0 = male and 1 = female; age is in years; Group, 0 = participants without spina bifida and 1 = participants with spina bifida.
This study indicated that height z-scores of children and adolescents with SB were slightly left-shifted compared to the WHO normal curve and that group (SB vs. non-SB) was a significant predictor of height z-scores. This study further observed that BMI z-scores of participants with and without SB were right-shifted compared to the WHO curve. Additionally, there was no contribution of the group to BMI z-scores after controlling for age and sex. These findings have implications for preventing and treating growth disorders in Brazilians with SB.
The present findings that height z-scores of Brazilian children and adolescents with SB were left-shifted compared to the WHO normal curve suggest that Brazilians with SB may be at risk for growth disorders. These findings are supported by previous studies observing that children and adolescents with SB were at risk for reduced height.7-9 Specifically, a Swiss study observed that participants with SB aged 4 to 14 years had mean height z-scores of < -2 according to Swiss growth reference.7 It is important to note that height z-score distributions from this study7 were derived from participants with SB who presented with some alterations in puberty status including early onset in secondary sex characteristics. Since the pubertal status of the participants is unknown, caution should be exercised when comparing the present results to the findings of these earlier investigations. Another study observed that mean height z-scores of participants with SB aged 3 to 11 years ranged from -0.54 to -4.77 compared to the Zurich Growth reference.8 The authors further observed a significant mean difference of 0.86 z-scores in height between groups, indicating that, on average, participants with SB were shorter than those without SB. Given that past research involving children and adolescents with SB and their peers without SB has not reported height z-score distribution data based on WHO age- and sex-specific growth references, direct comparisons with previous findings were limited. However, the present findings indicating lower height in participants with SB than controls without SB are aligned with a previous study that demonstrated lower height percentiles in children and adolescents with SB than their peers without SB based on CDC growth reference.9 Additionally, the present study is the first to indicate that group (SB vs non-SB) was a significant predictor of height z-scores after controlling for important confounders. The regression analysis indicated that the group explained 6.4 % of the variance in height z-scores after controlling for sex and age. The effect of SB on height z-scores was expected, but the extent was unknown when controlling for confounders. It has been demonstrated, however, that additional factors such as growth hormone (e.g., insulin-like growth factor 1) —not investigated in the present study8 —should be considered when examining mechanisms of growth disorders among children and adolescents with SB.
The present study indicated that BMI z-scores of participants with and without SB were right-shifted compared to WHO normal distribution curve. This finding is logical since children and adolescents are at risk for being overweight.13 Moreover, the authors observed a non-significant mean difference of 0.30 z-scores in BMI between the participants with and without SB. This finding is contrary to a previous study that examined BMI percentiles between participants with and without SB.9 Specifically, Wren et al.9 observed that CDC BMI percentiles of children and adolescents with SB were significantly higher compared to CDC BMI percentiles of those without SB. The differences between the present findings and those from Wren et al.9 may be explained by study design, including the use of different growth references. Moreover, the regression analysis indicated that the group did not explain a significant proportion of the variance in BMI z-scores after controlling for age and sex. Future research should examine BMI z-scores of children and adolescents with SB with different ambulatory levels. This was not possible in the present study because sample sizes were not appropriate to address this issue.
The present study has implications for clinical practice and research. Linear growth is an important overall indicator of well-being and an accurate marker of human development inequality.10 Failure to achieve healthy growth is associated with multiple pathological disorders. Taken together, the data and those from previous studies suggest that children and adolescents with SB may be at risk for reduced height and increased BMI. For example, based on the multivariate analysis, the authors observed that participants with SB exhibited a reduction in height, with an estimated effect size (b) of −0.92 z-score, which would correspond to a height of 132.7 cm for a 10-year-old girl, 6 cm shorter when based on the age-specific WHO female height reference.15 From a public health standpoint, being about one standard deviation taller, by contrast, has been associated with better academic achievement (e.g., write skills), a characteristic that has been found altered in the pediatric population with SB.16 Monitoring the height and BMI of participants with SB would support programs for preventing stunting and overweight in this population. It is important to note that interventions for improving growth outcomes have been recommended by several health agencies including the World Health Organization.12 Additionally, whether height and BMI z-scores might be associated with executive functions, cardiorespiratory fitness, sleep quality, and physical activity, should be addressed in future studies. Furthermore, Brazil is a large and developing country with a population differing substantially in terms of racial, ethnic, economic, and cultural backgrounds. More research is needed to examine the height and BMI z-score distribution of children and adolescents with SB across different geographical regions within Brazil.
This study has important limitations to be considered. First, there was a relatively small sample size of children and adolescents with SB. Second, all participants were ambulatory and may not be representative of the whole SB population. This study also has important strengths. First, height was measured at a standing position, allowing for accuracy of height and BMI z-scores. Second, the authors included a sample of children and adolescents without SB. Finally, this study used the WHO distribution graph analysis, enabling comparisons of participants’ z-score distribution curves with the WHO normal distribution curves.
In summary, the present study indicated that z-scores of participants with SB were slightly left-shifted for height and right-shifted for BMI compared to the WHO normal curve. Additionally, group (SB vs non-SB) was a significant predictor of height z-scores, but not of BMI z-scores. These findings suggest that Brazilians with SB may be at risk for reduced height and increased BMI.
FundingThis work was supported by the Sao Paulo Research Foundation (Grant numbers: 2022/00099-6; 2017/17596-4; 2022/04578-6).
Institution: Faculdade de Medicina de Ribeirão Preto, USP.


