to evaluate changes in the biochemical profile of children treated or being treated for moderate or severe stunting in a nutrition recovery and education center.
Methodsthis was a retrospective longitudinal study of 263 children treated at this center between August of 2008 to August of 2011, aged 1 to 6 years, diagnosed with moderate (z‐score of height‐for‐age [HAZ] < ‐2) or severe stunting (HAZ < ‐3). Data were collected on socioeconomic conditions, dietary habits, and biochemical changes, as well as height according to age.
Resultsthe nutritional intervention showed an increase in HAZ of children with moderate (0.51 ± 0.4, p = 0.001) and severe (0.91 ± 0.7, p = 0.001) stunting during the monitoring. Increased levels of insulin‐like growth factor 1 (IGF‐1) (initial: 71.7 ng/dL; final: 90.4 ng/dL; p = 0.01) were also observed, as well as a reduction in triglycerides (TG) in both severely (initial: 91.8mg/dL; final: 79.1mg/dL; p = 0.01) and in moderately malnourished children (initial: 109.2mg/dL; final 88.7mg/dL; p = 0.01), and a significant increase in high‐density lipoprotein cholesterol HDL‐C only in the third year of intervention (initial: 31.4mg/dL; final: 42.2mg/dL). The values of total cholesterol (TC) and low‐density lipoprotein cholesterol (LDL‐C) levels remained high throughout the treatment (initial: 165.1mg/dL; final: 163.5mg/dL and initial: 109.0mg/dL; final: 107.3mg/dL, respectively).
Conclusionthe nutritional treatment for children with short stature was effective in reducing stunting and improving TG and HDL‐C after three years of intervention. However, the levels of LDL‐C and TC remained high even in treated children. It is therefore speculated that these changes may result from metabolic programming due to malnutrition.
avaliar as mudanças no perfil bioquímico de crianças tratadas ou em tratamento para déficit estatural moderado ou grave em um centro de recuperação e educação nutricional.
Métodosestudo longitudinal retrospectivo com 263 crianças semi‐internas no Centro no período de agosto/2008 a agosto/2011, com idade entre 1 e 6 anos e diagnóstico de déficit estatural moderado, escore‐Z da altura‐para‐idade (AIZ) < ‐2 e grave (AIZ < ‐3). Foram coletados dados socioeconômicos, dietéticos e bioquímicos e a evolução estatural segundo a idade.
Resultadoscom a intervenção nutricional observou‐se incremento no escore‐z das crianças com déficit estatural moderado (0,51 ± 0,4; p = 0,001) e grave (0,91 ± 0,7; p = 0,001) durante o período de acompanhamento. Observou‐se, ainda, aumento nos níveis de fator de crescimento insulina‐símile (IGF‐1) (inicial: 71,7 ng/dL; final: 90,4 ng/dL; p = 0,01), redução nos triglicérides (TG) tanto nas crianças graves (inicial: 91,8mg/dL; final: 79,1mg/dL; p = 0,01) como nas moderadamente desnutridas (109,2mg/dL para 88,7mg/dL; p = 0,01) e aumento significativo do lipoproteína de alta densidade (HDL‐C) apenas no terceiro ano de intervenção (inicial: 31,4mg/dL; final: 42,2mg/dL). Os valores de colesterol total (CT) e lipoproteína de baixa densidade (LDL‐C) continuaram elevados durante todo o tratamento (inicial: 165,1mg/dL; final: 163,5mg/dL e inicial: 109,0mg/dL; final: 107,3mg/dL, respectivamente).
Conclusãoo tratamento nutricional para as crianças de baixa estatura mostrou‐se eficaz na redução do déficit estatural e dos TG e melhora dos níveis de HDL‐C após três anos de intervenção. Porém, os níveis de LDL‐C e CT mostraram‐se sempre elevados mesmo nas crianças tratadas. Questiona‐se, pois, se essas alterações seriam resultantes da programação metabólica a desnutrição.
Hyperlipidemia in childhood and adolescence has been considered a major factor for the occurrence of the atherosclerotic process in the long term.1 Studies have shown that atherogenesis may begin early in life, the presence of lesions, such as lipid and proteoglycans infiltrations in the intimal layer of the vessel, has been observed as early as in the first year of the child's life.2
Although dyslipidemia is frequently associated with obesity,3 recent studies have found that intrauterine and/or early life malnutrition may predispose the fetus to metabolic disorders, also leading to changes in the lipid profile in childhood.4,5
In this context, studies have demonstrated a negative association between low birth weight and lipid profile in adults.6–8 Individuals with short stature, a chronic manifestation of malnutrition experienced during the growth period, have higher levels of serum total cholesterol, low‐density lipoprotein (LDL) cholesterol, and triglycerides than adults with normal height.7,9
As a possible explanation for these findings, it is presumed that malnourished children tend to have high levels of plasma growth hormone (GH) and low levels of insulin‐like growth factor‐1 (IGF‐1), and that may be the major cause of reduced growth. 10
Thus, in order to maintain the functioning of vital organs, metabolic adaptations occur, such as increased serum levels of cortisol, which promotes protein catabolism and increased respiratory quotient. These factors lead to a lower lipid oxidation, and consequent accumulation of fat in the liver.11,12
Added to the fact that liver growth retardation in the last trimester of pregnancy can lead to permanent changes in lipid metabolism, either by the reduction of active hepatic receptors and/or their inactivity, or the overproduction of VLDL‐C (very low density lipoprotein‐C) and LDL‐C and/or defects in the expression of the enzyme lipoprotein lipase (LPL), a change in the number of hepatocytes in periportal and perivenous areas of children born with low birth weight may also occur.13,14
Although data on lipid profile changes in chronic malnutrition is scarce, a study involving children from the Northeastern region of Brazil with moderate to severe stunting, attended to at a center for nutritional recovery, demonstrated that the majority of these children (98.9%) had some change in lipid profile, and that low levels of HDL cholesterol were inversely related to malnutrition severity.15
The nutrition recovery and education center (centros de recuperação e educação nutricional ‐ CREN) programs, linked to universities, rely on integrated actions that stimulate successful local initiatives that, respecting the local culture, actively search for cases of malnutrition in the community and work with the heritage of each person, family, and community.16 In CREN, children receive continuing educational assistance, five balanced meals, daily care, and infection control.17
Considering this perspective, the present study aimed to evaluate the evolution of the biochemical profile of children treated or undergoing treatment for moderate or severe stunting in a CREN in Maceió, state of Alagoas, Northeast Brazil. It is also important to emphasize that no publications indicating lipid profile recovery in children with chronic malnutrition were retrieved in the main research databases. Such studies are important because they allow for the identification of the changes that occur in malnutrition, which that can be recovered through nutritional treatment. Moreover, they serve as guidelines for the planning of public policies that contribute to reduce the prevalence of child malnutrition and its long‐term consequences.
MethodsStudy populationThis was a retrospective longitudinal study that analyzed data on malnourished children undergoing treatment at CREN from August/2008 to August/2011. Of the 302 children who attended the center, 263 were selected, aged 1 to 6 years old, diagnosed with moderate (height‐for‐age z‐score [HAZ] < ‐2) or severe malnutrition (HAZ < ‐3), who had at least two serum lipid measurements in their records.
Information regarding the socio‐environmental conditions of families, such as the type of housing, number of rooms, flooring, garbage disposal, number of household members, and income were also collected from the medical records of children, as well as biochemical, dietary, and anthropometric data.
Anthropometric dataAnthropometric evaluation was performed monthly in the center by trained nutritionists. Children younger than 24 months were weighed on a scale with a maximum capacity of 15kg and precision of 5g (Manual balance,BP Baby, Filizola ‐ MS, Brazil); those older than 2 years were weighed on a scale with a maximum capacity of 150kg and 100g precision (Electronic scale,Personal, Filizola – MS, Brazil), all previously calibrated.
To measure the length of the children younger than 2 years, an infantometer was used, with a 105‐cm long inextensible measuring tape, with 0.1cm precision. The height of children older than 24 months was measured using a wall‐mounted vertical stadiometer (measuring range 0 to 200cm, 1mm precision, Wiso ‐ PR, Brazil).18 The nutritional status of children was assessed using the World Health Organization (WHO) Anthro software (version 3.0.1, 2007, Geneva, Switzerland), and classified according to the WHO recommendations.19
Biochemical dataRegarding the biochemical profile, blood samples were obtained via venipuncture at the institution after the children fasted for 12hours, and allocated in suitable vials for the separation of plasma or serum.
The tests were performed by an accredited clinical analysis laboratory. The concentrations of total cholesterol (TC), triglycerides (TG), and HDL‐C were determined by an enzymatic colorimetric method, and LDL‐C levels were measured using a standard procedure.20 Values recommended by the Brazilian Society of Cardiology were used for the evaluation and classification of the lipid profile in children and adolescents:21 (a) TC: desirable,< 150mg/dL; borderline, between 150 and 169mg/dL; and increased, ≥ 170mg/dL; (b) LDL‐C: desirable < 100mg/dL; borderline, between 100 and 129mg/dL; and increased; ≥ 130mg/dL; (c) HDL‐C: desirable,> 45mg/dL; and (d) TG: desirable < 100mg/dL; borderline, between 100 and 129mg/dL; and increased, ≥ 130mg/dL. IGF‐1 was determined using a chemiluminescence assay, after which children were classified according to the reference values indicated by the Diagnostic System Laboratory, adapted for age.22
The biochemical variable assessment included two measurements, one at admission and and the other at discharge. The interval between these two measurements varied from 1 to 3 years, depending on the time of the ongoing treatment or the period between admission and discharge. That is, measurements used for the analysis were those obtained at admission and the last measurement of the first year of intervention for children who stayed one (1) year; at admission and the last measurement of the second year for those that remained for two (2) years; and at admission and after three (3) years of follow‐up for children who stayed three years. For treated children, the doses at admission and those related to discharge were evaluated.
Dietetic dataThe children remained at the institution from Monday to Friday, from 8 AM to 5 PM, and received five meals a day. The diet offered at the institution comprised 100% of the daily nutritional requirements of macro and micronutrients according to the dietary reference intakes (DRIs)23 for the age group and adapted to the needs for nutritional recovery of malnourished children; approximately 90‐100kcal/kg of body weight, 3.0 to 3.5g protein/kg of body weight, 12.15g carbohydrates/kg of body weight, and 3‐4g lipids/kg of body weight.24
Statistical analysisThe results were evaluated according to the parametric assumptions of normality (Lilliefors test) and homogeneity of variances (Levene test). All variables analyzed in this study showed residuals with normal standardized distribution and homoscedasticity. Student's t‐test (for independent samples, Table 1) and paired t‐test (for related samples; Tables 2 and 3), were performed to verify the existence of a significant difference (p < 0.05). The probability of random experimental error was set at α = 5%.
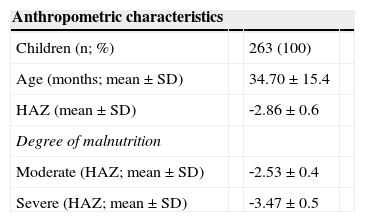
Anthropometric and socioeconomic characteristics at admission (2008) of children treated at the Centro de Recuperação e Educação Nutricional (CREN), Maceió, Alagoas, Brazil.
| Anthropometric characteristics | |||
|---|---|---|---|
| Children (n; %) | 263 (100) | ||
| Age (months; mean ± SD) | 34.70 ± 15.4 | ||
| HAZ (mean ± SD) | ‐2.86 ± 0.6 | ||
| Degree of malnutrition | |||
| Moderate (HAZ; mean ± SD) | ‐2.53 ± 0.4 | ||
| Severe (HAZ; mean ± SD) | ‐3.47 ± 0.5 |
| Socioeconomic characteristics | n | % | pa |
|---|---|---|---|
| Type of house | |||
| Brick house | 193 | 73.4 | |
| Others | 70 | 26.6 | 0.175 |
| Number of rooms | |||
| 1–3 | 162 | 61.6 | |
| 4–6 | 101 | 38.4 | 0.751 |
| Floor covering | |||
| Yes | 84 | 31.9 | |
| No | 179 | 68.1 | 0.195 |
| Family income | |||
| ≤ one minimum wage | 203 | 77.2 | |
| > one minimum wage | 60 | 22.8 | 0.503 |
| Schooling | |||
| ≤ four years of schooling | 202 | 77 | 0.216 |
| > four years of schooling | 61 | 23 |
SD, standard deviation; HAZ, height for age z‐score.
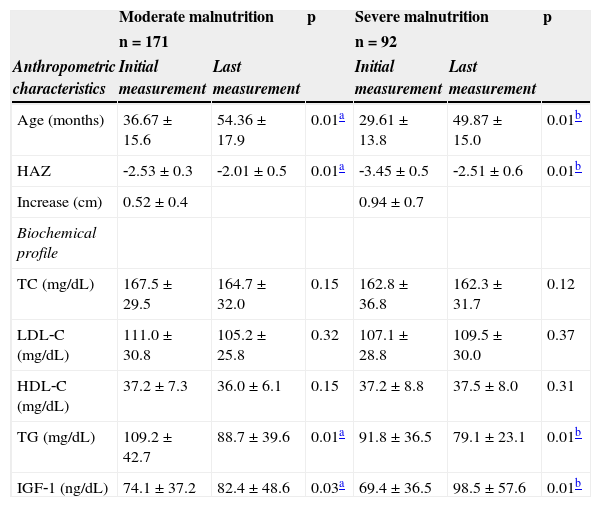
Mean and standard deviation of anthropometric and biochemical variables of malnourished children treated at the Centro de Recuperação e Educação Nutricional (CREN) between 2008 and 2011, Maceió, Alagoas, Brazil.
| Moderate malnutrition | p | Severe malnutrition | p | |||
|---|---|---|---|---|---|---|
| n = 171 | n = 92 | |||||
| Anthropometric characteristics | Initial measurement | Last measurement | Initial measurement | Last measurement | ||
| Age (months) | 36.67 ± 15.6 | 54.36 ± 17.9 | 0.01a | 29.61 ± 13.8 | 49.87 ± 15.0 | 0.01b |
| HAZ | ‐2.53 ± 0.3 | ‐2.01 ± 0.5 | 0.01a | ‐3.45 ± 0.5 | ‐2.51 ± 0.6 | 0.01b |
| Increase (cm) | 0.52 ± 0.4 | 0.94 ± 0.7 | ||||
| Biochemical profile | ||||||
| TC (mg/dL) | 167.5 ± 29.5 | 164.7 ± 32.0 | 0.15 | 162.8 ± 36.8 | 162.3 ± 31.7 | 0.12 |
| LDL‐C (mg/dL) | 111.0 ± 30.8 | 105.2 ± 25.8 | 0.32 | 107.1 ± 28.8 | 109.5 ± 30.0 | 0.37 |
| HDL‐C (mg/dL) | 37.2 ± 7.3 | 36.0 ± 6.1 | 0.15 | 37.2 ± 8.8 | 37.5 ± 8.0 | 0.31 |
| TG (mg/dL) | 109.2 ± 42.7 | 88.7 ± 39.6 | 0.01a | 91.8 ± 36.5 | 79.1 ± 23.1 | 0.01b |
| IGF‐1 (ng/dL) | 74.1 ± 37.2 | 82.4 ± 48.6 | 0.03a | 69.4 ± 36.5 | 98.5 ± 57.6 | 0.01b |
HAZ, height for age z‐score; TC, total cholesterol; LDL‐C, low‐density lipoprotein; HDL‐C, high‐density lipoprotein; TG,triglycerides; IGF‐1, insulin‐like growth factor 1.
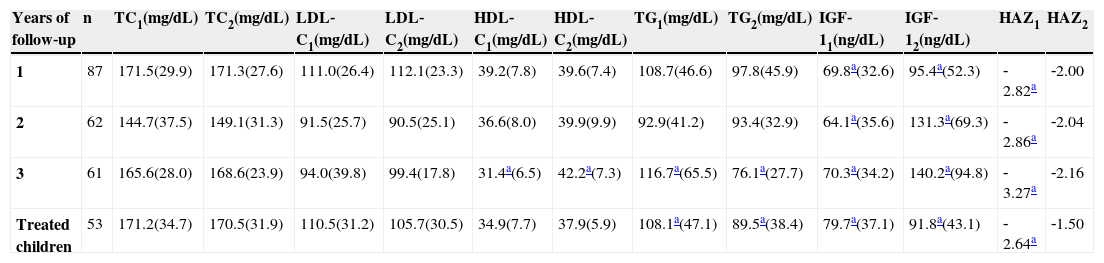
Biochemical profile and growth evolution (mean ± standard deviation) of children undergoing treatment at Centro de Recuperação e Educação Nutricional (CREN) between 2008 and 2011, Maceió, Alagoas, Brazil.
| Years of follow‐up | n | TC1(mg/dL) | TC2(mg/dL) | LDL‐C1(mg/dL) | LDL‐C2(mg/dL) | HDL‐C1(mg/dL) | HDL‐C2(mg/dL) | TG1(mg/dL) | TG2(mg/dL) | IGF‐11(ng/dL) | IGF‐12(ng/dL) | HAZ1 | HAZ2 |
|---|---|---|---|---|---|---|---|---|---|---|---|---|---|
| 1 | 87 | 171.5(29.9) | 171.3(27.6) | 111.0(26.4) | 112.1(23.3) | 39.2(7.8) | 39.6(7.4) | 108.7(46.6) | 97.8(45.9) | 69.8a(32.6) | 95.4a(52.3) | ‐2.82a | ‐2.00 |
| 2 | 62 | 144.7(37.5) | 149.1(31.3) | 91.5(25.7) | 90.5(25.1) | 36.6(8.0) | 39.9(9.9) | 92.9(41.2) | 93.4(32.9) | 64.1a(35.6) | 131.3a(69.3) | ‐2.86a | ‐2.04 |
| 3 | 61 | 165.6(28.0) | 168.6(23.9) | 94.0(39.8) | 99.4(17.8) | 31.4a(6.5) | 42.2a(7.3) | 116.7a(65.5) | 76.1a(27.7) | 70.3a(34.2) | 140.2a(94.8) | ‐3.27a | ‐2.16 |
| Treated children | 53 | 171.2(34.7) | 170.5(31.9) | 110.5(31.2) | 105.7(30.5) | 34.9(7.7) | 37.9(5.9) | 108.1a(47.1) | 89.5a(38.4) | 79.7a(37.1) | 91.8a(43.1) | ‐2.64a | ‐1.50 |
TC, total cholesterol; LDL‐C, low‐density lipoprotein; HDL‐C, high‐density lipoprotein; TG, triglycerides; IGF‐1, insulin‐like growth factor 1; HAZ, height for age Z‐score.
This study was approved by the Research Ethics Committee of Universidade Federal de Alagoas (Process No. 009580/2007‐26), in accordance with the ethical principles contained in the Declaration of Helsinki. An informed consent was signed by parents and/or guardians of participating children before the start of the study.
ResultsAs shown in Table 1, the sample consisted of 263 children, of whom 52.5% were males and 47.1% were females. The majority (65.1%) were diagnosed with moderate malnutrition and 34.9% were classified as having severe malnutrition. Of the 263 children evaluated, 87 were followed‐up for one year; 62, for two years; 61, for three years; and 53 were treated.
Regarding socioeconomic status, it was observed that families were large, and 77% earned less than one Brazilian minimum wage. The houses were mostly brick constructions with up to three rooms, without flooring; water was obtained from a well.
Table 2 presents the distribution of anthropometric and biochemical values during treatment. It was observed that children with moderate malnutrition were followed‐up for a period of 1 year and 6 months, and severely malnourished children were followed on average for 1 year and 8 months.
With treatment, children presented a significant increase in IGF‐1 levels, which characterized a gain in height in both groups; this gain was higher among children with severe deficits (mean increase of 0.91 ± 0.65, p < 0.01), compared to those with moderate impairment (0.51 ± 0.43).
Table 2 also evidences that there was a decrease in serum TG, regardless of malnutrition severity. In relation to HDL‐C, it was observed that the majority of children had lower concentrations of this lipid at the beginning and end of treatment. However, both moderately and severely malnourished children presented no changes in TC levels during treatment; these values remained above the desired serum levels (150mg/dL and 100mg/dL, respectively).
Table 3 presents the studied parameters according to the intervention duration. It is observed that the highest increase in HAZ occurred after the third year of treatment. Serum IGF‐1 levels were over two‐fold higher than baseline levels after two years of follow‐up. The reduction in TG occurred since the first year of treatment; however, it was only significant after three years of intervention, while the increase in serum HDL‐C levels was observed only after the third year of follow‐up.
Table 3 also shows the data of treated children, i.e., those with HAZ value ≥ ‐1.5. In these children, a HAZ increase that was higher than the mean values in children undergoing treatment was observed (1.14 vs. 0.92, respectively). A reduction in TG and an increase in HDL‐C levels were also observed, but it was observed that, even in treated children, the TC and LDL‐C values remained altered.
DiscussionStature deficits observed in chronic malnutrition are accompanied by the reduction in serum IGF‐1, as shown earlier in this study, especially among children with more severe deficits. These findings reinforce the hypothesis that the abovementioned hormone is the main factor for reduced growth in affected children. Reduced levels of IGF‐1 may be the result of reduced hepatic GH binding sites and IGF‐1 gene expression, which would be responsible for the increased plasma GH and decreased serum IGF‐1, since somatomedins act at the level of the central nervous system, reducing the synthesis of GH.10
Thus, as in the present study, researchers have observed that an appropriate nutritional treatment can reverse the IGF‐1 deficits found in chronic malnutrition and recover stature in childhood, suggesting that IGF‐1 is a strong indicator of nutritional status.15,24
In addition to the endocrine changes, the high prevalence of dyslipidemia in children in the present study demonstrated that malnutrition in early life leads to changes in lipid metabolism, making the lipemic profile more atherogenic, as shown by other authors.7,13,25,26 In this sense, the prevalence of dyslipidemia characterized by low levels of HDL‐C and high TG levels can be attributed to the rapid catabolism of HDL‐C, but not to the decreased production of its particles.27
In turn, the hypertriglyceridemia observed among children with moderate stunting at the beginning of this study can be understood by the fact that malnourished children have decreased body mass, which leads to a reduction in the amount of LPL, favoring a lower clearance of circulating TG.28 With treatment, there was a decrease in serum TG levels regardless of the degree of malnutrition observed in the children, probably indicating a normalization of LPL expression. Studies involving the infusion of artificial emulsions have observed that patients deficient in this enzyme had elevated TG in blood, suggesting saturation of LPL activity.29,30
However, stunting appears to have permanent effects on cholesterol metabolism, resulting in a decrease in the number and activity of active hepatic receptors, which regulate cholesterol synthesis.4,5,13 This was demonstrated in the present study, since the serum TC and LDL‐C levels in the assessed children remained high and above desirable levels (150mg/dL and 100mg/dL, respectively) throughout treatment, including in those who recovered their nutritional status (HAZ ≤ ‐1.5).21 In this sense, studies involving adolescents with short stature have demonstrated that the decrease in resting metabolic rate compensated by increased respiratory quotient and consequent decrease in lipid oxidation favors the accumulation of visceral fat,30 explaining in part the atherogenic lipemic profile observed in malnourished children.
It is also assumed that there may be a decrease in the circulating levels of free T3 in malnourished children due to the decrease in carrier proteins (albumin and prealbumin), in addition to the decrease in peripheral activity of the enzyme that converts T4 into T3 (5‐deiodinase). During growth, this situation favors gluconeogenesis and release of fatty acids from adipose tissue and inhibits the actions of GH dependent on somatomedin‐C (IGF‐1), whose changes could at least partly explain the elevated TC and LDL‐C levels observed in the children in this study.12,27
Conversely, recent studies with children undergoing systematized treatment at referral centers in malnutrition in the country demonstrated that, in addition to weight and height recovery, body composition, insulin, and glucose metabolism normalized two to three years after discharge.16,17
In this study, it also became evident that the treatment offered to malnourished children at CREN was effective in increasing HAZ in children undergoing treatment, and in the recovery of height deficits in children who were discharged. However, it is assumed that the functional changes that occurred in early life caused alterations in the metabolism of total cholesterol and LDL‐C, so that even during and after treatment the serum levels of these lipid fractions continued above desirable levels. This suggests that the nutritional treatment of malnutrition may decrease the risk of developing chronic diseases in adulthood, but not completely reverse them.
Nevertheless, it is worth noting that the study design had limitations, such as lack of systematic information on biochemical measurements and the fact that the children were at different treatment stages.
From this perspective, further studies are necessary to better explain the changes in lipid levels, even after treatment of malnutrition. Do these changes result from the metabolic programming that occurred early in life?
FundingConselho Nacional de Desenvolvimento Científico e Tecnológico – CNPq (processo n° 402673/2007‐7). JFR Alves received a master's degree grant from the Coordenação de Aperfeiçoamento de Pessoal de Nível Superior (CAPES/CNPq).
Conflicts of interestThe authors declare no conflicts of interest.
The authors wish to thank the directors of CREN/AL for granting permission to perform the study; as well as the nutritionists Gabriela Stux Veiga, Renata Antunes, and Myria Viana for their support in data collection; the Coordination of Improvement of Higher Education Personnel (CAPES), the National Council for Scientific and Technological Development (CNPq) for granting financial aid for study and research (Process No. 402673/2007‐7); and Professor Cyro Cabral Junior Rego for the statistical analyses performed during the master's degree course.
The authors would also like to take full responsibility for the reliability of information provided, on behalf of all co‐authors and institutions involved in the study.
Article based on Jullyana FR Alves’ master's degree dissertation, presented to the School of Nutrition, Universidade Federal de Alagoas in 2012.
Please cite this article as: Alves JF, Britto RP, Ferreira HS, Sawaya AL, Florêncio TM. Evolution of the biochemical profile of children treated or undergoing treatment for moderate or severe stunting: consequences of metabolic programming? J Pediatr (Rio J). 2014;90:356–62.
articles


