
The management of children with low birth weight is not the same in countries with different resources. The authors assessed the association of birth weight with blood pressure and nutritional status in a representative sample of adolescents from a Brazilian state, aiming to identify possible consequences of these differences.
MethodsA cross-sectional school-based study was conducted with adolescents (12–18 years) enrolled in public and private schools. Birth weight, office blood pressure, home blood pressure measurements, and nutritional status (body mass index, height z-score for the age, and waist circumference) were assessed. The association of birth weight with the outcomes (blood pressure, height, body mass index, and waist circumference) was studied through univariate and multivariable linear regression models.
ResultsA total of 829 adolescents with a mean age of 14.6±1.62 years were included; 43.3% were male, and 37.0% from private schools. The prevalence of low birth weight was 8.7%. Mild low height prevalence was higher among those adolescents with low/insufficient birth weight when compared to those with normal/high birth weight (11.7 vs. 4.2%; p<0.001). In the multiple linear regression analysis, for each increase of 100g in birth weight, height increased by 0.28cm (95% CI: 0.18–0.37; p<0.01). Birth weight did not influence office blood pressure and home blood pressure, body mass index, or waist circumference of adolescents.
ConclusionsBirth weight was directly associated to height, but not associated to blood pressure, body mass index, and waist circumference in adolescents from an urban area of a developing country.
O manejo de crianças com baixo peso ao nascer não é o mesmo em países com diferentes recursos. Investigamos a associação do peso ao nascer com a pressão arterial e o estado nutricional em uma amostra representativa de adolescentes de uma capital brasileira com o objetivo de identificar possíveis consequências destas diferenças.
MétodosEstudo transversal de base escolar conduzido com adolescentes (12-18 anos) matriculados em escolas públicas e privadas. Investigou-se o peso ao nascer, a pressão arterial, e o estado nutricional, por meio do índice de massa corporal, do escore z de estatura para idade e da circunferência da cintura.
ResultadosUm total de 829 adolescentes com uma idade média 14.6±1.62 anos foram incluídos, 43.3% do sexo feminino e 37.0% de escolas privadas. A prevalência de baixo peso ao nascer foi 8.7%. Baixa estatura leve foi mais prevalente nos adolescentes com peso ao nascer baixo/insuficiente (11.7×4.2% - p<0.001). Na análise de regressão linear múltipla, para cada aumento de 100g no peso ao nascer, a estatura aumentou em 0.28cm (IC 95%=0.18-0.37; p<0.01). O peso ao nascer não influenciou a pressão arterial (casual e residencial), o índice de massa corporal e a circunferência da cintura dos adolescentes.
ConclusõesO peso ao nascer esteve diretamente associado à altura, mas não associado à pressão arterial, índice de massa corporal e circunferência da cintura em adolescentes de uma área urbana de um país em desenvolvimento.
The hypothesis of fetal origin of diseases or “programming” was first proposed by Barker, in 1990.1 The main concept of this hypothesis is that the stress caused by fetal malnutrition, whose main biomarker is low birth weight (LBW), would inalterably modify the physiology or metabolism of an organ, increasing disease susceptibility in adult life.
Undoubtedly, uterine life is a critical period of development, due to rapid growth, cellular differentiation, and functional maturation of the organs. These rather sensitive processes would be particularly susceptible to alterations in the nutrient medium.1
Birth weight is an important health indicator that reflects the social and economic conditions of women during pregnancy. Together with prematurity, birth weight is the main factor associated with neonatal death in Brazil. Babies with LBW present greater morbidity and mortality in the first year of life.2
LBW children (BW <2500g) can be born at term or before term, and have varying degrees of social and medical risk. Because this is not a homogeneous group, patients have a broad spectrum of growth, health, and developmental outcomes. While the vast majority of LBW children present normal outcomes, as a group they generally have higher rates of subnormal growth, illnesses, and neurodevelopmental problems.3
Recent studies showed that individuals with LBW due to inadequate intrauterine development are prone to developing hypertension, obesity, and low height, among other conditions, in late stages of life.4–6
Even though the association of LBW with a number of conditions has been demonstrated in different contexts,7–9 the mechanisms behind these associations are still not completely understood and need to be more investigated.10 Furthermore, few publications in middle-income countries focused on this matter. Considering that the management of LBW children is not the same in countries with different resources, research conducted in these countries can help to identify the outcomes related to LBW in adolescence and adult life.
Due to the scarcity of studies on fetal programming of diseases in middle-income countries such as Brazil, particularly considering the youth population, this article aimed to assess the association of birth weight with blood pressure (BP) and nutritional status in a representative sample of adolescents from a Brazilian state capital.
MethodsA cross-sectional school-based study was conducted with a representative sample of adolescents enrolled in public and private schools of Goiania, a state capital in the Midwest region of Brazil. The study population was composed by adolescents, aged between 12 and 18 years. Schools were selected by probabilistic conglomerate sampling; students were randomly selected and stratified by age and gender. Exclusion criteria were chronic disease, use of medication that could influence on BP, physical disability that would not allow anthropometric evaluation, pregnancy, and absence of information on birth weight.
The study was approved by the institution's ethics committee (protocol no. 017/2010). The eligible adolescents who agreed to participate in the study signed an informed consent form and so did their parents/guardians.
A total of 1.221 adolescents who met the inclusion criteria were invited to participate in the study. Forty-eight refused (3.8%), four (0.5%) did not have the anthropometric measurements performed, and 340 (41.0%) did not provide information about birth weight; they were excluded, resulting in 829 adolescents (67.9% of the original group) in the final sample.
The sample size allowed to estimate the association of birth weight with anthropometric variables and BP in adolescents, detecting a difference of 15% for boys and girls separately, with a two-tailed α of 0.05 and a test power of 80%.
The instrument for data collection was a standardized questionnaire, previously tested in a pilot study,11 with questions regarding the individual's identification, including gender, age, skin color (white or non-white), and family history of hypertension and obesity, as well as socioeconomic classification of the adolescent.
Anthropometric measuresNutritional status was evaluated through weight, height and waist circumference (WC), using standardized procedures.12 Weight was measured on a Kratos® electronic scale (Kratos®,SP, Brazil), with capacity of 150kg and variation of 50g and height was assessed with Secca® stadiometer (Secca®, SP, Brazil), graded to an accuracy of 0.1cm. Adolescents were classified based on the height z-score for the age: mild low height (−1<z-score≤−2) and normal height (z-score≥−1).13 Body mass index (BMI) was calculated and classified according to the specific standard reference for age and gender proposed by the World Health Organization (WHO).14 WC measurements were performed with a Sanny® (Sanny®, SP, Brazil) 200cm inextensible tape with 0.1cm variation, and the cut off points were those proposed by Taylor et al.15; students were categorized as normal and increased WC.
Birth weightIn the study presentation letter, parents or guardians were required to answer whether the birth was premature or not and to write the birth weight, according to data from the children's birth card. Birth weight was classified as low (BW<2500g), insufficient (2500g≤BW<3000g), normal (3000g≤BW<4000g), or high (BW≥4000g).12 Preterm birth was used to adjust birth weight in the regression model.
Office blood pressure (OBP) measurementMeasurements were performed in school, with the OMRON® HEM-705CP semiautomatic device (HEM-705CP OMRON®, CA, USA), and cuffs in three different sizes were used, according to the right arm circumference. The equipment was previously validated for adolescents.16 Two BP measurements following the proper techniques17 were performed in two different encounters within one-week interval. For the analysis, the mean values of the second measurements at each time point were considered. High OBP was defined as values ≥95th percentile for sex, age, and height.17
Home blood pressure (HBP) measurementThe same equipment and cuffs sizes for OBP were used. The device was given to the adolescents, who were also properly trained on how to use it. Two right arm measurements should be performed, in sitting position, after 5min of rest, in the morning (between 6 and 10am) and in the evening (between 6 and 10pm), for six consecutive days (total of 24 readings).18
Home measurements saved in the memory of the equipment were printed and compared with those reported in the HBP form filled by the adolescent. When there was a discrepancy between measures (more measures from the equipment memory than from the HBP form) or when the adolescent reported not being the only person to have used the equipment, the exam was excluded from the analysis. Exams were considered valid when at least 12 measurements (50%) were performed according to standardized protocols.18 HBP was classified as high when the mean systolic and/or diastolic pressure of the six days was ≥95th percentile for age, gender, and height.19
Statistical analysisData were tabulated in double entry with the Epi-Info (Epi-Info, version 6.04, Division of Health Informatics & Surveillance, Centers of Disease Control and Prevention). Variable categorization and statistical analysis were performed with the STATA software (SPSS for Windows, version 13, Chicago, USA). Kolmogorov–Smirnov's test was used to assess whether continuous variables had normal distribution. Pearson's chi-squared test was used to compare BP and nutritional status categories between low/insufficient and normal/high birth weight adolescents. The birth weight relation with the outcomes (BP, height, BMI, and WC) was studied through univariate and multivariable linear regression analysis. Variables that presented p-value <0.20 in the univariate analysis and absence of collinearity between independent variables (Pearson's correlation coefficient <0.80) were included in the multivariable model. The variables included in the model for adjustment were selected based on scientific plausibility.20 A significance level of 5% was considered.
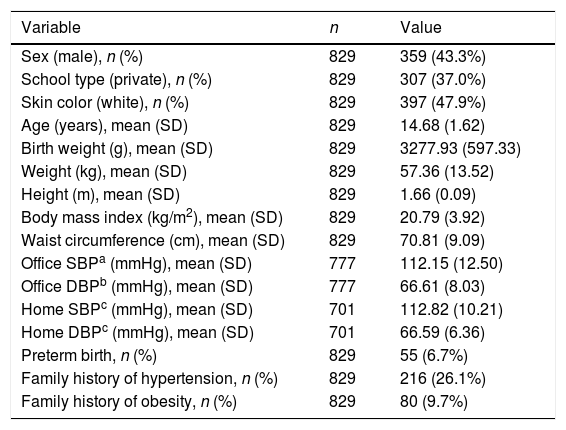
ResultsA total of 829 adolescents with a mean age of 14.68 (±1.62) years were included in the analysis, 43.3% were male and 37.0% from private schools. OBP measurements were not performed in 53 (6.4%) subjects and 128 (15.4%) did not perform a valid HBP measurement. The mean birth weight was 3277.93g (±597.33) and 47.9% referred to themselves as being white. The overall characteristics of the group are shown in Table 1.
Overall characteristics of a representative sample of adolescents from a Brazilian state capital. Goiânia, Brazil.
| Variable | n | Value |
|---|---|---|
| Sex (male), n (%) | 829 | 359 (43.3%) |
| School type (private), n (%) | 829 | 307 (37.0%) |
| Skin color (white), n (%) | 829 | 397 (47.9%) |
| Age (years), mean (SD) | 829 | 14.68 (1.62) |
| Birth weight (g), mean (SD) | 829 | 3277.93 (597.33) |
| Weight (kg), mean (SD) | 829 | 57.36 (13.52) |
| Height (m), mean (SD) | 829 | 1.66 (0.09) |
| Body mass index (kg/m2), mean (SD) | 829 | 20.79 (3.92) |
| Waist circumference (cm), mean (SD) | 829 | 70.81 (9.09) |
| Office SBPa (mmHg), mean (SD) | 777 | 112.15 (12.50) |
| Office DBPb (mmHg), mean (SD) | 777 | 66.61 (8.03) |
| Home SBPc (mmHg), mean (SD) | 701 | 112.82 (10.21) |
| Home DBPc (mmHg), mean (SD) | 701 | 66.59 (6.36) |
| Preterm birth, n (%) | 829 | 55 (6.7%) |
| Family history of hypertension, n (%) | 829 | 216 (26.1%) |
| Family history of obesity, n (%) | 829 | 80 (9.7%) |
The prevalence of LBW was 8.7%. The distribution among the birth weight categories was homogenous between males and females, and the only difference was found in the high birth weight category, in which the proportion of males was higher than females, as shown in Fig. 1.

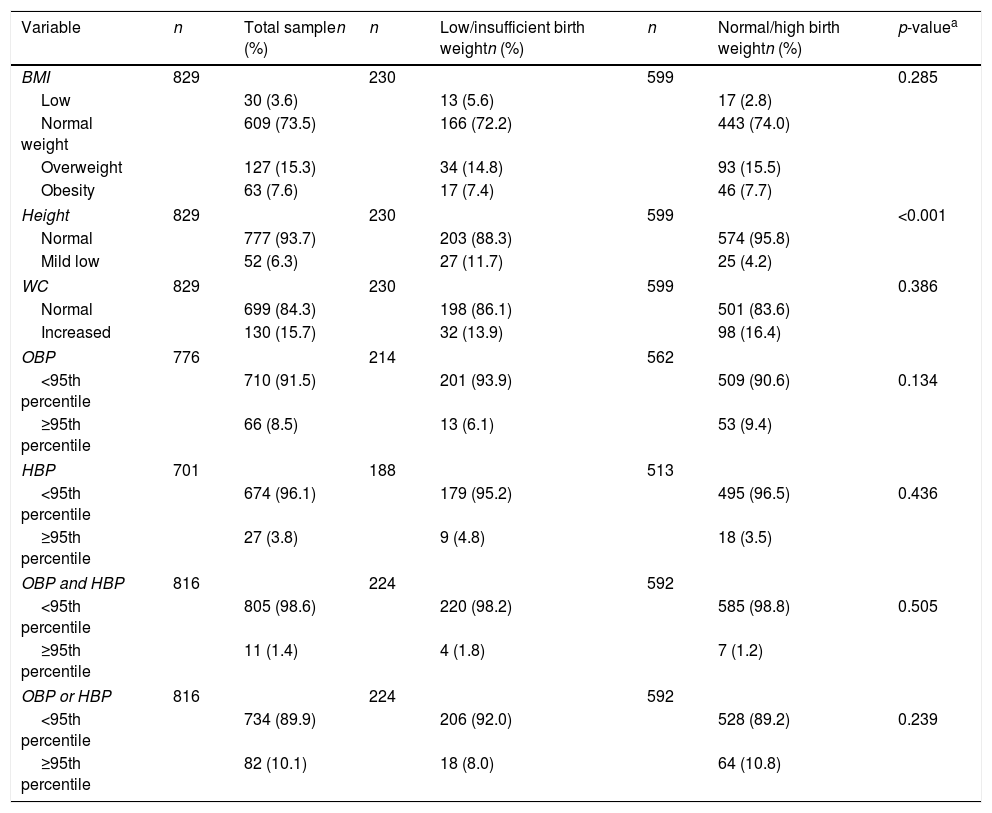
Table 2 presents the nutritional status, characterized by BMI, height, and WC distribution, and stratified by low/insufficient and normal/high birth weight. The overall overweight/obesity prevalence was 22.9%. The prevalence of mild low height was higher among those adolescents with low/insufficient birth weight when compared to those with normal/high birth weight (11.7 vs. 4.2%; p<0.001). The prevalence of adolescents with abdominal obesity was 15.7%.
Distribution of nutritional status and blood pressure levels by birth weight categories in adolescents. Goiânia, Brazil.
| Variable | n | Total samplen (%) | n | Low/insufficient birth weightn (%) | n | Normal/high birth weightn (%) | p-valuea |
|---|---|---|---|---|---|---|---|
| BMI | 829 | 230 | 599 | 0.285 | |||
| Low | 30 (3.6) | 13 (5.6) | 17 (2.8) | ||||
| Normal weight | 609 (73.5) | 166 (72.2) | 443 (74.0) | ||||
| Overweight | 127 (15.3) | 34 (14.8) | 93 (15.5) | ||||
| Obesity | 63 (7.6) | 17 (7.4) | 46 (7.7) | ||||
| Height | 829 | 230 | 599 | <0.001 | |||
| Normal | 777 (93.7) | 203 (88.3) | 574 (95.8) | ||||
| Mild low | 52 (6.3) | 27 (11.7) | 25 (4.2) | ||||
| WC | 829 | 230 | 599 | 0.386 | |||
| Normal | 699 (84.3) | 198 (86.1) | 501 (83.6) | ||||
| Increased | 130 (15.7) | 32 (13.9) | 98 (16.4) | ||||
| OBP | 776 | 214 | 562 | ||||
| <95th percentile | 710 (91.5) | 201 (93.9) | 509 (90.6) | 0.134 | |||
| ≥95th percentile | 66 (8.5) | 13 (6.1) | 53 (9.4) | ||||
| HBP | 701 | 188 | 513 | ||||
| <95th percentile | 674 (96.1) | 179 (95.2) | 495 (96.5) | 0.436 | |||
| ≥95th percentile | 27 (3.8) | 9 (4.8) | 18 (3.5) | ||||
| OBP and HBP | 816 | 224 | 592 | ||||
| <95th percentile | 805 (98.6) | 220 (98.2) | 585 (98.8) | 0.505 | |||
| ≥95th percentile | 11 (1.4) | 4 (1.8) | 7 (1.2) | ||||
| OBP or HBP | 816 | 224 | 592 | ||||
| <95th percentile | 734 (89.9) | 206 (92.0) | 528 (89.2) | 0.239 | |||
| ≥95th percentile | 82 (10.1) | 18 (8.0) | 64 (10.8) | ||||
BMI, body mass index; WC, waist circumference; OBP, office blood pressure; HBP, home blood pressure.
The prevalence of high BP, defined by OBP, was 8.5%; in turn, when this prevalence was defined by HBP, the rate was 3.8%. Table 2 shows the prevalence of hypertension stratified by the measurement technique and the comparison between birth weight categories. No difference in hypertension prevalence was found among the birth weight categories.
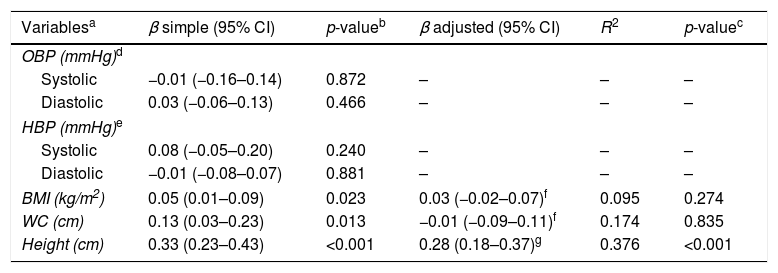
In the studied sample, birth weight did not influence OBP and HBP. A positive influence was detected initially on BMI and WC; however, it was not sustained after adjusted analysis (p=0.274 and 0.835, respectively). In turn, for each 100g increase in birth weight, height increased by 0.33cm (95% CI: 0.23–0.43; p<0.01) and, after multivariable analysis, the increase went to 0.28cm (95% CI: 0.18–0.37; p<0.01). The birth weight results were adjusted to prematurity. The independent variables used in the model explained 37.6% of height variation (Table 3).
Association of birth weight with blood pressure and nutritional status in adolescents. Goiânia, Brazil, 2010–2011 (n=829).
| Variablesa | β simple (95% CI) | p-valueb | β adjusted (95% CI) | R2 | p-valuec |
|---|---|---|---|---|---|
| OBP (mmHg)d | |||||
| Systolic | −0.01 (−0.16–0.14) | 0.872 | – | – | – |
| Diastolic | 0.03 (−0.06–0.13) | 0.466 | – | – | – |
| HBP (mmHg)e | |||||
| Systolic | 0.08 (−0.05–0.20) | 0.240 | – | – | – |
| Diastolic | −0.01 (−0.08–0.07) | 0.881 | – | – | – |
| BMI (kg/m2) | 0.05 (0.01–0.09) | 0.023 | 0.03 (−0.02–0.07)f | 0.095 | 0.274 |
| WC (cm) | 0.13 (0.03–0.23) | 0.013 | −0.01 (−0.09–0.11)f | 0.174 | 0.835 |
| Height (cm) | 0.33 (0.23–0.43) | <0.001 | 0.28 (0.18–0.37)g | 0.376 | <0.001 |
CI, confidence interval; β, not standardized regression coefficient; R2, determination coefficient; OBP, office blood pressure; HBP, blood pressure measurement; BMI, body mass index; WC, waist circumference.
This study assessed a representative sample of more than 800 secondary students from a Brazilian capital in the Midwest region of the country focusing on LBW and its association with BP and nutritional status. Birth weight was a predictor of height, but not of BMI and BP in adolescents from an urban area of Brazil.
The sample's LBW rate (8.7%) was higher than the 6.1% from another Brazilian sample21 and the 6.9% found in a previously published study in Goiânia.22 This finding has a negative impact on newborn's health and survival. However, higher LBW prevalence can be observed in more developed regions of Brazil; this phenomenon can be explained by the improvement in health assistance for pregnant women and infants, allowing babies with low weight to survive.23
High birth weight prevalence (9.0%) was also superior to the 6.5% previously reported for newborns in Goiânia.24 Since fetal macrosomia is related to a higher risk of death and prematurity, as well as complications such as obstetrical trauma, dystocia, and neonatal hypoglycemia,25 further investigations are needed to clarify if this finding is a tendency and the possible factors behind this growth.
A notable aspect of this study was that children with LBW became shorter in adolescence. This result is in accordance with a 5.9cm reduction in height, at the end of adolescence, observed in LBW children in the county of Hordaland (Norway)4 as well as with a higher occurrence of low height (10.3%) in a group of adults who were born small for gestational age (SGA) when compared with the control group.26
Most SGA children recover their height in the two initial years of life; however, it is estimated that between 10% and 15% will maintain a height deficit (−2 z-scores) throughout life. For those children, therapy with recombinant human growth hormone was recently approved in the United States and in Europe.20
Nonetheless, it is not clear whether the relation of birth weight with height results from genetic mechanisms, uterine influence, lifestyle, social condition, or a combination of these factors. A low height programming mechanism is probably related to changes on thyroid hormone synthesis, through phenylalanine and tyrosine reduction. It would cause oxygen consumption reduction and growth retardation.7 Another explanation would be a predisposition to early sexual and bone maturation, which would result in a linear growth deficit.1 Despite not being the focus of this study, the finding of loci (HMGA2 and LCORL) that genetically link intrauterine growth with postnatal height is noteworthy.27
The most recent WHO28 recommendation has modified the previous classification of mild low height to normal, probably due to the world decline in height deficit prevalence among young individuals in the population. However, the height increase tendency throughout generations demands reassessing the reference curves and revising the very definition of low height, in order not to underestimate nutritional disorders in the population, mainly in LBW newborns.26
Birth weight was directly associated to BMI and WC increase in adolescents; however, this relation was not sustained after an adjusted analysis. The variations of these anthropometric variables may be totally or partially explained by postnatal period factors, more than by fetal biology.8 These results corroborated studies4,29,30 that found no significant association of birth weight with low weight or obesity during and at the end of adolescence.
Controversies about this relation remain. A Chilean study concluded that approximately one-third of obesity cases in high school students could have been averted with early interventions in newborns with macrosomia.6 A Brazilian cohort study with newborns from the most economically developed region of the country observed a 1.2kg/m2 (95% CI: 0.0–2.4) increase in BMI at the age of 18 years in subjects with birth weight ≥4kg.31
Overweight was observed in more than one fifth of this population, exceeding by six times the frequency of underweight. These results confirm the nutritional transition observed in middle-income countries, characterized by progressive reduction of undernutrition and continuous increase in obesity prevalence. Among Brazilians aged 10–19, the prevalence of underweight was reported in 3.4% while that of overweight/obesity was 20.5%.32
No association was observed between birth weight and OBP/HBP in adolescence, contradicting authors, who propose that LBW due to inadequate uterine development would be associated with higher risk of developing hypertension in youth.5,8
Nevertheless, the investigation on the impact of birth weight on BP is controversial. Another Brazilian study, which used ambulatory blood pressure (ABP) monitoring, revealed higher SBP at nighttime and lower dipper patterns of SBP in students with LBW; however, it did not find correlation with daytime SBP.9
A limitation of the present study was the lack of information about gestational age. Without that, it was not possible to establish whether the SGA condition was due to intrauterine growth restriction (IUGR). However, the term SGA presents limitations from an epidemiological perspective since it disregards factors such as biological variability, gender, multiplicity, ethnicity, and parity, inferring that all small babies result from a pathological IUGR. In this sense, there is no golden standard method to determine IUGR with accuracy, which hampers the accomplishment of studies on fetal programming. Moreover, birth weight is the only perinatal health indicator widely collected in Brazil, due to its practicality and strong association with infant mortality.33
Other limitations refer to the socioeconomic condition, which does not necessarily correspond to the context in which the child was born; the collection of birth variables, which was performed exclusively by parents or guardians of the adolescents; and the absence of data on sexual maturation, parents’ height and smoking during gestation. Considering that 67.9% of the enrolled adolescents were included in this cross-sectional analysis, it is also important to consider the potential selection bias as a limitation.
Another factor which may have influenced the present results was the use of oscillometric method to measure BP rather than auscultatory, as well as the use of only two BP measurements. This methodology was chosen since the available recommendations for BP measurements in adolescents are based on experts’ opinions, rather than on well-conducted experimental studies.34
Birth weight is a complex variable that is influenced by many factors of fetal and maternal genotype. Contemporary life course perspectives also acknowledge the complex interactions of biological factors with the environment. These are the challenges in furthering understanding the fetal origin of diseases given the complexity of environmental factors.33
In conclusion, LBW was a predictor of growth deficit in adolescence. There was no association between birth weight and OBP, HBP, WC, and BMI in this age group. The high prevalence of newborns with low and high birth weight in the studied population demonstrates the need for a better prenatal assistance and nutritional attention to the pregnant woman, in order to promote maternal health, prevent neonatal mortality, and ensure normal growth/development of the child.
FundingThis study was supported by Conselho Nacional de Desenvolvimento Científico e Tecnológico (CNPq) and Fundação de Amparo à Pesquisa do Estado de Goiás (FAPEG).
Conflicts of interestThe authors declare no conflicts of interest.
The authors would like to thank the adolescents, relatives, and guardians who participated in the study, as well as to thank the support offered by the Hypertension League from the Federal University of Goiás.
Please cite this article as: Ferreira VR, Jardim TV, Póvoa TR, Mendonça KL, Nascente FN, Carneiro CS, et al. Birth weight and its association with blood pressure and nutritional status in adolescents. J Pediatr (Rio J). 2018;94:184–191.
Study conducted at Universidade Federal de Goiás (UFG), Liga de Hipertensão Arterial, Goiânia, GO, Brazil.


