This study was conducted to explore the association of eating frequency (EF) with anthropometric indices and blood pressure (BP) in children and adolescents.
MethodsThis nationwide cross-sectional study was performed on a multi-stage sample of 14,880 students, aged 6–18 years, living in 30 provinces in Iran. Parents were asked to report dietary intake of children as frequency of food groups and/or items. EF was defined as the sum of the daily consumption frequency of main meals and snacks. Association of EF with weight disorders, abdominal obesity, and elevated BP was assessed using different logistic regression models adjusted for potential confounding factors.
ResultsEating more frequently (≥6 vs. ≤3) was found among students who were at younger age (11.91 vs. 13.29 years) (p<0.001). Students who reported an EF of 4 (OR: 0.67, CI: 0.57–0.79), 5 (OR: 0.74, CI: 0.62–0.87), and 6 (OR: 0.54, CI: 0.44–0.65) had lower odds of being obese compared to those who had EF≤3. Having EF of 4 (OR: 0.82, CI: 0.71–0.94), 5 (OR: 0.86, CI: 0.74–0.99), and ≥6 (OR: 0.73, CI: 0.63–0.85) was related to lower prevalence of abdominal adiposity.
ConclusionHigher EF was associated with lower mean values of anthropometric and BP measures, as well as with lower prevalence of generalized and abdominal obesity in children and adolescents. Longitudinal studies are needed to assess the long-term effects of EF on body composition in the pediatric age group.
Este estudo foi realizado para explorar a associação da frequência de alimentação (FA) com índices antropométricos e pressão arterial (PA) em crianças e adolescentes.
MétodosEste estudo transversal nacional foi realizado em uma amostra de várias etapas de 14880 estudantes com idade entre 6 e 18 anos de 30 províncias do Irã. Foi pedido que os pais relatassem o consumo alimentar das crianças como a frequência de grupos e/ou itens alimentares. A FA foi definida como a soma da frequência de consumo diária das principais refeições e lanches. A associação entre FA e disfunções do peso, obesidade abdominal e PA elevada foi avaliada utilizando diferentes modelos de regressão logística ajustados pelos possíveis fatores de confusão.
ResultadosFoi constatada uma alimentação mais frequente (≥ 6 comparação a ≤ 3) entre estudantes mais novos (11,91 em comparação a 13,29 anos) (P<0,001). Estudantes que relataram 4 [Razão de chance (RC): 0,67; Intervalo de confiança (IC): 0,57-0,79], 5 (RC: 0,74; IC: 0,62-0,87) e 6 (RC: 0,54; IC: 0,44-0.65) refeições apresentaram menores chances de se tornarem obesos em comparação aos que apresentaram FAs ≤ 3. FA de 4 (RC: 0,82; IC: 0,71-0,94), 5 (RC: 0,86; IC: 0,74-0,99) e ≥ 6 (RC: 0,73; IC: 0,63-0,85) foi associada a menor prevalência de adiposidade abdominal.
ConclusãoA FA mais alta foi associada à redução nos valores médios das medidas antropométricas e de PA, bem como à menor prevalência de obesidade generalizada e abdominal em crianças e adolescentes. São necessários estudos longitudinais para avaliar os efeitos de longo prazo da FA sobre a composição corporal na faixa etária pediátrica.
It is well documented that non-communicable diseases originate from early life,1 and that their major risk factors, such as elevated blood pressure (BP) and excess weight, track from childhood to adulthood.
Hypertension is recognized as one of the main possible leading cause for several forms of end-organ damage.2 Prevalence and new incidence of elevated BP are increasing among children and adolescents.3 It has, however, been demonstrated that elevated BP in childhood increases the risk of pre-hypertension and hypertensive adulthood.4
Body weight status is one of the strong risk factors contributing to hypertension.3 The alarming rate in the prevalence of overweight and obesity is now becoming a serious public health issue worldwide.5,6
Multiple underlying factors, such as the high interaction between genetics and environment, including dietary components, might affect the body weight status.7 Dietary approaches focused on specific nutrients and foods do not completely explain the establishment of childhood obesity and its associated complications. Thus, it is of great importance to concentrate on dietary patterns and eating behaviors, such as eating frequency (EF).8
Previous studies have indicated that greater EF is associated with a healthier body weight and lower likelihood of hypertension among adult population.9,10 However, current evidence on the relationship of EF and adiposity among children and adolescents is not conclusive.11,12 Some associations are reported between skipping meals and increased risk of obesity in youth,13 whereas some other studies have not confirmed such a relationship.14 Therefore, this study aimed to explore the association of EF with anthropometric indexes and BP in a pediatric population.
MethodsThis cross-sectional, multi-centric survey was conducted in 2011–2012 as the fourth phase of a nationwide surveillance program, entitled the Childhood and Adolescence Surveillance and PreventIon of Adult Non-communicable disease (CASPIAN-IV) study.
Study details and protocols have been described previously.15 In brief, the CASPIAN-IV survey was conducted on a stratified multi-stage probability sample of 14,880 children and adolescents, aged 6–18 years, living in urban and rural areas of 30 provinces in Iran. Ethical committees of the relevant national organizations approved the current study (Ethical committee code: 188092). Written informed consent and oral assent were obtained from parents and participants, respectively.
Trained health care providers measured anthropometric indices including height (Ht), weight (Wt), waist circumference (WC), and wrist and hip circumferences (HC) under standard protocols by using calibrated equipment. Standing height was measured using a wall-mounted stadiometer to the nearest 0.1cm and weight was measured using a portable scale to the nearest 0.1kg. WC measurement was recorded at the minimum circumference between the iliac crest and the rib cage, using a non-elastic tape. Body mass index (BMI) was then calculated via the ratio of Wt (kg) to Ht squared (m2). The World Health Organization (WHO) standard curves were used to define underweight, overweight, and obesity. Definition of underweight was based on BMI less than 5th percentile for age and gender. Overweight subjects were classified as BMI between 85th and 95th percentiles, and obesity was considered as BMI greater than the 95th percentile for age and gender. Waist-to-hip ratio (WHR) and waist-to-height ratio (WHtR) were calculated by dividing WC by HC and Ht, respectively. WHtR more than 0.5 was considered as an indicator of abdominal obesity.16 Assessment of dietary intake of children and adolescents was based on parental report as frequency of food groups and/or items. Schools in Iran are in session for half a day; therefore, school meal programs are unusual, and students have almost all their meals at home. Parents were asked about the consumption frequency of the three main meals (breakfast/lunch/dinner) of their children, whereas students were asked about snack items.17 The snack items were considered as follows: (a) cakes, cookies, biscuits, chocolates, candies; (b) corn-puffs, chips, pretzels; (c) cola, soda, and sugar-sweetened beverages; (d) fruits, natural fruit juices, dried fruits; (e) milk and dairy products; (f) sausages, pizza, and hamburgers. EF was defined as the summation of the main meals and snacks items consumed, which was between 1 and 9, categorized into four groups as EF≤3, EF=4, EF=5, and EF≥6 according to its distribution. Data on socio-demographics, physical activity, sleeping, screen time, and smoking habits were collected through an interview with students. Physical activity and screen time (including watching TV, and leisure time computer and internet use) were categorized as mild, moderate, and vigorous/high with cut-offs of >2h or ≤2h per day, respectively. The socioeconomic status (SES) score of participants was constructed using the principle component analysis method, including the variables “parents’ education, parents’ job, possessing private car, school type (public/private), type of home (owned/rented), and having a personal computer in home.” The SES score was categorized into tertiles to construct three level of SES. The first level considered as “low SES,” the second level as “moderate SES,” and the third level as “high SES.”
All interviews were performed in a calm and friendly atmosphere; the questionnaires were completed anonymously.
To measure systolic and diastolic BP (SBP, DBP), participants were asked to sit quietly and relaxed with limited movement, and to breathe normally. BP was measured twice, using a standardized and calibrated mercury sphygmomanometer on the right arm. The cuff had appropriate size for the children's upper arm and the average of measured values (in duplicate, with 5min interval) was used to determine BP levels. The readings at the first Korotkoff sound were considered as the SBP, and at the fifth sound as DBP. The average of duplicate measurements was recorded and included in the analysis. The diagnosis of elevated BP in children was based on the 90th percentile of the distribution of SBP and/or DBP according to gender, age, and height.18
Statistical analysisData were analyzed using the STATA package (Release 12. College Station, STATA Corp LP, Package, TX, USA). All analyses were performed using survey analysis method. Mean, confidence intervals (95% CI), and percentages were calculated for continuous and categorical variables, respectively. Mean and prevalence of continuous and categorical variables across EF groups were assessed using the chi-squared and analysis of variance (ANOVA) tests. Association of EF with weight disorders, abdominal obesity, and high BP was assessed using different logistic regression models. In Model I, the crude association was assessed; in Model II, analysis was adjusted for age, gender, and living area; in Model III, screen time, physical activity, SES, and sleeping hours were additionally adjusted. BP analyses were adjusted for BMI in model IV. EF≤3 was considered as reference group for all statistical models. The result of logistic regression is presented as odds ratio (OR) and 95% confidence interval (95% CI). Association of EF with anthropometric indices and BP level was assessed using different linear regression models. All adjustments were the same as logistic regression models. The result of linear regression is presented as beta (β) and 95% CI. The significant level was set at p-value of less than 0.05.
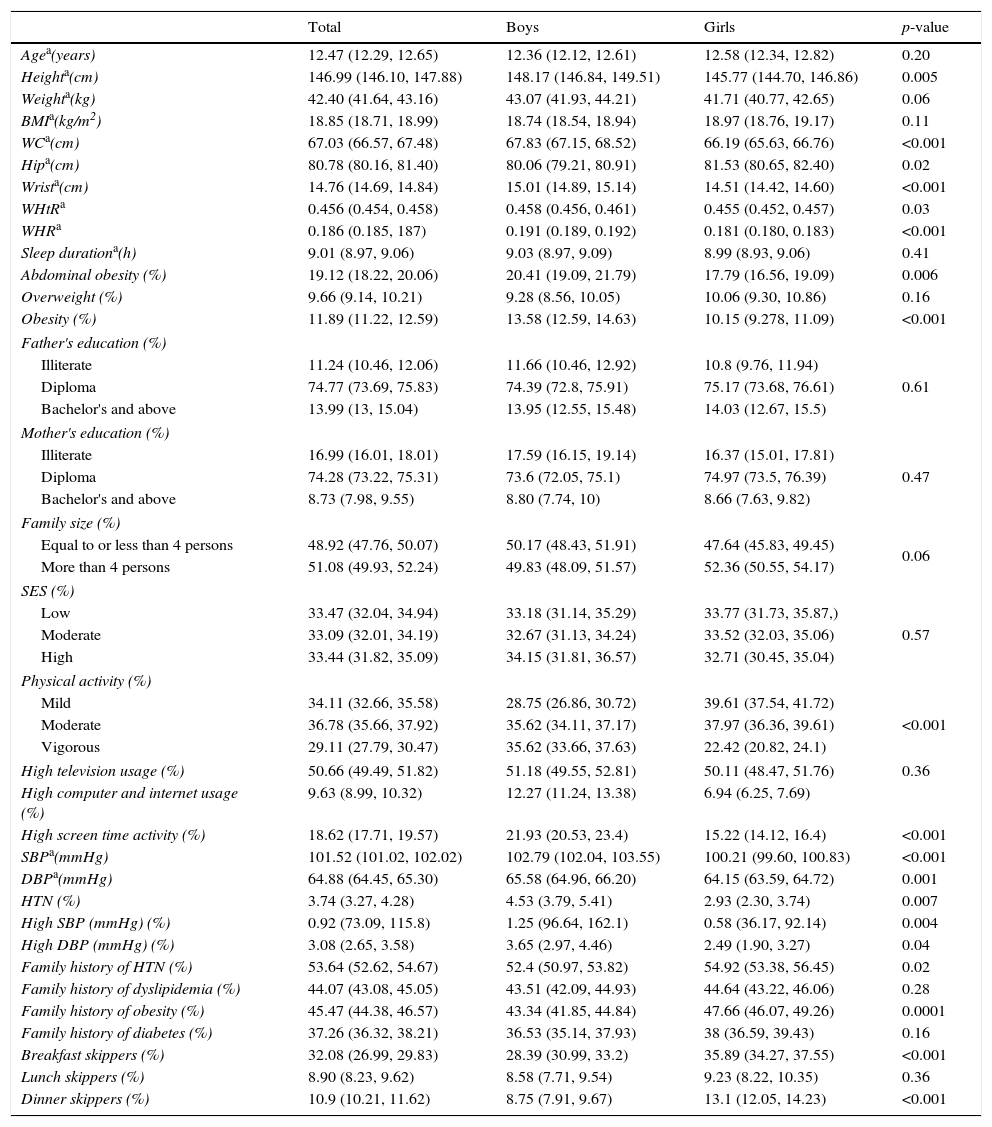
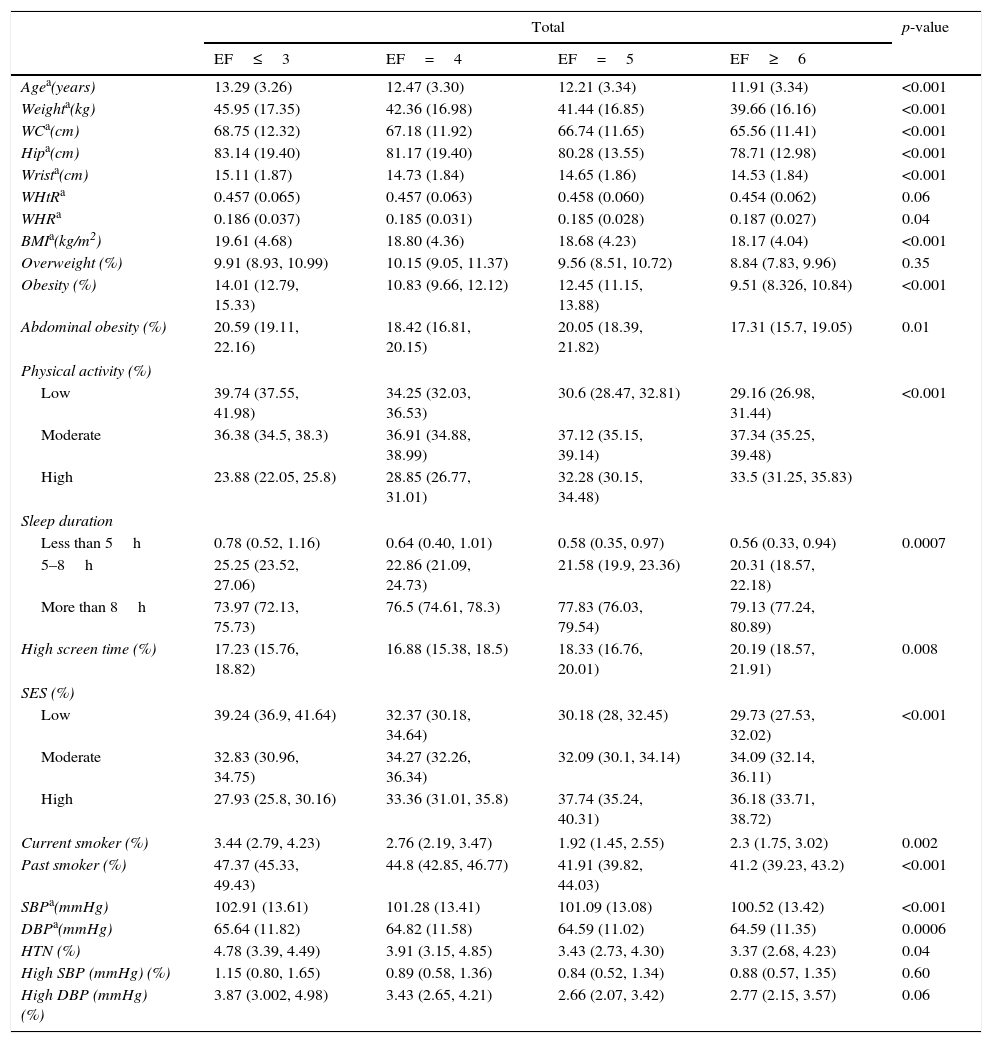
ResultsOverall, 13,486 students completed the study (participation rate: 90.6%). The mean age of participants was 12.47 years (95% CI: 12.29, 12.65), 49.2% were girls, and 75.6% were from urban areas. Demographic and anthropometric characteristics of participants are presented in Table 1. No significant gender difference existed in the mean age (p=0.20). The overall mean and 95% CI for BMI and WC were 18.85 (18.71, 18.99) kg/m2 and 67.03 (66.57, 67.48) cm, respectively. In total, 19.12% of students were abdominally obese and 11.89% were obese. Elevated BP was documented among 3.74% of students. Breakfast was determined as the main meal most skipped by children and adolescents (32.08% breakfast skippers vs. 8.90% lunch skippers vs. 10.90% dinner skippers). Anthropometric indices, leisure time activities, and frequency of elevated blood pressure are summarized in Table 2. As age increased, the frequency of eating decreased; 13.29 year old students ate ≤3 meals and/or snack, while 11.91 year old participants ate ≥6 meals and/or snacks during the day (p<0.001). Similar results were observed for boys and girls, separately. Anthropometric indices, such as weight (45.95 vs. 39.66kg), waist (68.75 vs. 65.56cm), and BMI (19.61 vs. 18.17kg/m2), were higher among those who had an EF of ≤3 compared to students with EF≥6 (all p-values<0.001). Lower EF was reported among obese subjects; in total, obesity was documented in 14.01% of students who reported EF≤3, and in 9.51% of those with EF≥6 (p<0.001). The likelihood of being abdominally obese was higher among boys who had EF≤3 (22.01%) compared to their counterparts with EF≥6 (18.30%) (p=0.030). Elevated SBP was documented among participants with lower EF than their peers reporting greater EF (p<0.001). The same result was also observed for boys (p<0.001) and girls (p<0.001). Subjects with EF≤3 were more likely to have higher DBP compared to those who consumed EF≥6 daily (p<0.001). Lower odds of elevated BP were observed among those who had higher EF (≥6) than those with fewer eating episodes (EF≤3) (p=0.040).
Demographic characteristics of the study participants: the CASPIAN-IV Study.
| Total | Boys | Girls | p-value | |
|---|---|---|---|---|
| Agea(years) | 12.47 (12.29, 12.65) | 12.36 (12.12, 12.61) | 12.58 (12.34, 12.82) | 0.20 |
| Heighta(cm) | 146.99 (146.10, 147.88) | 148.17 (146.84, 149.51) | 145.77 (144.70, 146.86) | 0.005 |
| Weighta(kg) | 42.40 (41.64, 43.16) | 43.07 (41.93, 44.21) | 41.71 (40.77, 42.65) | 0.06 |
| BMIa(kg/m2) | 18.85 (18.71, 18.99) | 18.74 (18.54, 18.94) | 18.97 (18.76, 19.17) | 0.11 |
| WCa(cm) | 67.03 (66.57, 67.48) | 67.83 (67.15, 68.52) | 66.19 (65.63, 66.76) | <0.001 |
| Hipa(cm) | 80.78 (80.16, 81.40) | 80.06 (79.21, 80.91) | 81.53 (80.65, 82.40) | 0.02 |
| Wrista(cm) | 14.76 (14.69, 14.84) | 15.01 (14.89, 15.14) | 14.51 (14.42, 14.60) | <0.001 |
| WHtRa | 0.456 (0.454, 0.458) | 0.458 (0.456, 0.461) | 0.455 (0.452, 0.457) | 0.03 |
| WHRa | 0.186 (0.185, 187) | 0.191 (0.189, 0.192) | 0.181 (0.180, 0.183) | <0.001 |
| Sleep durationa(h) | 9.01 (8.97, 9.06) | 9.03 (8.97, 9.09) | 8.99 (8.93, 9.06) | 0.41 |
| Abdominal obesity (%) | 19.12 (18.22, 20.06) | 20.41 (19.09, 21.79) | 17.79 (16.56, 19.09) | 0.006 |
| Overweight (%) | 9.66 (9.14, 10.21) | 9.28 (8.56, 10.05) | 10.06 (9.30, 10.86) | 0.16 |
| Obesity (%) | 11.89 (11.22, 12.59) | 13.58 (12.59, 14.63) | 10.15 (9.278, 11.09) | <0.001 |
| Father's education (%) | ||||
| Illiterate | 11.24 (10.46, 12.06) | 11.66 (10.46, 12.92) | 10.8 (9.76, 11.94) | 0.61 |
| Diploma | 74.77 (73.69, 75.83) | 74.39 (72.8, 75.91) | 75.17 (73.68, 76.61) | |
| Bachelor's and above | 13.99 (13, 15.04) | 13.95 (12.55, 15.48) | 14.03 (12.67, 15.5) | |
| Mother's education (%) | ||||
| Illiterate | 16.99 (16.01, 18.01) | 17.59 (16.15, 19.14) | 16.37 (15.01, 17.81) | 0.47 |
| Diploma | 74.28 (73.22, 75.31) | 73.6 (72.05, 75.1) | 74.97 (73.5, 76.39) | |
| Bachelor's and above | 8.73 (7.98, 9.55) | 8.80 (7.74, 10) | 8.66 (7.63, 9.82) | |
| Family size (%) | ||||
| Equal to or less than 4 persons | 48.92 (47.76, 50.07) | 50.17 (48.43, 51.91) | 47.64 (45.83, 49.45) | 0.06 |
| More than 4 persons | 51.08 (49.93, 52.24) | 49.83 (48.09, 51.57) | 52.36 (50.55, 54.17) | |
| SES (%) | ||||
| Low | 33.47 (32.04, 34.94) | 33.18 (31.14, 35.29) | 33.77 (31.73, 35.87,) | 0.57 |
| Moderate | 33.09 (32.01, 34.19) | 32.67 (31.13, 34.24) | 33.52 (32.03, 35.06) | |
| High | 33.44 (31.82, 35.09) | 34.15 (31.81, 36.57) | 32.71 (30.45, 35.04) | |
| Physical activity (%) | ||||
| Mild | 34.11 (32.66, 35.58) | 28.75 (26.86, 30.72) | 39.61 (37.54, 41.72) | <0.001 |
| Moderate | 36.78 (35.66, 37.92) | 35.62 (34.11, 37.17) | 37.97 (36.36, 39.61) | |
| Vigorous | 29.11 (27.79, 30.47) | 35.62 (33.66, 37.63) | 22.42 (20.82, 24.1) | |
| High television usage (%) | 50.66 (49.49, 51.82) | 51.18 (49.55, 52.81) | 50.11 (48.47, 51.76) | 0.36 |
| High computer and internet usage (%) | 9.63 (8.99, 10.32) | 12.27 (11.24, 13.38) | 6.94 (6.25, 7.69) | |
| High screen time activity (%) | 18.62 (17.71, 19.57) | 21.93 (20.53, 23.4) | 15.22 (14.12, 16.4) | <0.001 |
| SBPa(mmHg) | 101.52 (101.02, 102.02) | 102.79 (102.04, 103.55) | 100.21 (99.60, 100.83) | <0.001 |
| DBPa(mmHg) | 64.88 (64.45, 65.30) | 65.58 (64.96, 66.20) | 64.15 (63.59, 64.72) | 0.001 |
| HTN (%) | 3.74 (3.27, 4.28) | 4.53 (3.79, 5.41) | 2.93 (2.30, 3.74) | 0.007 |
| High SBP (mmHg) (%) | 0.92 (73.09, 115.8) | 1.25 (96.64, 162.1) | 0.58 (36.17, 92.14) | 0.004 |
| High DBP (mmHg) (%) | 3.08 (2.65, 3.58) | 3.65 (2.97, 4.46) | 2.49 (1.90, 3.27) | 0.04 |
| Family history of HTN (%) | 53.64 (52.62, 54.67) | 52.4 (50.97, 53.82) | 54.92 (53.38, 56.45) | 0.02 |
| Family history of dyslipidemia (%) | 44.07 (43.08, 45.05) | 43.51 (42.09, 44.93) | 44.64 (43.22, 46.06) | 0.28 |
| Family history of obesity (%) | 45.47 (44.38, 46.57) | 43.34 (41.85, 44.84) | 47.66 (46.07, 49.26) | 0.0001 |
| Family history of diabetes (%) | 37.26 (36.32, 38.21) | 36.53 (35.14, 37.93) | 38 (36.59, 39.43) | 0.16 |
| Breakfast skippers (%) | 32.08 (26.99, 29.83) | 28.39 (30.99, 33.2) | 35.89 (34.27, 37.55) | <0.001 |
| Lunch skippers (%) | 8.90 (8.23, 9.62) | 8.58 (7.71, 9.54) | 9.23 (8.22, 10.35) | 0.36 |
| Dinner skippers (%) | 10.9 (10.21, 11.62) | 8.75 (7.91, 9.67) | 13.1 (12.05, 14.23) | <0.001 |
Abdominal obesity: waist-to-height >0.5; high television usage: >2h/day; high computer usage: >2h/day; high screen time: >2h/day.
BMI, body mass index; WC, waist circumference; WHtR, waist-to-height ratio; SES, socio-economic status; WHR, waist-to-hip ratio; SBP, systolic blood pressure; DBP, diastolic blood pressure; HTN, hypertension.
Anthropometric indices, leisure time activities, and frequency of elevated blood pressure in participants according to their eating frequency (EF): the CASPIAN-IV Study.
| Total | p-value | ||||
|---|---|---|---|---|---|
| EF≤3 | EF=4 | EF=5 | EF≥6 | ||
| Agea(years) | 13.29 (3.26) | 12.47 (3.30) | 12.21 (3.34) | 11.91 (3.34) | <0.001 |
| Weighta(kg) | 45.95 (17.35) | 42.36 (16.98) | 41.44 (16.85) | 39.66 (16.16) | <0.001 |
| WCa(cm) | 68.75 (12.32) | 67.18 (11.92) | 66.74 (11.65) | 65.56 (11.41) | <0.001 |
| Hipa(cm) | 83.14 (19.40) | 81.17 (19.40) | 80.28 (13.55) | 78.71 (12.98) | <0.001 |
| Wrista(cm) | 15.11 (1.87) | 14.73 (1.84) | 14.65 (1.86) | 14.53 (1.84) | <0.001 |
| WHtRa | 0.457 (0.065) | 0.457 (0.063) | 0.458 (0.060) | 0.454 (0.062) | 0.06 |
| WHRa | 0.186 (0.037) | 0.185 (0.031) | 0.185 (0.028) | 0.187 (0.027) | 0.04 |
| BMIa(kg/m2) | 19.61 (4.68) | 18.80 (4.36) | 18.68 (4.23) | 18.17 (4.04) | <0.001 |
| Overweight (%) | 9.91 (8.93, 10.99) | 10.15 (9.05, 11.37) | 9.56 (8.51, 10.72) | 8.84 (7.83, 9.96) | 0.35 |
| Obesity (%) | 14.01 (12.79, 15.33) | 10.83 (9.66, 12.12) | 12.45 (11.15, 13.88) | 9.51 (8.326, 10.84) | <0.001 |
| Abdominal obesity (%) | 20.59 (19.11, 22.16) | 18.42 (16.81, 20.15) | 20.05 (18.39, 21.82) | 17.31 (15.7, 19.05) | 0.01 |
| Physical activity (%) | |||||
| Low | 39.74 (37.55, 41.98) | 34.25 (32.03, 36.53) | 30.6 (28.47, 32.81) | 29.16 (26.98, 31.44) | <0.001 |
| Moderate | 36.38 (34.5, 38.3) | 36.91 (34.88, 38.99) | 37.12 (35.15, 39.14) | 37.34 (35.25, 39.48) | |
| High | 23.88 (22.05, 25.8) | 28.85 (26.77, 31.01) | 32.28 (30.15, 34.48) | 33.5 (31.25, 35.83) | |
| Sleep duration | |||||
| Less than 5h | 0.78 (0.52, 1.16) | 0.64 (0.40, 1.01) | 0.58 (0.35, 0.97) | 0.56 (0.33, 0.94) | 0.0007 |
| 5–8h | 25.25 (23.52, 27.06) | 22.86 (21.09, 24.73) | 21.58 (19.9, 23.36) | 20.31 (18.57, 22.18) | |
| More than 8h | 73.97 (72.13, 75.73) | 76.5 (74.61, 78.3) | 77.83 (76.03, 79.54) | 79.13 (77.24, 80.89) | |
| High screen time (%) | 17.23 (15.76, 18.82) | 16.88 (15.38, 18.5) | 18.33 (16.76, 20.01) | 20.19 (18.57, 21.91) | 0.008 |
| SES (%) | |||||
| Low | 39.24 (36.9, 41.64) | 32.37 (30.18, 34.64) | 30.18 (28, 32.45) | 29.73 (27.53, 32.02) | <0.001 |
| Moderate | 32.83 (30.96, 34.75) | 34.27 (32.26, 36.34) | 32.09 (30.1, 34.14) | 34.09 (32.14, 36.11) | |
| High | 27.93 (25.8, 30.16) | 33.36 (31.01, 35.8) | 37.74 (35.24, 40.31) | 36.18 (33.71, 38.72) | |
| Current smoker (%) | 3.44 (2.79, 4.23) | 2.76 (2.19, 3.47) | 1.92 (1.45, 2.55) | 2.3 (1.75, 3.02) | 0.002 |
| Past smoker (%) | 47.37 (45.33, 49.43) | 44.8 (42.85, 46.77) | 41.91 (39.82, 44.03) | 41.2 (39.23, 43.2) | <0.001 |
| SBPa(mmHg) | 102.91 (13.61) | 101.28 (13.41) | 101.09 (13.08) | 100.52 (13.42) | <0.001 |
| DBPa(mmHg) | 65.64 (11.82) | 64.82 (11.58) | 64.59 (11.02) | 64.59 (11.35) | 0.0006 |
| HTN (%) | 4.78 (3.39, 4.49) | 3.91 (3.15, 4.85) | 3.43 (2.73, 4.30) | 3.37 (2.68, 4.23) | 0.04 |
| High SBP (mmHg) (%) | 1.15 (0.80, 1.65) | 0.89 (0.58, 1.36) | 0.84 (0.52, 1.34) | 0.88 (0.57, 1.35) | 0.60 |
| High DBP (mmHg) (%) | 3.87 (3.002, 4.98) | 3.43 (2.65, 4.21) | 2.66 (2.07, 3.42) | 2.77 (2.15, 3.57) | 0.06 |
| Boys | p-value | ||||
|---|---|---|---|---|---|
| EF≤3 | EF=4 | EF=5 | EF≥6 | ||
| Agea(years) | 13.18 (3.36) | 12.34 (3.33) | 12.20 (3.33) | 11.83 (3.40) | <0.001 |
| Weighta(kg) | 46.40 (18.56) | 42.81 (18.60) | 42.94 (17.99) | 40.31 (17.60) | <0.001 |
| WCa(cm) | 69.61 (12.93) | 68.05 (13.08) | 67.87 (12.53) | 66.22 (12.48) | <0.001 |
| Hipa(cm) | 81.87 (14.43) | 80.55 (24.02) | 80.24 (13.49) | 78.04 (13.26) | <0.001 |
| Wrista(cm) | 15.41 (2.07) | 14.97 (2.07) | 14.99 (1.99) | 14.76 (2.01) | <0.001 |
| WHtRa | 0.459 (0.067) | 0.459 (0.068) | 0.460 (0.063) | 0.456 (0.066) | 0.23 |
| WHRa | 0.192 (0.036) | 0.189 (0.032) | 0.189 (0.032) | 0.191 (0.029) | 0.14 |
| BMIa(kg/m2) | 19.32 (4.62) | 18.54 (4.42) | 18.87 (4.23) | 18.11 (4.07) | <0.001 |
| Overweight (%) | 9.16 (7.82, 10.7) | 9.05 (7.59, 10.75) | 9.64 (8.18, 11.32) | 9.46 (8.05, 11.08) | 0.95 |
| Obesity (%) | 14.81 (13.02, 16.79) | 11.85 (10.1, 13.84) | 16.13 (14.12, 18.37) | 10.78 (9.21, 12.58) | 0.0001 |
| Abdominal obesity (%) | 22.01 (19.81, 24.38) | 19.44 (17.05, 22.08) | 22.28 (19.92, 24.82) | 18.30 (16.16, 20.65) | 0.03 |
| Physical activity (%) | |||||
| Low | 34.2 (31.12, 37.41) | 29.07 (26.05, 32.29) | 27.11 (24.27, 30.15) | 23.87 (21.18, 26.78) | <0.001 |
| Moderate | 35.43 (32.79, 38.16) | 35.87 (33.03, 38.8) | 34.63 (32.03, 37.34) | 36.49 (33.6, 39.48) | |
| High | 30.37 (27.5, 33.41) | 35.06 (31.89, 38.38) | 38.25 (35.14, 41.47) | 39.64 (36.46, 42.92) | |
| Sleep duration | |||||
| Less than 5h | 0.39 (0.17, 0.86) | 0.80 (0.45, 1.44) | 0.57 (0.26, 1.23) | 0.52 (0.24, 1.14) | 0.17 |
| 5–8h | 24.37 (21.96, 26.95) | 23.14 (20.57, 25.92) | 20.96 (18.68, 23.43) | 20.89 (18.52, 23.48) | |
| More than 8h | 75.24 (72.63, 77.68) | 76.06 (73.25, 78.66) | 78.47 (75.95, 80.8) | 78.58 (75.99, 80.96) | |
| High screen time (%) | 21.73 (19.44, 24.21) | 19.62 (17.30, 22.17) | 21.92 (19.55, 24.5) | 23.07 (20.77, 25.54) | 0.20 |
| SES (%) | |||||
| Low | 39 (35.72, 42.38) | 32.97 (29.88, 36.22) | 30.59 (27.56, 33.79) | 29.29 (26.3, 32.46) | <0.001 |
| Moderate | 31.24 (28.59, 34.03) | 33.98 (31.07, 37.02) | 30.43 (27.74, 33.27) | 35.43 (32.64, 38.32) | |
| High | 29.76 (26.61, 33.11) | 33.05 (29.62, 36.67) | 38.98 (35.38, 42.7) | 35.29 (31.92, 38.81) | |
| Current smoker (%) | |||||
| Past smoker (%) | 4.31 (3.29, 5.63) | 3.49 (2.58, 4.70) | 3.25 (2.39, 4.39) | 3.01 (2.14, 4.22) | 0.23 |
| SBPa(mmHg) | 46.33 (43.36, 49.33) | 45.63 (42.76, 48.52) | 43.05 (40.14, 46.01) | 41.79 (38.98, 44.66) | 0.058 |
| DBPa(mmHg) | 104.29 (14.70) | 102.52 (13.89) | 102.62 (13.62) | 101.75 (14.13) | <0.001 |
| HTN (%) | 66.51 (12.25) | 65.56 (11.87) | 65.43 (11.36) | 65.36 (11.49) | 0.02 |
| High SBP (mmHg) (%) | 6.03 (4.65, 7.79) | 4.46 (3.32, 5.95) | 4.83 (3.68, 6.31) | 4.03 (3.004, 5.38) | 0.08 |
| High DBP (mmHg) (%) | 1.55 (1.003, 2.40) | 1.17 (0.68, 2) | 1.13 (0.63, 2.05) | 1.25 (0.75, 2.07) | 0.78 |
| 4.99 (3.73, 6.65) | 3.72 (2.70, 5.11) | 3.69 (2.74, 4.967) | 3.17 (2.28, 4.39) | 0.07 | |
| Girls | p-value | ||||
|---|---|---|---|---|---|
| EF≤3 | EF=4 | EF=5 | EF≥6 | ||
| Agea(years) | 13.39 (3.18) | 12.60 (3.26) | 12.23 (3.36) | 12.01 (3.27) | <0.001 |
| Weighta(kg) | 45.54 (16.14) | 41.93 (15.28) | 39.85 (15.40) | 38.93 (14.33) | <0.001 |
| WCa(cm) | 67.96 (11.67) | 66.34 (10.65) | 65.54 (10.51) | 64.82 (10.01) | <0.001 |
| Hipa(cm) | 84.32 (23.03) | 81.75 (13.64) | 80.33 (13.62) | 79.48 (12.62) | <0.001 |
| Wrista(cm) | 14.84 (1.62) | 14.49 (1.56) | 14.29 (1.64) | 14.28 (1.60) | <0.001 |
| WHtRa | 0.456 (0.064) | 0.455 (0.057) | 0.455 (0.056) | 0.452 (0.057) | 0.28 |
| WHRa | 0.181 (0.037) | 0.180 (0.029) | 0.180 (0.023) | 0.182 (0.025) | 0.38 |
| BMIa(kg/m2) | 19.87 (4.73) | 19.04 (4.30) | 18.49 (4.22) | 18.25 (4.01) | <0.001 |
| Overweight (%) | 10.62 (9.22, 12.19) | 11.19 (9.61, 12.98) | 9.47 (8.05, 11.12) | 8.13 (6.77, 9.74) | 0.03 |
| Obesity (%) | 13.27 (11.63, 15.1) | 9.87 (8.36, 11.61) | 8.57 (7.11, 10.31) | 8.06 (6.37, 10.14) | <0.001 |
| Abdominal obesity (%) | 19.28 (17.28, 21.45) | 17.45 (15.34, 19.78) | 17.7 (15.45, 20.21) | 16.19 (13.8, 18.91) | 0.25 |
| Physical activity (%) | |||||
| Low | 44.87 (41.88, 47.9) | 39.14 (36.05, 42.33) | 34.28 (31.17, 37.53) | 35.18 (31.93, 38.56) | <0.001 |
| Moderate | 37.25 (34.67, 39.91) | 37.9 (35.03, 40.85) | 39.75 (36.88, 42.68) | 38.31 (35.45, 41.26) | |
| High | 17.88 (15.79, 20.18) | 22.96 (20.43, 25.7) | 25.97 (23.2, 28.95) | 26.51 (23.62, 29.62) | |
| Sleep duration | |||||
| Less than 5h | 1.14 (0.72, 1.81) | 0.48 (0.23, 1.01) | 0.60 (0.30, 1.19) | 0.60 (0.30, 1.19) | 0.0008 |
| 5–8h | 26.07 (23.66, 28.62) | 22.59 (20.24, 25.13) | 22.24 (19.84, 24.84) | 19.66 (17.23, 22.33) | |
| More than 8h | 72.79 (70.18, 75.26) | 76.92 (74.34, 79.32) | 77.16 (74.53, 79.6) | 79.75 (77.05, 82.2) | |
| High screen time (%) | 13.07 (11.3, 15.08) | 14.28 (12.43, 16.35) | 14.54 (12.61, 16.71) | 16.92 (14.8, 19.27) | 0.04 |
| SES (%) | |||||
| Low | 39.47 (36.1, 42.94) | 31.79 (28.74, 35.02) | 29.74 (26.78, 32.89) | 30.23 (27.06, 33.6) | <0.001 |
| Moderate | 34.28 (31.71, 36.96) | 34.55 (31.8, 37.4) | 33.81 (31.01, 36.73) | 32.58 (29.87, 35.4) | |
| High | 26.25 (23.36, 29.35) | 33.66 (30.46, 37.01) | 36.44 (33.06, 39.97) | 37.2 (33.66, 40.87) | |
| Current smoker (%) | 2.63 (1.89, 3.64) | 2.07 (1.45, 2.95) | 0.52 (0.25, 1.09) | 1.49 (0.95, 2.34) | 0.0001 |
| Past smoker (%) | 48.34 (45.51, 51.17) | 44.01 (41.31, 46.75) | 40.71 (37.8, 43.68) | 40.53 (37.75, 43.37) | <0.001 |
| SBPa(mmHg) | 101.64 (12.38) | 100.10 (12.83) | 99.46 (12.29) | 99.12 (12.42) | <0.001 |
| DBPa(mmHg) | 64.84 (11.35) | 64.13 (11.26) | 63.72 (10.59) | 63.73 (11.15) | 0.02 |
| HTN (%) | 3.61 (2.38, 5.44) | 3.40 (2.45, 4.68) | 1.95 (1.30, 2.91) | 2.63 (1.77, 3.88) | 0.08 |
| High SBP (mmHg) (%) | 0.78 (0.41, 1.49) | 0.6233 (0.30, 1.27) | 0.5251 (0.25, 1.09) | 0.45 (0.20, 0.99) | 0.58 |
| High DBP (mmHg) (%) | 2.83 (1.69, 4.70) | 2.98 (2.10, 4.20) | 1.575 (0.99, 2.48) | 2.33 (1.52, 3.55) | 0.18 |
Abdominal obesity: waist-to-height >0.5; high screen time: >2h/day.
BMI, body mass index; WC, waist circumference; WHtR, waist-to-height ratio; SES, socio-economic status; WHR, waist-to-hip ratio; SBP, systolic blood pressure; DBP, diastolic blood pressure; HTN, hypertension.
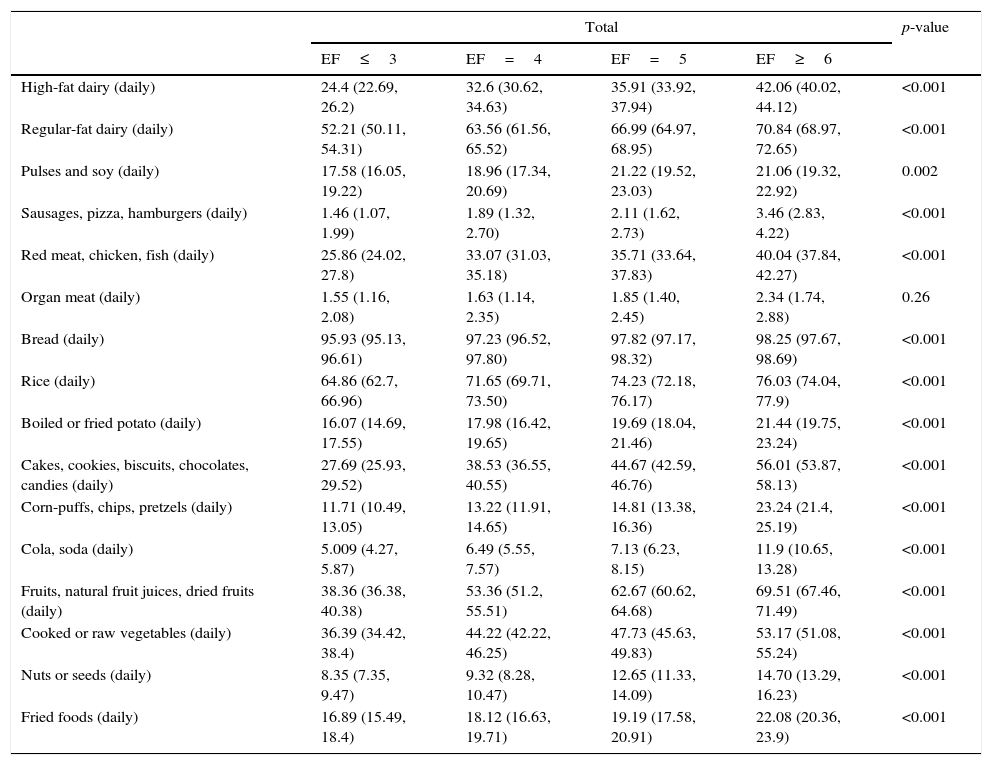
As shown in Table 3, consumption of pulses and soy was higher among those with 6≥EF compared to those with ≤3 EF (p=0.002). The same pattern was reported for boys (p=0.08) and girls (p=0.01).
Nutritional characteristics of participants according to their eating frequency: the CASPIAN-IV Study.
| Total | p-value | ||||
|---|---|---|---|---|---|
| EF≤3 | EF=4 | EF=5 | EF≥6 | ||
| High-fat dairy (daily) | 24.4 (22.69, 26.2) | 32.6 (30.62, 34.63) | 35.91 (33.92, 37.94) | 42.06 (40.02, 44.12) | <0.001 |
| Regular-fat dairy (daily) | 52.21 (50.11, 54.31) | 63.56 (61.56, 65.52) | 66.99 (64.97, 68.95) | 70.84 (68.97, 72.65) | <0.001 |
| Pulses and soy (daily) | 17.58 (16.05, 19.22) | 18.96 (17.34, 20.69) | 21.22 (19.52, 23.03) | 21.06 (19.32, 22.92) | 0.002 |
| Sausages, pizza, hamburgers (daily) | 1.46 (1.07, 1.99) | 1.89 (1.32, 2.70) | 2.11 (1.62, 2.73) | 3.46 (2.83, 4.22) | <0.001 |
| Red meat, chicken, fish (daily) | 25.86 (24.02, 27.8) | 33.07 (31.03, 35.18) | 35.71 (33.64, 37.83) | 40.04 (37.84, 42.27) | <0.001 |
| Organ meat (daily) | 1.55 (1.16, 2.08) | 1.63 (1.14, 2.35) | 1.85 (1.40, 2.45) | 2.34 (1.74, 2.88) | 0.26 |
| Bread (daily) | 95.93 (95.13, 96.61) | 97.23 (96.52, 97.80) | 97.82 (97.17, 98.32) | 98.25 (97.67, 98.69) | <0.001 |
| Rice (daily) | 64.86 (62.7, 66.96) | 71.65 (69.71, 73.50) | 74.23 (72.18, 76.17) | 76.03 (74.04, 77.9) | <0.001 |
| Boiled or fried potato (daily) | 16.07 (14.69, 17.55) | 17.98 (16.42, 19.65) | 19.69 (18.04, 21.46) | 21.44 (19.75, 23.24) | <0.001 |
| Cakes, cookies, biscuits, chocolates, candies (daily) | 27.69 (25.93, 29.52) | 38.53 (36.55, 40.55) | 44.67 (42.59, 46.76) | 56.01 (53.87, 58.13) | <0.001 |
| Corn-puffs, chips, pretzels (daily) | 11.71 (10.49, 13.05) | 13.22 (11.91, 14.65) | 14.81 (13.38, 16.36) | 23.24 (21.4, 25.19) | <0.001 |
| Cola, soda (daily) | 5.009 (4.27, 5.87) | 6.49 (5.55, 7.57) | 7.13 (6.23, 8.15) | 11.9 (10.65, 13.28) | <0.001 |
| Fruits, natural fruit juices, dried fruits (daily) | 38.36 (36.38, 40.38) | 53.36 (51.2, 55.51) | 62.67 (60.62, 64.68) | 69.51 (67.46, 71.49) | <0.001 |
| Cooked or raw vegetables (daily) | 36.39 (34.42, 38.4) | 44.22 (42.22, 46.25) | 47.73 (45.63, 49.83) | 53.17 (51.08, 55.24) | <0.001 |
| Nuts or seeds (daily) | 8.35 (7.35, 9.47) | 9.32 (8.28, 10.47) | 12.65 (11.33, 14.09) | 14.70 (13.29, 16.23) | <0.001 |
| Fried foods (daily) | 16.89 (15.49, 18.4) | 18.12 (16.63, 19.71) | 19.19 (17.58, 20.91) | 22.08 (20.36, 23.9) | <0.001 |
| Boys | p-value | ||||
|---|---|---|---|---|---|
| EF≤3 | EF=4 | EF=5 | EF≥6 | ||
| High-fat dairy (daily) | 25.24 (22.82, 27.83) | 34.48 (31.63, 37.46) | 36.03 (33.31, 38.85) | 43.06 (40.32, 45.85) | <0.001 |
| Regular-fat dairy (daily) | 53.66 (50.7, 56.6) | 63.01 (60, 65.93) | 65.98 (63.08, 68.77) | 70.33 (67.66, 72.86) | <0.001 |
| Pulses and soy (daily) | 16.86 (14.85, 19.08) | 17.84 (15.63, 20.28) | 19.18 (16.97, 21.59) | 20.46 (18.07, 23.07) | 0.08 |
| Sausages, pizza, hamburgers (daily) | 1.81 (1.22, 2.7) | 2.34 (1.55, 3.53) | 2.27 (1.60, 3.21) | 4.21 (3.26, 5.42) | 0.0005 |
| Red meat, chicken, fish (daily) | 24.09 (21.56, 26.82) | 30.66 (27.75, 33.73) | 33.90 (31.04, 36.88) | 38.21 (35.19, 41.32) | <0.001 |
| Organ meat (daily) | 1.74 (1.16, 2.61) | 2.12 (1.43, 3.13) | 2.05 (1.39, 3.02) | 2.37 (1.69, 3.30) | 0.69 |
| Bread (daily) | 96.19 (95.06, 97.07) | 97.88 (96.83, 98.59) | 97.51 (96.49, 98.25) | 98.29 (97.43, 98.87) | 0.003 |
| Rice (daily) | 65.98 (62.81, 69.01) | 72.28 (69.26, 75.1) | 73.48 (70.49, 76.26) | 74.14 (71.27, 76.82) | <0.001 |
| Boiled or fried potato (daily) | 16.79 (14.72, 19.08) | 17.48 (15.42, 19.76) | 19.80 (17.52, 22.29) | 22.08 (19.80, 24.55) | 0.001 |
| Cakes, cookies, biscuits, chocolates, candies (daily) | 26.28 (23.85, 28.86) | 37.96 (35.13, 40.87) | 41.51 (38.57, 44.50) | 53.81 (50.70, 56.89) | <0.001 |
| Corn-puffs, chips, pretzels (daily) | 11.29 (9.651, 13.17) | 12.37 (10.56, 14.44) | 13.85 (11.91, 16.05) | 22.05 (19.65, 24.65) | <0.001 |
| Cola, soda (daily) | 5.955 (4.83, 7.32) | 6.97 (5.66, 8.55) | 7.31 (6.07, 8.80) | 12.02 (10.37, 13.9) | <0.001 |
| Fruits, natural fruit juices, dried fruits (daily) | 35.82 (33.06, 38.67) | 51.61 (48.37, 54.83) | 59.70 (56.73, 62.60) | 68.53 (65.61, 71.31) | <0.001 |
| Cooked or raw vegetables (daily) | 33.23 (30.49, 36.08) | 40 (37.18, 42.89) | 45.35 (42.41, 48.33) | 51.65 (48.71, 54.57) | <0.001 |
| Nuts or seeds (daily) | 8.17 (6.81, 9.77) | 8.90 (7.46, 10.60) | 11.43 (9.79, 13.29) | 13.71 (11.94, 15.70) | <0.001 |
| Fried foods (daily) | 17.67 (15.62, 19.92) | 17.75 (15.58, 20.15) | 18.25 (16.06, 20.67) | 22.19 (19.65, 24.95) | 0.009 |
| Girls | p-value | ||||
|---|---|---|---|---|---|
| EF≤3 | EF=4 | EF=5 | EF≥6 | ||
| High-fat dairy (daily) | 23.62 (21.29, 26.11) | 30.81 (28.22, 33.52) | 35.78 (33, 38.65) | 40.92 (38, 43.9) | <0.001 |
| Regular-fat dairy (daily) | 50.87 (47.86, 53.87) | 64.08 (61.36, 66.72) | 68.06 (65.23, 70.76) | 71.43 (68.73, 73.98) | <0.001 |
| Pulses and soy (daily) | 18.24 (16, 20.72) | 20.03 (17.75, 22.52) | 23.38 (20.83, 26.13) | 21.75 (19.29, 24.42) | 0.01 |
| Sausages, pizza, hamburgers (daily) | 1.14 (0.69, 1.88) | 1.46 0 (0.91, 2.33) | 1.94 (1.31, 2.86) | 2.61 (1.90, 3.59) | 0.02 |
| Red meat, chicken, fish (daily) | 27.5 (24.86, 30.31) | 35.37 (32.43, 38.42) | 37.6 (34.59, 40.71) | 42.11 (38.95, 45.34) | <0.001 |
| Organ meat (daily) | 1.38 (0.89, 2.12) | 1.18 (0.68, 2.02) | 1.64 (1.09, 2.46) | 2.09 (1.41, 3.08) | 0.28 |
| Bread (daily) | 95.69 (94.46, 96.66) | 96.61 (95.53, 97.43) | 98.14 (97.23, 98.75) | 98.21 (97.33, 98.80) | <0.001 |
| Rice (daily) | 63.83 (60.65, 66.89) | 71.05 (68.21, 73.74) | 75.02 (72.06, 77.76) | 78.16 (75.27, 80.80) | <0.001 |
| Boiled or fried potato (daily) | 15.41 (13.63, 17.37) | 18.45 (16.23, 20.89) | 19.58 (17.24, 22.16) | 20.72 (18.29, 23.38) | 0.004 |
| Cakes, cookies, biscuits, chocolates, candies (daily) | 28.99 (26.55, 31.56) | 39.07 (36.34, 41.87) | 47.99 (45.08, 50.90) | 58.49 (55.57, 61.35) | <0.001 |
| Corn-puffs, chips, pretzels (daily) | 12.1 (10.3, 14.07) | 14.03 (12.22, 16.05) | 15.82 (13.76, 18.12) | 24.59 (21.84, 27.56) | <0.001 |
| Cola, soda (daily) | 4.13 (3.22, 5.29) | 6.04 (4.83, 7.521) | 6.94 (5.71, 8.41) | 11.77 (9.97, 13.84) | <0.001 |
| Fruits, natural fruit juices, dried fruits (daily) | 40.72 (37.87, 43.63) | 55.03 (52.06, 57.97) | 65.8 (62.95, 68.54) | 70.63 (67.8, 73.31) | <0.001 |
| Cooked or raw vegetables (daily) | 39.32 (36.57, 42.14) | 48.23 (45.41, 51.07) | 50.22 (47.28, 53.16) | 54.89 (51.94, 57.81) | <0.001 |
| Nuts or seeds (daily) | 8.51 (7.11, 10.15) | 9.71 (8.28, 11.37) | 13.92 (11.97, 16.13) | 15.82 (13.7, 18.2) | <0.001 |
| Fried foods (daily) | 16.18 (14.26, 18.3) | 18.47 (16.45, 20.69) | 20.18 (17.86, 22.71) | 21.96 (19.74, 24.35) | 0.001 |
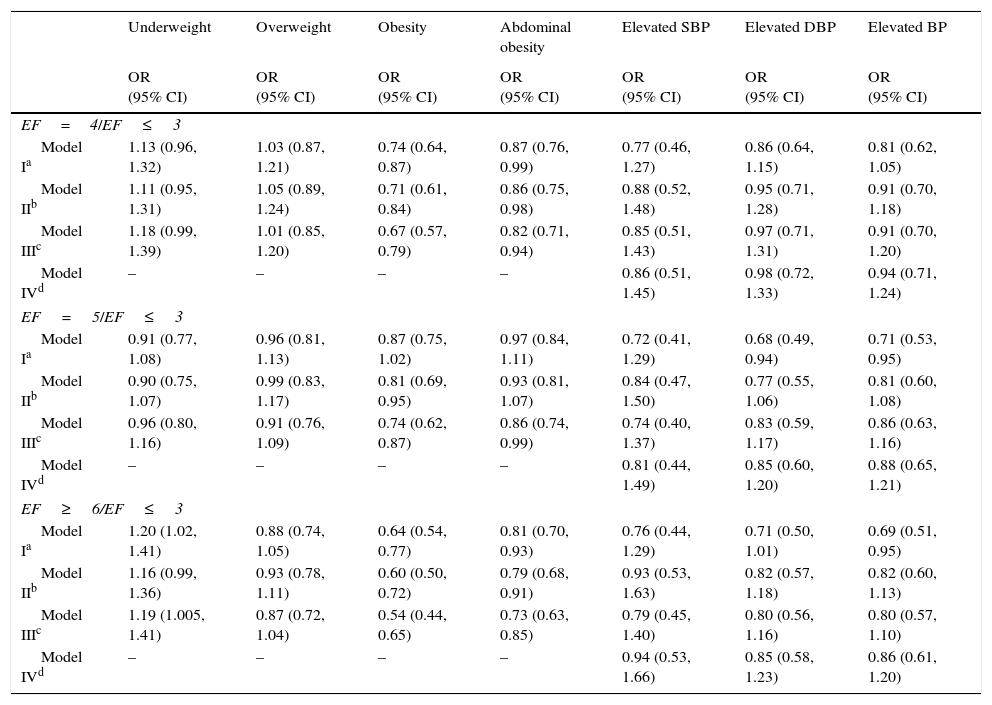
Table 4 presents the association of EF with abdominal obesity, weight disorders, and BP. A significant association was observed between EF and obesity; students who reported an EF of 4 (OR: 0.67, CI: 0.57–0.79), 5 (OR: 0.74, CI: 0.62–0.87), and 6 (OR: 0.54, CI: 0.44–0.65) had lower likelihood of being obese compared to those who had EF≤3. The odds of central obesity had significant inverse association with EF; having an EF of 4 (OR: 0.82, CI: 0.71–0.94), 5 (OR: 0.86, CI: 0.74–0.99), and ≥6 (OR: 0.73, CI: 0.63–0.85) decreased the OR of abdominal adiposity. Eating five times per day was related to lower risk of elevated DBP (OR: 0.68, CI: 0.49–0.94) at first, but after controlling for confounders, this association was no longer significant (OR: 0.85, CI: 0.60–1.20). The same associations were observed for elevated BP and EF=5 in Model 1 (OR: 0.71, CI: 0.53–0.95) and in the crude model of elevated BP and EF≥6 (OR: 0.69, CI: 0.51–0.95); these associations were no longer significant after further adjustment for potential covariates.
Association between eating frequency, anthropometric indices, and blood pressure using different logistic regression models: the CASPIAN-IV Study.
| Underweight | Overweight | Obesity | Abdominal obesity | Elevated SBP | Elevated DBP | Elevated BP | |
|---|---|---|---|---|---|---|---|
| OR (95% CI) | OR (95% CI) | OR (95% CI) | OR (95% CI) | OR (95% CI) | OR (95% CI) | OR (95% CI) | |
| EF=4/EF≤3 | |||||||
| Model Ia | 1.13 (0.96, 1.32) | 1.03 (0.87, 1.21) | 0.74 (0.64, 0.87) | 0.87 (0.76, 0.99) | 0.77 (0.46, 1.27) | 0.86 (0.64, 1.15) | 0.81 (0.62, 1.05) |
| Model IIb | 1.11 (0.95, 1.31) | 1.05 (0.89, 1.24) | 0.71 (0.61, 0.84) | 0.86 (0.75, 0.98) | 0.88 (0.52, 1.48) | 0.95 (0.71, 1.28) | 0.91 (0.70, 1.18) |
| Model IIIc | 1.18 (0.99, 1.39) | 1.01 (0.85, 1.20) | 0.67 (0.57, 0.79) | 0.82 (0.71, 0.94) | 0.85 (0.51, 1.43) | 0.97 (0.71, 1.31) | 0.91 (0.70, 1.20) |
| Model IVd | – | – | – | – | 0.86 (0.51, 1.45) | 0.98 (0.72, 1.33) | 0.94 (0.71, 1.24) |
| EF=5/EF≤3 | |||||||
| Model Ia | 0.91 (0.77, 1.08) | 0.96 (0.81, 1.13) | 0.87 (0.75, 1.02) | 0.97 (0.84, 1.11) | 0.72 (0.41, 1.29) | 0.68 (0.49, 0.94) | 0.71 (0.53, 0.95) |
| Model IIb | 0.90 (0.75, 1.07) | 0.99 (0.83, 1.17) | 0.81 (0.69, 0.95) | 0.93 (0.81, 1.07) | 0.84 (0.47, 1.50) | 0.77 (0.55, 1.06) | 0.81 (0.60, 1.08) |
| Model IIIc | 0.96 (0.80, 1.16) | 0.91 (0.76, 1.09) | 0.74 (0.62, 0.87) | 0.86 (0.74, 0.99) | 0.74 (0.40, 1.37) | 0.83 (0.59, 1.17) | 0.86 (0.63, 1.16) |
| Model IVd | – | – | – | – | 0.81 (0.44, 1.49) | 0.85 (0.60, 1.20) | 0.88 (0.65, 1.21) |
| EF≥6/EF≤3 | |||||||
| Model Ia | 1.20 (1.02, 1.41) | 0.88 (0.74, 1.05) | 0.64 (0.54, 0.77) | 0.81 (0.70, 0.93) | 0.76 (0.44, 1.29) | 0.71 (0.50, 1.01) | 0.69 (0.51, 0.95) |
| Model IIb | 1.16 (0.99, 1.36) | 0.93 (0.78, 1.11) | 0.60 (0.50, 0.72) | 0.79 (0.68, 0.91) | 0.93 (0.53, 1.63) | 0.82 (0.57, 1.18) | 0.82 (0.60, 1.13) |
| Model IIIc | 1.19 (1.005, 1.41) | 0.87 (0.72, 1.04) | 0.54 (0.44, 0.65) | 0.73 (0.63, 0.85) | 0.79 (0.45, 1.40) | 0.80 (0.56, 1.16) | 0.80 (0.57, 1.10) |
| Model IVd | – | – | – | – | 0.94 (0.53, 1.66) | 0.85 (0.58, 1.23) | 0.86 (0.61, 1.20) |
OR, odds ratio; CI, confidence interval; EF, eating frequency; SBP, systolic blood pressure; DBP, diastolic blood pressure.
The current nationwide study, which is thought to be the first of its kind, found that higher EF was inversely associated with overweight, obesity, and anthropometric indices, as well as with mean and elevated BP. Many previous epidemiological studies among adults have reported favorable associations of frequent eating with BP; however, evidence is lacking in the pediatric age group.10
Eating more frequently (≥6 vs. ≤3) was found among students with younger age. It might be because of the better control of parents regarding the food consumption of younger children and, therefore, higher adherence and compliance of young children to healthy dietary habits.19
By increasing EF, the estimated mean values of anthropometric measures including Wt and WC decreased, as well as the prevalence of overweight, obesity, and central obesity. Similar decreases were documented in the means of SBP, DBP, and the prevalence of elevated SBP and DBP. The association between frequent eating and lower obesity prevalence has also been proposed in previous studies.20 It has been assumed that low EF might promote weight gain and unfavorable health consequences that mimic features of metabolic syndrome among the adult population. However, higher EF could possibly lead to excess weight through higher calorie intake during a day. Although controversial, it is suggested that the reduction in hunger provided by regular eating might be another possible mechanism for weight management resulting from higher EF.20,21 The proportion of distributed energy intake throughout the day appears to be a key factor for weight control. It is also proposed that the distribution of standardized daily energy intake throughout a range of EFs might not lead to an association between EF and weight, whereas a direct association has been observed in ad libitum intake.22
The relationship of EF and BP is not fully understood. In the present study, lower EF was associated with both increased SBP and DBP compared to higher EF group. The same association was found for elevated BP. In a weight-maintenance trial, subjects with one meal per day had a 6% higher SBP and DBP compared to those who consumed three meals per day.23 No association of BP and a wide range of EF, from 1 to 9, was found in previous studies,24,25 whereas one study indicated that the relation of daily EF, especially snack frequency and BP in school-aged children, was inversely dependent on lean and fat mass of participants.26 However, in the present study, the relationships of EF with BP were adjusted for BMI and WC.
The underlying mechanisms responsible for the association of EF and BP remain to be determined, but they might be partly explained by the existing association of EF with general or central adiposity. Some evidence suggests that low EF is associated with obesity, particularly central obesity.27 The present results are consistent with the findings of a recent study that showed lower EF was related to higher increase in the 10-year changes in BMI and WC of adolescent girls.28 Obesity is recognized as a contributing factor for hypertension morbidity.29 The present study found significant associations of EF with generalized and central obesity. Furthermore, the relationship of EF and BP was attenuated after controlling for BMI and WC. These findings suggest that central obesity might be an underlying cause of the association between EF and elevated BP. It was found that individuals with higher EFs reported higher intake of pulses and soy protein, poultry and fish, rice, bread, fruits, and natural fruits. Likewise, previous findings have indicated that subjects who had higher EF were more likely to choose healthy food items, leading to improved quality of their diet,30 and increased daily intake of micronutrients including vitamin A, C, E, and β-carotene.10
The limitations of the current study must be addressed. First, its cross-sectional nature precludes the assumption of cause and effect relationships. Moreover, recall bias of dietary intake due to the retrospective data collection may have occurred. Third, as a major limitation of studies on EF, a standard definition of key terms including eating occasions, EF, meals, and snacks is still lacking. Due to the substantial differences in definitions, the comparability of the results between studies may be difficult.21 Moreover, the exact energy intake and expenditure of participants was not determined. However, to the best of the authors’ knowledge, this is the first study to explore the association between EF, BP, and anthropometric indices among a large, representative, nation-wide pediatric population.
In this study, higher EF was associated with decrease in the mean values of anthropometric measures and the prevalence of generalized and abdominal obesity, as well as with decrease in BP measures in children and adolescents. Longitudinal studies are necessary to identify the effects of EF on body composition, health condition, feelings of hunger and satiety, as well as on hormonal balance, particularly in obese children and adolescents.
FundingThis study was conducted as part of a national surveillance program.
Conflicts of interestThe authors declare no conflicts of interest.
The authors would like to thank the large team working with this project, as well as the students, their parents, and school principals who willingly participated in the study.
Please cite this article as: Kelishadi R, Qorbani M, Motlagh ME, Heshmat R, Ardalan G, Bahreynian M. Association of eating frequency with anthropometric indices and blood pressure in children and adolescents: the CASPIAN-IV Study. J Pediatr (Rio J). 2016;92:156–67.


