Leukemias comprise the most common group of cancers in children and adolescents. Studies conducted in other countries and Brazil have observed a decrease in their mortality.This study aimed to evaluate the trend of mortality from leukemia in children under 19 years of age in Brazil, from 1980 to 2010.
MethodsThis was an ecological study, using retrospective time series data from the Mortality Information System, from 1980 to 2010. Calculations of mortality rates were performed, including gross, gender-specific, and age-based. For trend analysis, linear and semi-log regression models were used. The significance level was 5%.
ResultsMortality rates for lymphoid and myeloid leukemias presented a growth trend, with the exception of lymphoid leukemia among children under 4 years of age (percentage decrease: 1.21% annually), while in the sub-group “Other types of leukemia”, a downward trend was observed. Overall, mortality from leukemia tended to increase for boys and girls, especially in the age groups 10-14 years (annual percentage increase of 1.23% for males and 1.28% for females) and 15-19 years (annual percentage increase of 1.40% for males and 1.62% for females).
ConclusionsThe results for leukemia generally corroborate the results of other similar studies. A detailed analysis by subgroup of leukemia, age, and gender revealed no trends shown in other studies, thus indicating special requirements for each variable in the analysis.
As leucemias compreendem o grupo mais frequente de neoplasias em crianças e adolescentes. Estudos conduzidos em outros países e no Brasil evidenciam, diminuição de sua mortalidade e aumento da sobrevida. O objetivo do estudo é conhecer a tendência de mortalidade por leucemia em menores de 19 anos de idade no Brasil de 1980 a 2010.
MétodosTrata-se de estudo ecológico, retrospectivo de série temporal com dados extraídos do Sistema de Informação sobre Mortalidade, no período de 1980 a 2010. Realizados cálculos das taxas de mortalidade brutas e específicas por sexo e faixa etária. Para a análise de tendência utilizou-se modelos de regressão semilogarítmicos e lineares. Adotado nível de significância de 5%.
ResultadosAs taxas de mortalidade por leucemias linfoides e mieloides apresentam tendência de crescimento com exceção das leucemias linfoides entre meninos menores de 4 anos de idade (queda percentual 1,21% ao ano), enquanto no subgrupo denominado “Outros tipos de leucemias” observa-se tendência de queda. De forma global, a mortalidade por leucemias tende a aumentar para meninos e meninas, principalmente nas faixas etárias de 10 a 14 anos (aumento percentual anual de 1,23% para meninos e 1,28% para meninas) e 15 a 19 anos (aumento percentual anual de 1,40% para meninos e 1,62% para meninas).
ConclusõesOs resultados para leucemias de forma geral corroboram com resultados de outros estudos similares. A análise minuciosa por subgrupo de leucemia, faixa etária e sexo revelou tendências não mostradas em outros estudos, indicando assim necessidades especiais na análise de cada variável.
Neoplasms have become important in the epidemiological scenario, as they represent one of the leading causes of death of in the 1 to 19 years age group in Brazil, second only to external causes, in 2010, despite the rarity of childhood cancer when compared to adults.1
In children, tumors are usually categorized into 12 specialty groups, according to the Third Edition of the International Classification of Childhood Cancer (ICCC). Leukemias constitute Group I, which comprises the subgroups: acute lymphocytic leukemia; acute myeloid leukemia; and chronic myeloproliferative disorders, including chronic myeloid leukemia and unspecific or combined types. Chronic lymphocytic leukemia is extremely rare in children and was therefore included in the subgroup of acute lymphocytic leukemia, the predominant type of leukemia in children, without affecting the incidence rates in this subgroup.2
Acute lymphoblastic leukemia represents the majority of cases among the diagnostic groups of lymphocytic leukemias (99%), so that the diagnosis group of ICCC becomes synonymous with acute lymphocytic leukemia. Likewise, acute nonlymphocytic leukemias are referred to as acute myeloid leukemia (representing 69%) and chronic myeloid leukemia, with 6-7% representation in its group.3
Leukemias have the highest incidence rates among childhood tumors in Brazil and worldwide. In a study conducted in the United States, of all neoplasms, leukemias showed a frequency of 26.3%. In Brazil, they were also the most prevalent in 20 population-based cancer registries, with a median percentage of 29%, with the highest incidence occurring in the age group 1-4 years, with a median percentage of 31.6%. Leukemia was the leading cause of death among cancers in children and adolescents (1-18 years) from 2001 to 2005 in Brazil, with 1,897 deaths in females and 2,539 deaths in males.4
The present study aimed to assess the trend of mortality from childhood leukemia in Brazil from 1980 to 2010.
MethodsThis is an ecological, retrospective, time-series study based on secondary data. The analysis included cases of death due to leukemia in children up to 19 years of age (inclusive), which occurred in Brazil and were recorded in the Mortality Information System (SIM) in the period of 1980-2010. Data were obtained from the website of the Department of Informatics of the Unified Health System (DATASUS)1 of the Ministry of Health.
The categorization used was based on the International Classification of Diseases,5 ninth and tenth revisions, ICD-9 (used from 1980 to 1995) and ICD-10 (used from 1996 to 2010), as they were the classifications used during the studied period.
The study considered deaths from leukemia those classified by codes 204 (lymphocytic leukemia), 205 (myeloid leukemia), 206 (monocytic leukemia), 207 (other specified leukemias), 208 (leukemia of unspecified cell type) in ICD-9. Then, the codes 206, 207, 208 were grouped in a single stratum called “other types of leukemias.” In the years after 1995, the ICD-10 was used with the codes C91 (lymphoid leukemia), C92 (myeloid leukemia), C93 (monocytic leukemia), C94 (other leukemias of specific cell type), C95 (leukemia of unspecified cell type), grouping codes C93, C94, C95 in a single stratum called “other types of leukemia.”
Patients were categorized into age groups with a range of 4 years, as recommended by the International Agency for Research on Cancer (IARC). Therefore the following age groups were used: 0-4; 5-9; 10-14; and 15-19 years.6 The first three groups correspond to children; the last, to adolescents. The female and male genders were analyzed together and separately.
Mortality rates from leukemia per million children and adolescents per year in Brazil were calculated. The following formula was used to calculate this coefficient in the selected period: number of deaths from leukemia by age group, divided by the population of children and adolescents, multiplied by 1,000,000. The specific mortality rate for each gender and leukemia subgroup was also calculated separately.
The direct standardization method was used so that the mortality rate would not be influenced by the age structure of the population, allowing for the comparison with other populations.7
The standard population used in this study was that proposed by Segie, modified by Doll.8 On standardization by age group and gender, it was considered that age structures are the same for men and women. Thus, the same standard population was used for calculation of the total coefficients and by gender.9
Regression adjustments were performed. The adjusted models were semi-log and linear defined as:
Semi-log: InYt=β1+β2t+¿t
Linear: Yt=β1+β2t+¿t
In which the dependent variables are InYt and Yt, the independent (or regressor) variable is time t, which assumes values 1,2,3... 31. β1 represents the intercept, β2 angular coefficient, and ¿t represents the random error. This method is widely used and recommended by the IARC.10
In the linear model, the angular coefficient β2 measures absolute variation, whereas in the semi-logarithmic model it measures the proportional variation or constant relative in Y for a given absolute variation in the value of the regressor (in this case, the variable t).
If the angular coefficient is positive, Y shows an increasing trend; if it is negative, Y shows a decreasing trend. Angular coefficients with p-value <5% in the t-test were considered statistically significant.11
Regressions were generated: for the total in each age group and for each type of leukemia; for boys and girls in each age group; and for each type of leukemia. A total of 96 regressions were analyzed.
The best model was chosen by the lower value criterion of the Akaike Information Criterion (AIC) and the lower values of Schwarz's Information Criterion, also known as Bayesian Information Criterion (BIC).11 Significances of the βˆ2 model were also evaluated, and in case of a draw, the simplest model was chosen, i.e., the linear one.
Excel 2007 (Microsoft, Washington, USA) and Eviews (IHS Global Inc. Califórnia, USA) software programs were used for the statistical analysis. The level of significance was set at 5%.
The study was approved by the Ethics Committee of the Health Sciences Center, Universidade Federal do Espírito Santo.
ResultsThe population of deaths from leukemia in children and adolescents (0-19 years) in Brazil consisted of 30,029 cases reported in the period of 1980-2010.
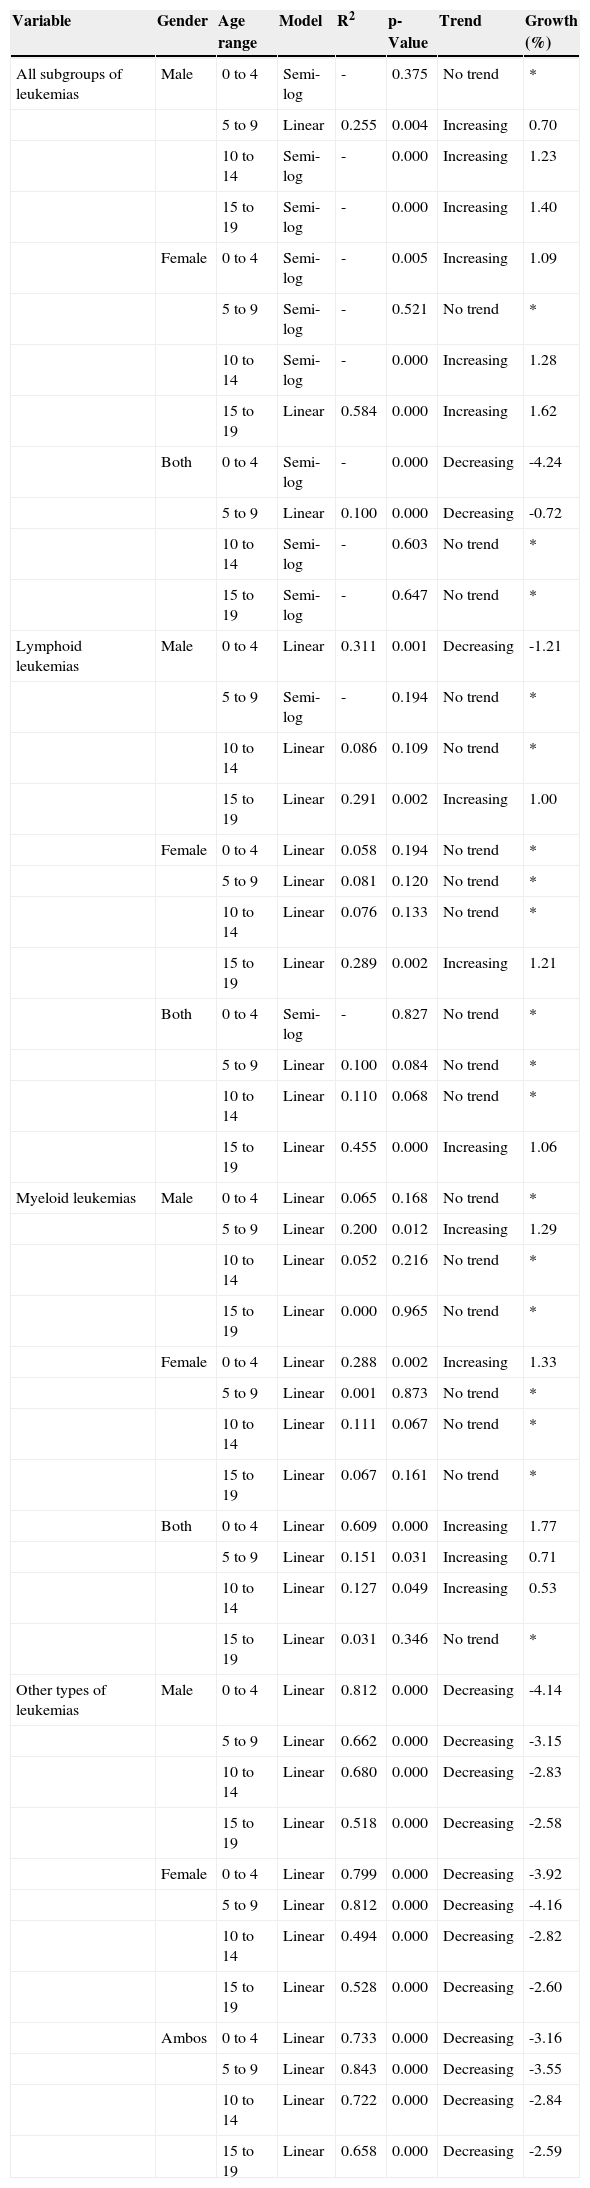
Table 1 shows the results of the best models for each combination of the variables gender, age range, and type of leukemia, including the total data for both genders and all types of leukemias.
Results of regressions of the chosen models.
| Variable | Gender | Age range | Model | R2 | p-Value | Trend | Growth (%) |
|---|---|---|---|---|---|---|---|
| All subgroups of leukemias | Male | 0 to 4 | Semi-log | - | 0.375 | No trend | * |
| 5 to 9 | Linear | 0.255 | 0.004 | Increasing | 0.70 | ||
| 10 to 14 | Semi-log | - | 0.000 | Increasing | 1.23 | ||
| 15 to 19 | Semi-log | - | 0.000 | Increasing | 1.40 | ||
| Female | 0 to 4 | Semi-log | - | 0.005 | Increasing | 1.09 | |
| 5 to 9 | Semi-log | - | 0.521 | No trend | * | ||
| 10 to 14 | Semi-log | - | 0.000 | Increasing | 1.28 | ||
| 15 to 19 | Linear | 0.584 | 0.000 | Increasing | 1.62 | ||
| Both | 0 to 4 | Semi-log | - | 0.000 | Decreasing | -4.24 | |
| 5 to 9 | Linear | 0.100 | 0.000 | Decreasing | -0.72 | ||
| 10 to 14 | Semi-log | - | 0.603 | No trend | * | ||
| 15 to 19 | Semi-log | - | 0.647 | No trend | * | ||
| Lymphoid leukemias | Male | 0 to 4 | Linear | 0.311 | 0.001 | Decreasing | -1.21 |
| 5 to 9 | Semi-log | - | 0.194 | No trend | * | ||
| 10 to 14 | Linear | 0.086 | 0.109 | No trend | * | ||
| 15 to 19 | Linear | 0.291 | 0.002 | Increasing | 1.00 | ||
| Female | 0 to 4 | Linear | 0.058 | 0.194 | No trend | * | |
| 5 to 9 | Linear | 0.081 | 0.120 | No trend | * | ||
| 10 to 14 | Linear | 0.076 | 0.133 | No trend | * | ||
| 15 to 19 | Linear | 0.289 | 0.002 | Increasing | 1.21 | ||
| Both | 0 to 4 | Semi-log | - | 0.827 | No trend | * | |
| 5 to 9 | Linear | 0.100 | 0.084 | No trend | * | ||
| 10 to 14 | Linear | 0.110 | 0.068 | No trend | * | ||
| 15 to 19 | Linear | 0.455 | 0.000 | Increasing | 1.06 | ||
| Myeloid leukemias | Male | 0 to 4 | Linear | 0.065 | 0.168 | No trend | * |
| 5 to 9 | Linear | 0.200 | 0.012 | Increasing | 1.29 | ||
| 10 to 14 | Linear | 0.052 | 0.216 | No trend | * | ||
| 15 to 19 | Linear | 0.000 | 0.965 | No trend | * | ||
| Female | 0 to 4 | Linear | 0.288 | 0.002 | Increasing | 1.33 | |
| 5 to 9 | Linear | 0.001 | 0.873 | No trend | * | ||
| 10 to 14 | Linear | 0.111 | 0.067 | No trend | * | ||
| 15 to 19 | Linear | 0.067 | 0.161 | No trend | * | ||
| Both | 0 to 4 | Linear | 0.609 | 0.000 | Increasing | 1.77 | |
| 5 to 9 | Linear | 0.151 | 0.031 | Increasing | 0.71 | ||
| 10 to 14 | Linear | 0.127 | 0.049 | Increasing | 0.53 | ||
| 15 to 19 | Linear | 0.031 | 0.346 | No trend | * | ||
| Other types of leukemias | Male | 0 to 4 | Linear | 0.812 | 0.000 | Decreasing | -4.14 |
| 5 to 9 | Linear | 0.662 | 0.000 | Decreasing | -3.15 | ||
| 10 to 14 | Linear | 0.680 | 0.000 | Decreasing | -2.83 | ||
| 15 to 19 | Linear | 0.518 | 0.000 | Decreasing | -2.58 | ||
| Female | 0 to 4 | Linear | 0.799 | 0.000 | Decreasing | -3.92 | |
| 5 to 9 | Linear | 0.812 | 0.000 | Decreasing | -4.16 | ||
| 10 to 14 | Linear | 0.494 | 0.000 | Decreasing | -2.82 | ||
| 15 to 19 | Linear | 0.528 | 0.000 | Decreasing | -2.60 | ||
| Ambos | 0 to 4 | Linear | 0.733 | 0.000 | Decreasing | -3.16 | |
| 5 to 9 | Linear | 0.843 | 0.000 | Decreasing | -3.55 | ||
| 10 to 14 | Linear | 0.722 | 0.000 | Decreasing | -2.84 | ||
| 15 to 19 | Linear | 0.658 | 0.000 | Decreasing | -2.59 |
Obs: Where there was no trend, the values were omitted and reported as *.
Since the R2 values of semi-log and linear regressions are not comparable, only R2 values of the linear regressions werereported.
An annual percentage rate was found showing a 4.24% decrease in mortality (for ages 0-4 years) when evaluating the leukemias in general, without establishing subgroups and irrespective of gender.
Mortality rates from lymphoid leukemias showed an increasing trend, except in boys aged 0-4 years, which showed an annual percentage decrease of 1.21%.
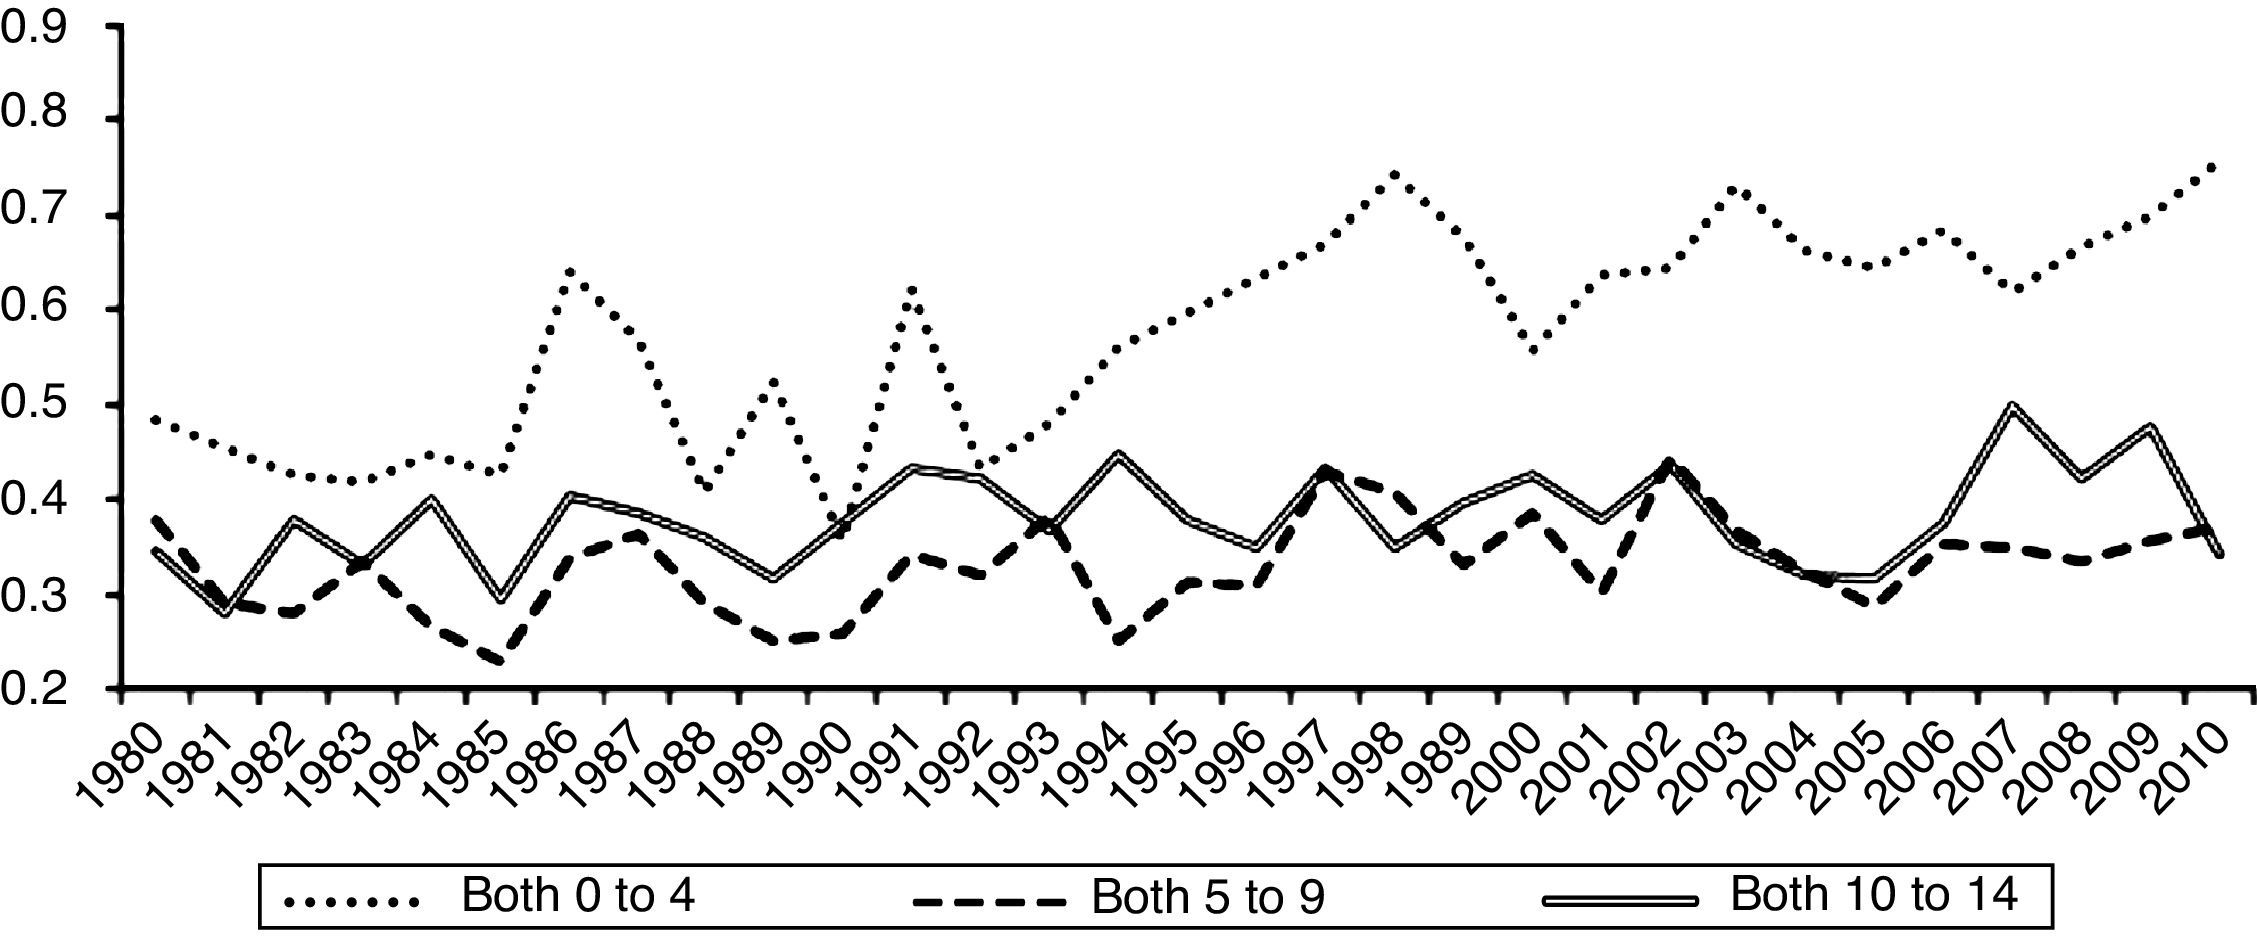
Mortality rates for myeloid leukemia showed an increasing trend, and the most accentuated rate, with an annual percentage of 1.77% was observed in the age group 0-4 years, analyzed in both genders (Fig. 1).

Mortality rates for the subgroup of other types of leukemias showed a decreasing trend, with the most prominent among them observed for females in the age group 5-9 years, with an annual percentage decrease of 4.16% per year.
DiscussionThe analysis of historical trends in mortality is more suitable for assessing the progress of cancer than the incidence trend. This assertion is based on the fact that vital statistics, such as mortality, are less subject to changes in surveillance and cancer recording practices than registry data (e.g., data for calculation of incidence).12
In epidemiology, studies of temporal trends may be useful in the construction of the phenomenon etiology or validation of associations between risk (mortality and incidence) and disease. The analysis of the temporal evolution constitutes a tool in epidemiological surveillance for primary prevention (reducing exposure to risk factors) and secondary (screening) of diseases, aiming at reducing mortality. In public health, the possible changes in risks from the past lead to a wish to know the future development, aimed to plan and determine budget priorities and necessary health services.13
Few investigations have studied the trend of leukemia in Brazilian children and adolescents. In a study conducted in Fortaleza,14 there was a decreasing trend in mortality from leukemia. In the present investigation, the same pattern was found for an overall analysis of all leukemias in both genders.
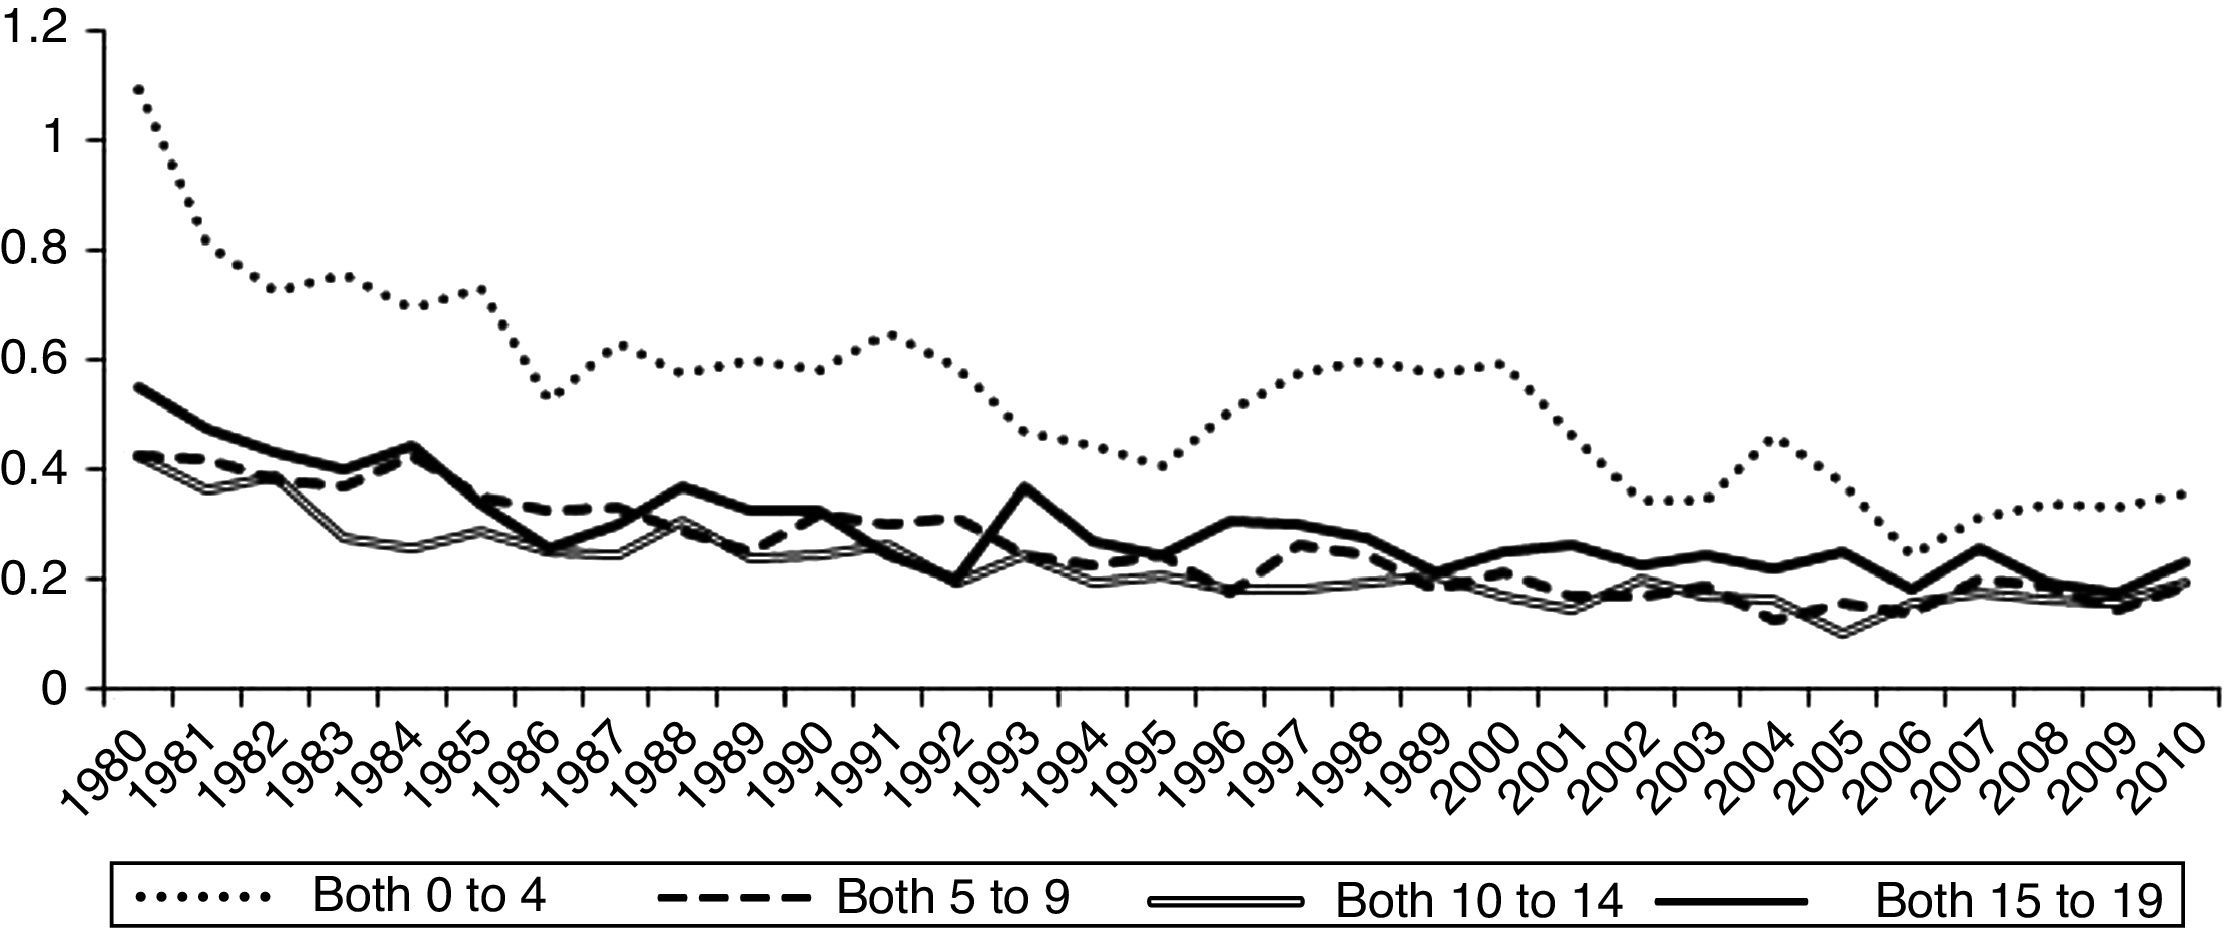
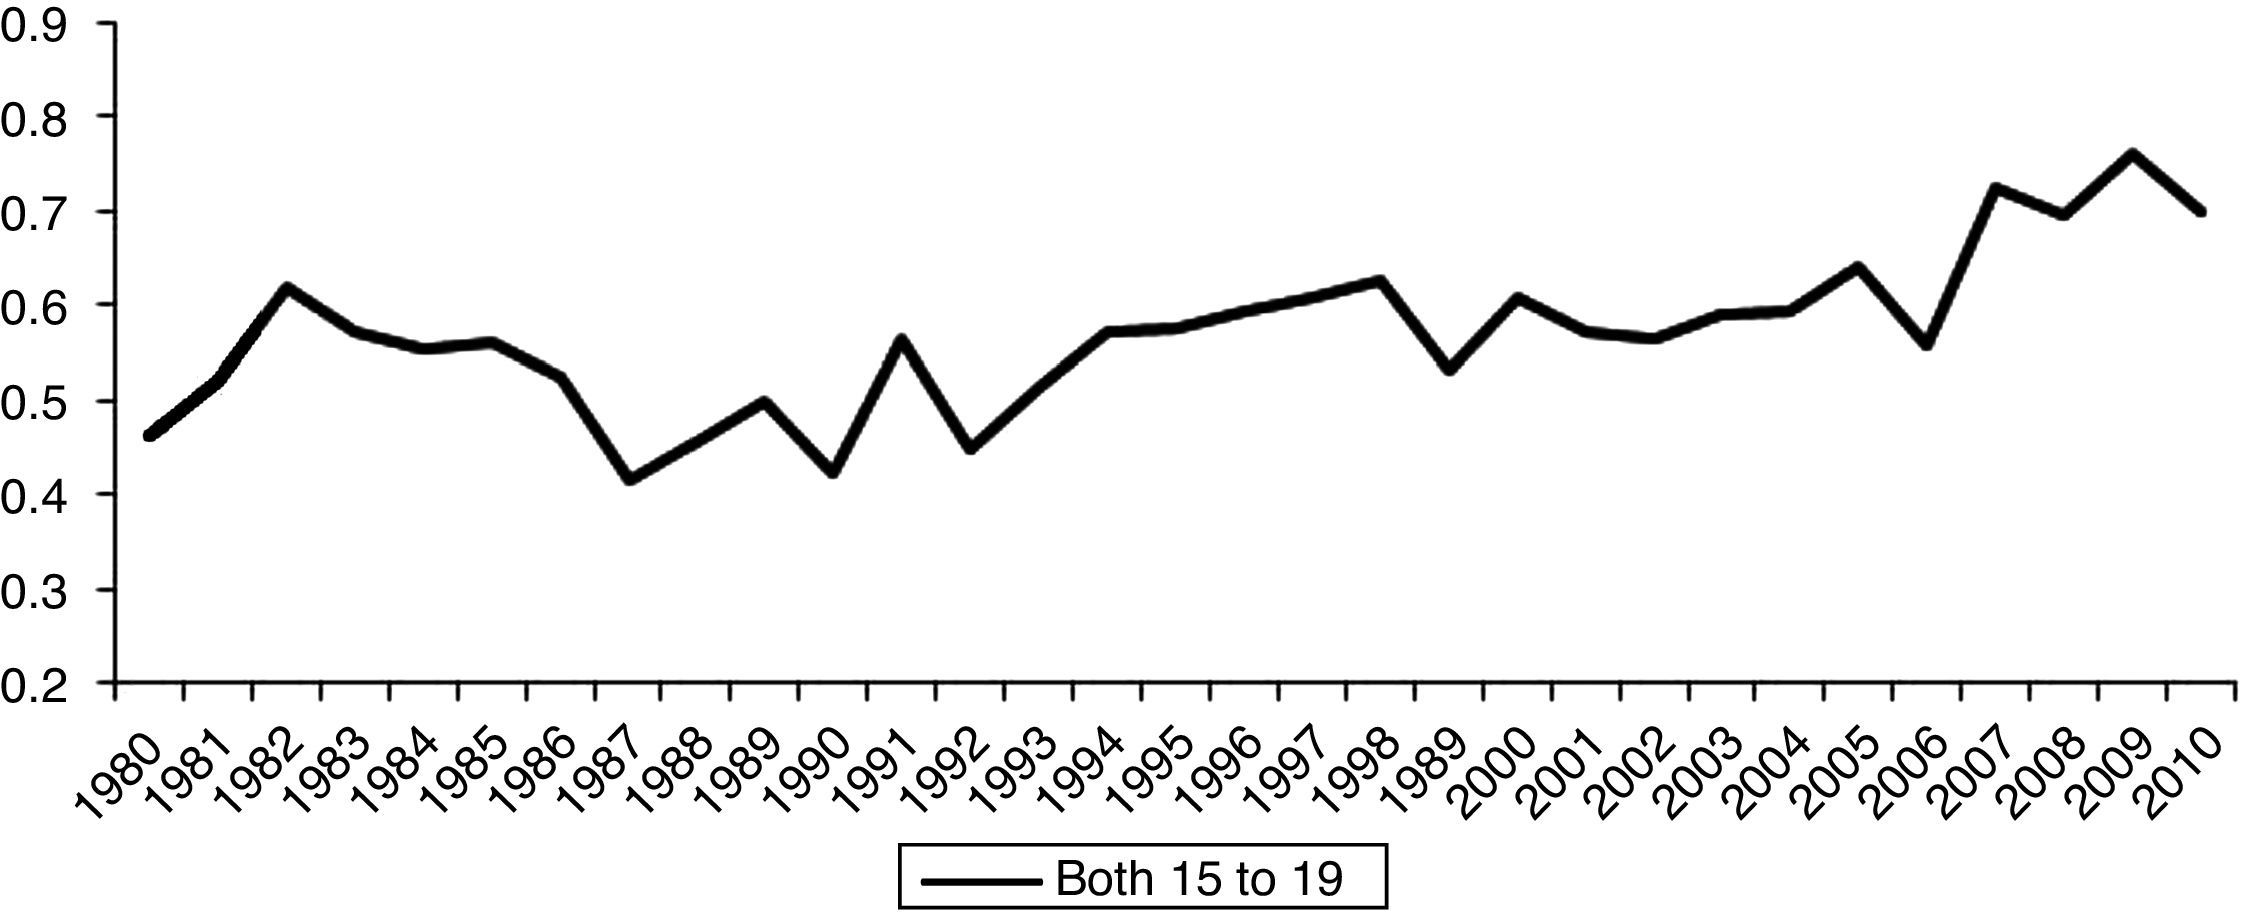
However, when leukemia was analyzed by specific subgroups, the behavior was shown to be different. While leukemias here classified as “other types” showed a decrease in mortality in all age groups (Fig. 2), the lymphoid leukemias showed an increasing trend in the age group 15-19 years (Fig. 3). When considering only the gender, the pattern also changed: the mortality rates from leukemias in males and females showed an increasing trend.


Studies performed in Latin American countries (Brazil, Chile, and the Dominican Republic) showed a decrease in the mortality trend. This behavior can be explained by the improvement in cancer diagnostic techniques and increasingly effective chemotherapy protocols, procedures that directly reflect the improved disease prognosis.15
The present study showed an increasing mortality trend at ages 15-19 years for lymphoid leukemias, for both genders. The Latin-American study15 discusses this difference by asserting that protocols for the treatment of adolescents and young adults are not adequate for this age group, since patients sometimes are treated as adults and sometimes as pediatric patients, and that special physical and psychological needs for this age group are not recognized. This inappropriate treatment is demonstrated as differences in survival between the age groups. It is necessary to recognize the differences in the biological characteristics of the disease, which will lead to further advances in lymphoid leukemia therapeutic protocols for older children (older than 10 years).
The toxicity and mortality associated with treatment have been discussed in specific studies on leukemia, which can influence the increased rates of mortality in certain groups.
There have been reports that intensive chemotherapy in patients with acute lymphoid leukemia leads to severe neutropenia, exposing patients to infections that can cause death (41% of deaths in a sample were related to septic shock).16 Estimates have described that deaths related to acute lymphoid leukemia treatment in less developed countries range between 11% and 20%; for acute myeloid leukemia, it may reach 33%.17
The lack of information about data quality and possible migration of cases, as well as the heterogeneity of Brazilian rates, are limitations of the study and need to be considered when assessing the conclusions. The Brazilian Mortality Information System (Sistema de Informações de Mortalidade - SIM) was created in 1975 and 1976, and is one of the first in Brazil. The quality of mortality data has improved over the years, although it still contains flaws. It is estimated that the coverage of mortality data in 1999 was 82%. The quality should be emphasized, particularly in cases of death from cancer, as these have a death certificate that has been adequately completed.18
Thus, the mortality rates of cancer may change due to registry artifacts over the years. It is possible that the cases that were once classified in death certificates as “other leukemias” or just “leukemia” without specification, have migrated over time to the specific cases, causing these rates to increase. This may have led to more detailed completion of death certificates.
As a result, there was a more pronounced decreasing mortality trend in cases defined as “other leukemias” and increased rates of specific cases. Another aspect to be considered is the heterogeneity regarding the regions. While Brazil generally showed a decreasing trend in the estimated mean annual growth rates of leukemia mortality, there was an increasing trend in the North and Northeast regions.19
This study demonstrated that for leukemias, in general, there was a decreasing trend in mortality rates, as did other studies.19,20 However, on a more detailed analysis, when assessing subgroups of leukemias and specifying gender, these trends changed: while the lymphoid (except for the age group of up to four years in boys) and myeloid leukemia rates showed an increase, the subgroup classified as “other leukemias” showed a decrease. Observing all leukemias and considering gender, mortality rates of males and females showed an increase. A detailed analysis by subgroup of leukemia, age range, and gender showed trends not observed in other studies, thus indicating special requirements for the analysis of each variable.
Conflicts of interestThe authors declare no conflicts of interest.
Please cite this article as: Silva FF, Zandonade E, Zouain-Figueiredo GP. Analysis of childhood leukemia mortality trends in Brazil, from 1980 to 2010. J Pediatr (Rio J). 2014;90:587–92.
Study associated with the Postgraduate Program in Collective Health, Universidade Federal do Espírito Santo, Vitória, ES, Brazil.
articles


