
We sought to describe the prevalence of microcephaly and to compare the different cutoff points established by the Brazilian Ministry of Health at various times during a Zika virus epidemic. As a secondary aim, we investigated the possible etiology of the microcephaly.
MethodThis retrospective study utilized newborn participants in the Zika Cohort Study Jundiaí. Newborns from the Zika Cohort Study Jundiaí with an accurate gestational age determination and complete anthropometric data were analyzed, and microcephaly was diagnosed according to the INTERGROWTH-21st curve. At delivery, fluids were tested for specific antibodies and for viruses. Brain images were evaluated for microcephaly. Receiver Operating Characteristic curves were plotted to define the accuracy of different cutoff points for microcephaly diagnosis.
ResultsOf 462 eligible newborns, 19 (4.1%) were positive for microcephaly. Cutoff points corresponding to the curves of the World Health Organization yielded the best sensitivity and specificity. Three of the microcephaly cases (15.8%) were positive for Zika virus infections; nine (47.4%) had intrauterine growth restriction; one had intrauterine growth restriction and was exposed to Zika virus; three had a genetic syndrome (15.8%); and three had causes that had not been determined (15.8%).
ConclusionsMicrocephaly prevalence was 4.1% in this study. Cutoff values determined by the World Health Organization had the highest sensitivity and specificity in relation to the standard IG curve. The main reason for microcephaly was intrauterine growth restriction. All possible causes of microcephaly must be investigated to allow the best development of an affected baby.
Congenital microcephaly is a clinical condition where the head circumference (HC) is smaller than expected. It is defined as an HC equal to or less than two standard deviations (SDs) below the expected mean for a given gestational age and sex.1,2 It is a scenario that affects both the newborn (reducing its quality of life and life expectancy) and the family (economic burdens and parental stress).3 Microcephaly is an adverse manifestation with multiple etiologies. There is now a consensus on the association between Zika virus (ZIKV) infection during pregnancy and microcephaly.4 Many recent studies from South America have cited a lower prevalence of microcephaly (1–12 per 10,000 children) but the frequency in Brazil is reportedly higher.5–7
Although the presence of microcephaly is not difficult to identify using standard criteria, several factors can affect the accuracy of its detection, such as the time between delivery and the HC measurement, the type of instrument used to measure the HC, the shape of the baby’s skull, and the accuracy of the gestational age determination, among others.8
The present cross-sectional study aimed to determine the most sensitive cutoff point by comparing different cutoff points to diagnose microcephaly, compared to the INTERGROWTH-21st curve (IG), and to identify the etiology of the microcephalies observed.
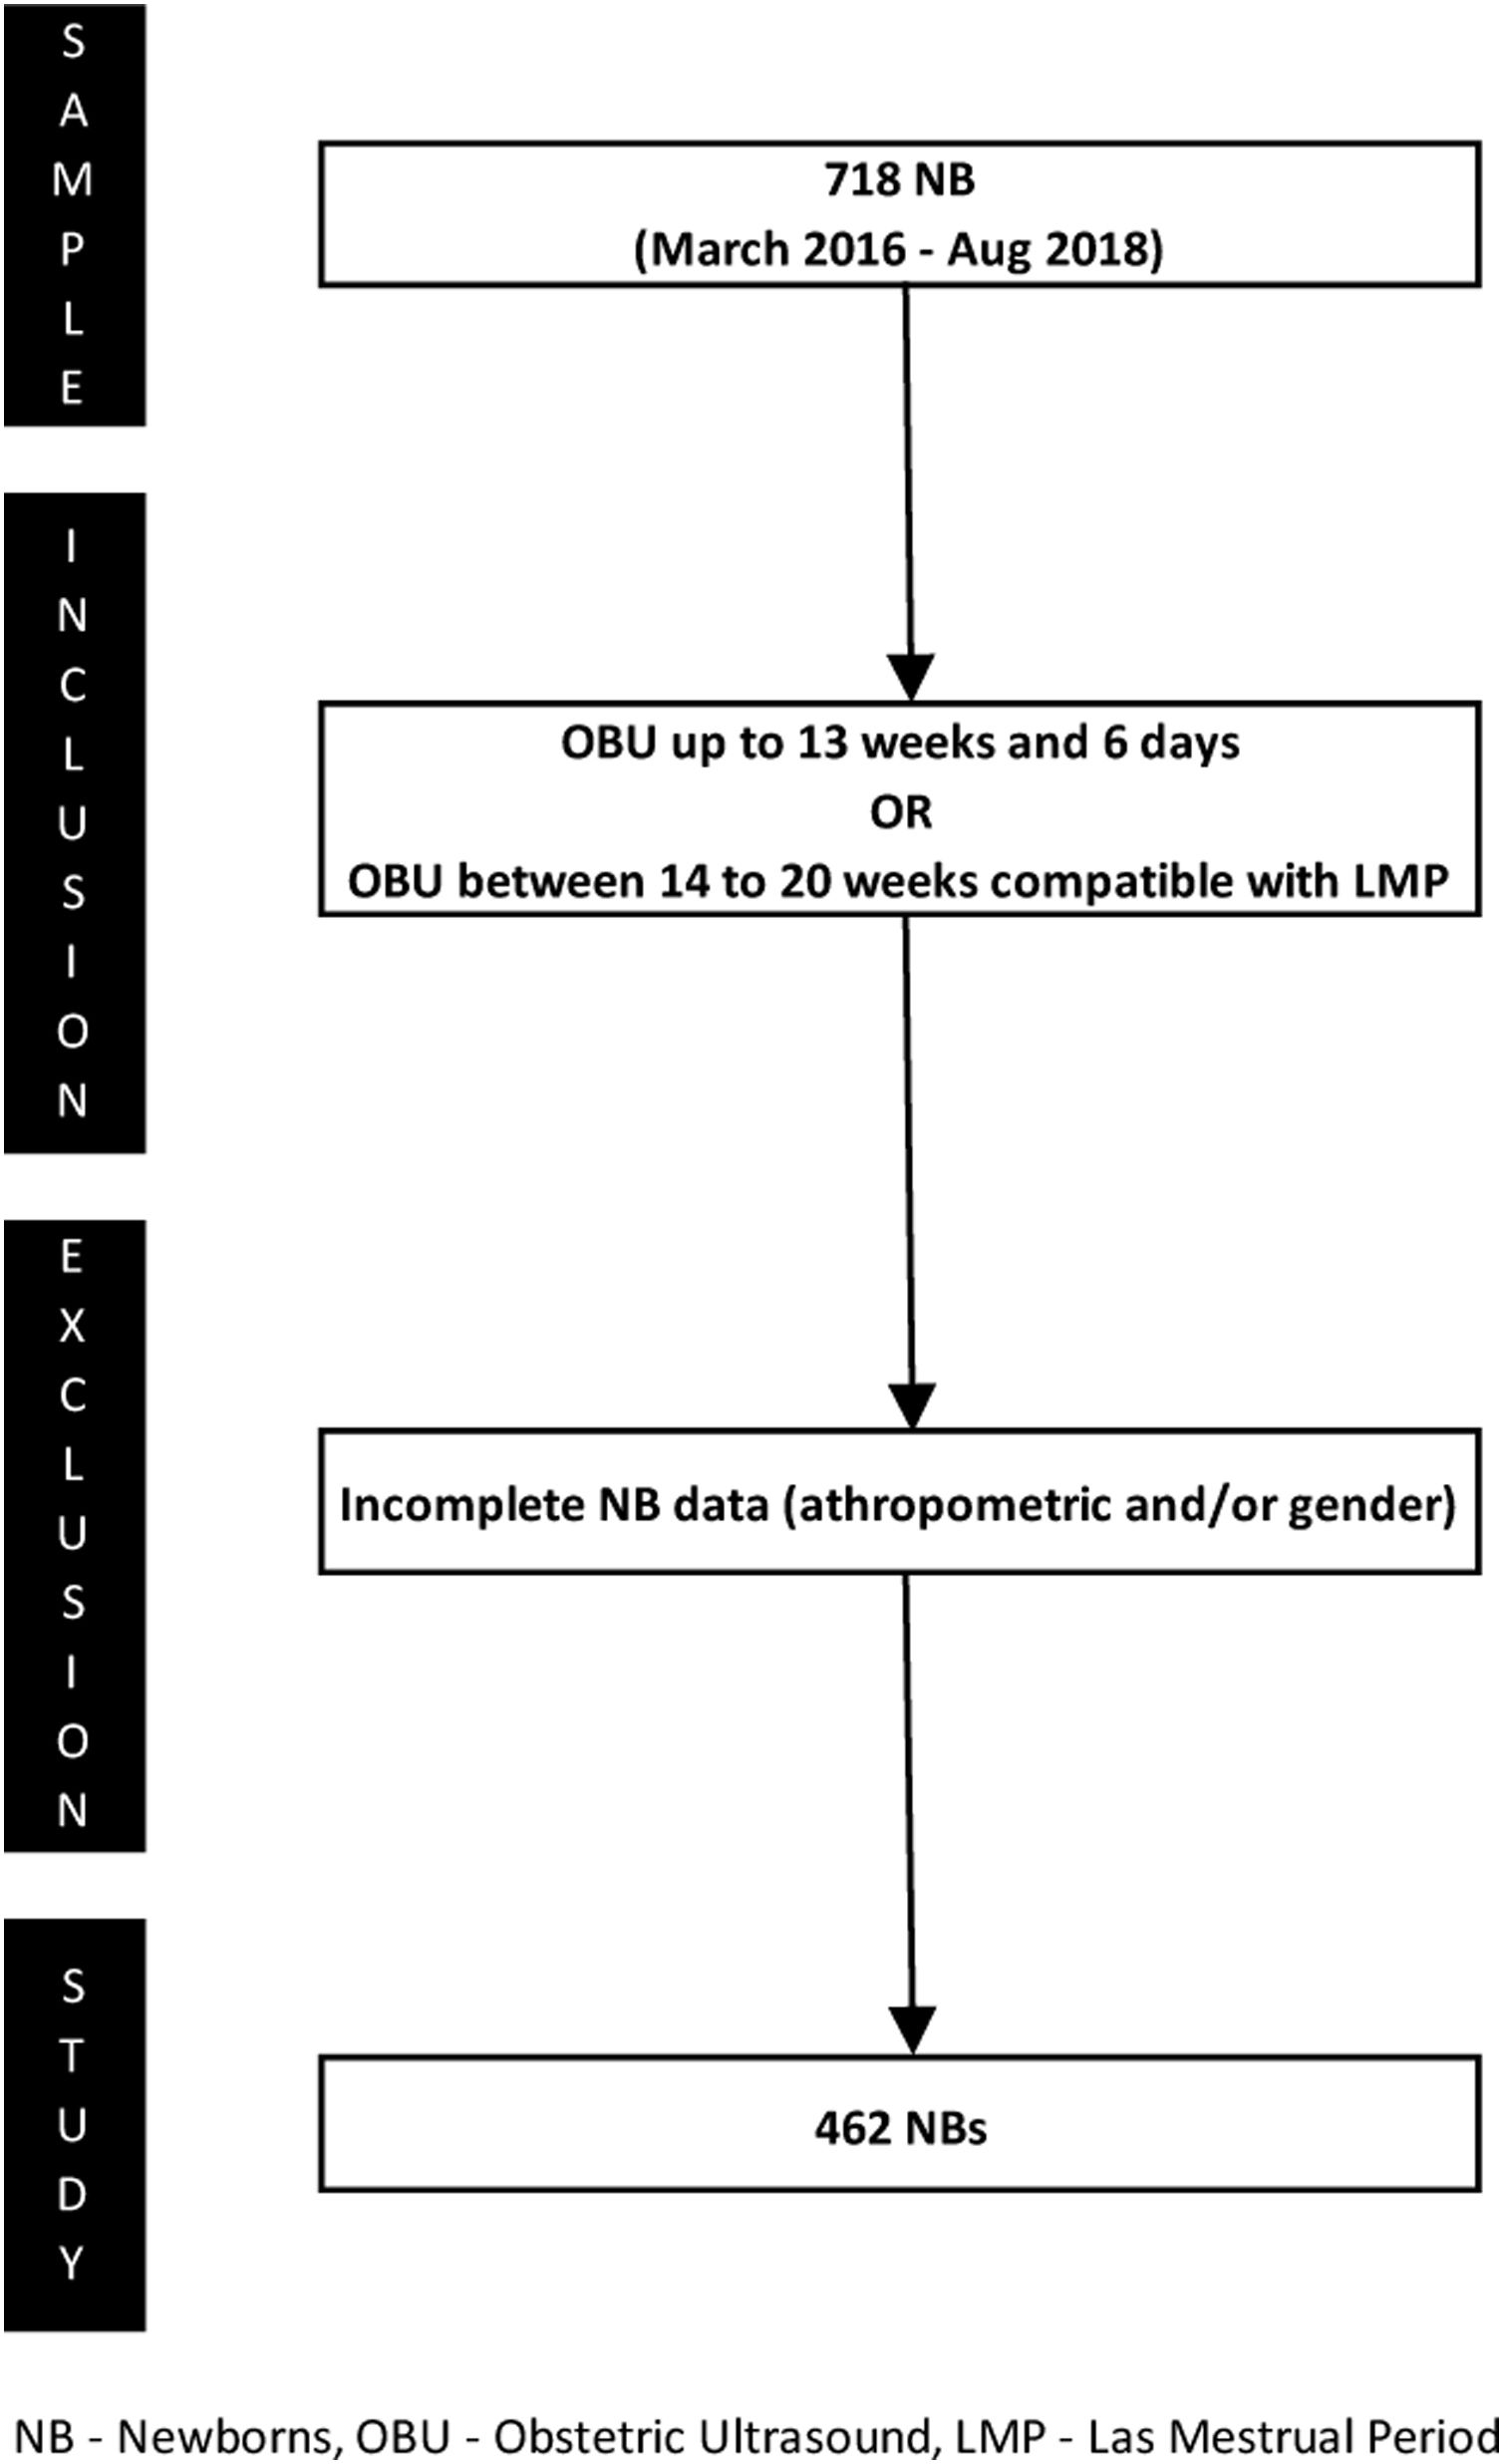
MethodsThis retrospective observational cross-sectional study was performed using data obtained from the Jundiaí Zika Cohort study, which was previously published.9 This is a maternal-infant cohort, with patients both positive and negative for Zika virus. Most of these study patients were negative for Zika virus. All live newborn participants were born in the region of Jundiaí and followed at the Hospital Universitário da Faculdade de Medicina de Jundiaí (HUJ) in the city of Jundiaí, São Paulo, Brazil, from March 2016 to August 2018.
The inclusion criteria were: (1) gestational age ≤13 weeks and 6 days determined by obstetric ultrasound in the first trimester, or (2) gestational age between 14–20 weeks and a difference <1 week between the estimates based on the date of the last menstrual period and ultrasound examination. These criteria were based on guidelines from the Committee on Obstetric Practice of the American College of Obstetricians and Gynecologists (ACOG) and the Brazilian Pediatrics Society (SBP) to increase accuracy, since gestational age is a dependent variable of the curves used in this study.10,11 Newborns with incomplete anthropometric and/or sex data were excluded from the study. Fig. 1 shows the process of patient selection.
Ethical considerations
The study was approved by the Ethics Committee of the Jundiaí School of Medicine (CAAE 53248616.2.0000.5412; legal opinion number 1.446.577). Research participation was only accepted after mothers or legal guardians provided written informed consent.
Data collectionDuring the cohort study period, maternal data on general health and pregnancy were collected directly from the mothers. The neonatology team (composed of pediatricians and neonatologists) underwent specific training on accurate anthropometric measurement offered by the JZC group. At birth, all newborns underwent a complete physical examination, weight determination on a digital scale, length measurement with a stainless steel anthropometer, and HC measurement with a non-elastic tape measure (presented in centimeters and millimeters) following the guidelines by the Brazilian Ministry of Health (MoH) and the Brazilian Pediatrics Society.
Peripheral blood, saliva, and urine samples from pregnant women and babies were collected, transported at 2–6°C for a maximum of 5hours, and stored at −80°C. Serum samples were stored after collection by centrifugation at −20°C.
Detection of IgM and IgG antibodies for Dengue virus, Chikungunya virus, Parvovirus B19 virus, STORCH, and ZIVK was performed using a commercial ELISA kit (Euroimmun™, Euroimmun, Lubeck, Germany) following the manufacturer’s recommendations. The ELISA utilized to detect viral antibodies did not completely eliminate the possibility of cross-reactivity between the three arboviruses. The detection of Dengue virus, ZIKV, and Chikungunya virus by real-time quantitative polymerase chain reaction (RT-qPCR) in blood, saliva, and urine utilized a published protocol.12
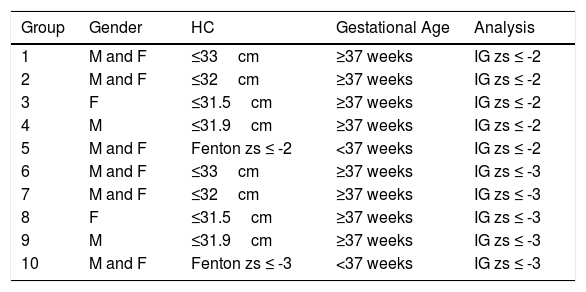
HC was classified by the z-score according to the Fenton curves for preterm newborns and IG for all term babies. Microcephaly was diagnosed when the z-score was equal to or below two standard deviations of the expected mean.13,14 Additionally, in cases of microcephaly, the difference in the weight and HC z-scores was calculated for proportionality assessment, according to Noyola et al.,15,16 who found that in infants with congenital cytomegalovirus infection, a difference ≥2 was associated with adverse neurodevelopmental outcomes. Microcephalic newborns underwent transfontanellar ultrasound and/or non-contrast-enhanced computed tomography, and the results were verified by a team of radiologists. Newborns were then divided into 10 groups for comparisons based on HC, IG z-scores, and sex (Table 1), according to the different cutoff points established by the Brazilian MoH to simulate the different situations during the ZIKV epidemic.
Division of the analyzed groups.
| Group | Gender | HC | Gestational Age | Analysis |
|---|---|---|---|---|
| 1 | M and F | ≤33cm | ≥37 weeks | IG zs ≤ -2 |
| 2 | M and F | ≤32cm | ≥37 weeks | IG zs ≤ -2 |
| 3 | F | ≤31.5cm | ≥37 weeks | IG zs ≤ -2 |
| 4 | M | ≤31.9cm | ≥37 weeks | IG zs ≤ -2 |
| 5 | M and F | Fenton zs ≤ -2 | <37 weeks | IG zs ≤ -2 |
| 6 | M and F | ≤33cm | ≥37 weeks | IG zs ≤ -3 |
| 7 | M and F | ≤32cm | ≥37 weeks | IG zs ≤ -3 |
| 8 | F | ≤31.5cm | ≥37 weeks | IG zs ≤ -3 |
| 9 | M | ≤31.9cm | ≥37 weeks | IG zs ≤ -3 |
| 10 | M and F | Fenton zs ≤ -3 | <37 weeks | IG zs ≤ -3 |
M, male; F, female; HC, head circumference; IG, INTERGROWTH-21st; zs, z score.
Statistical analyses were performed using the 12.7 version of the SPSS software (SPSS™ South America; SPSS Inc., Chicago, IL). Cutoff points were determined using receiver operating characteristic curves, finding the most appropriate balance between the sensitivity and specificity of the indicators and considering the Youden index. In addition, the Kappa index was calculated to describe the agreement between the diagnostic methods for microcephaly.
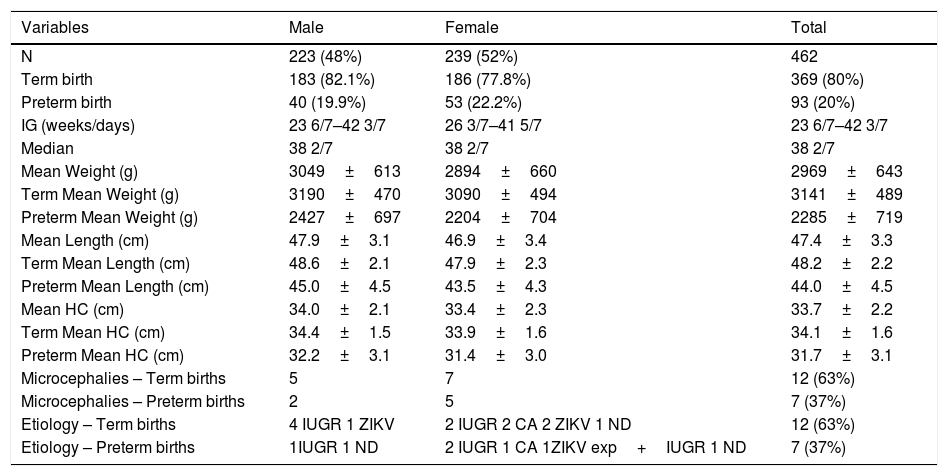
ResultsTable 2 shows the characteristics of the study population.
Characteristics of the study population, n=462.
| Variables | Male | Female | Total |
|---|---|---|---|
| N | 223 (48%) | 239 (52%) | 462 |
| Term birth | 183 (82.1%) | 186 (77.8%) | 369 (80%) |
| Preterm birth | 40 (19.9%) | 53 (22.2%) | 93 (20%) |
| IG (weeks/days) | 23 6/7–42 3/7 | 26 3/7–41 5/7 | 23 6/7–42 3/7 |
| Median | 38 2/7 | 38 2/7 | 38 2/7 |
| Mean Weight (g) | 3049±613 | 2894±660 | 2969±643 |
| Term Mean Weight (g) | 3190±470 | 3090±494 | 3141±489 |
| Preterm Mean Weight (g) | 2427±697 | 2204±704 | 2285±719 |
| Mean Length (cm) | 47.9±3.1 | 46.9±3.4 | 47.4±3.3 |
| Term Mean Length (cm) | 48.6±2.1 | 47.9±2.3 | 48.2±2.2 |
| Preterm Mean Length (cm) | 45.0±4.5 | 43.5±4.3 | 44.0±4.5 |
| Mean HC (cm) | 34.0±2.1 | 33.4±2.3 | 33.7±2.2 |
| Term Mean HC (cm) | 34.4±1.5 | 33.9±1.6 | 34.1±1.6 |
| Preterm Mean HC (cm) | 32.2±3.1 | 31.4±3.0 | 31.7±3.1 |
| Microcephalies – Term births | 5 | 7 | 12 (63%) |
| Microcephalies – Preterm births | 2 | 5 | 7 (37%) |
| Etiology – Term births | 4 IUGR 1 ZIKV | 2 IUGR 2 CA 2 ZIKV 1 ND | 12 (63%) |
| Etiology – Preterm births | 1IUGR 1 ND | 2 IUGR 1 CA 1ZIKV exp+IUGR 1 ND | 7 (37%) |
N, number of cases; g, grams; cm, centimeters; HC, head circumference; CA, congenital anomalies; IUGR, intrauterine growth restriction; ZIKV, Zika virus; ZIKV exp, Zika virus exposition.
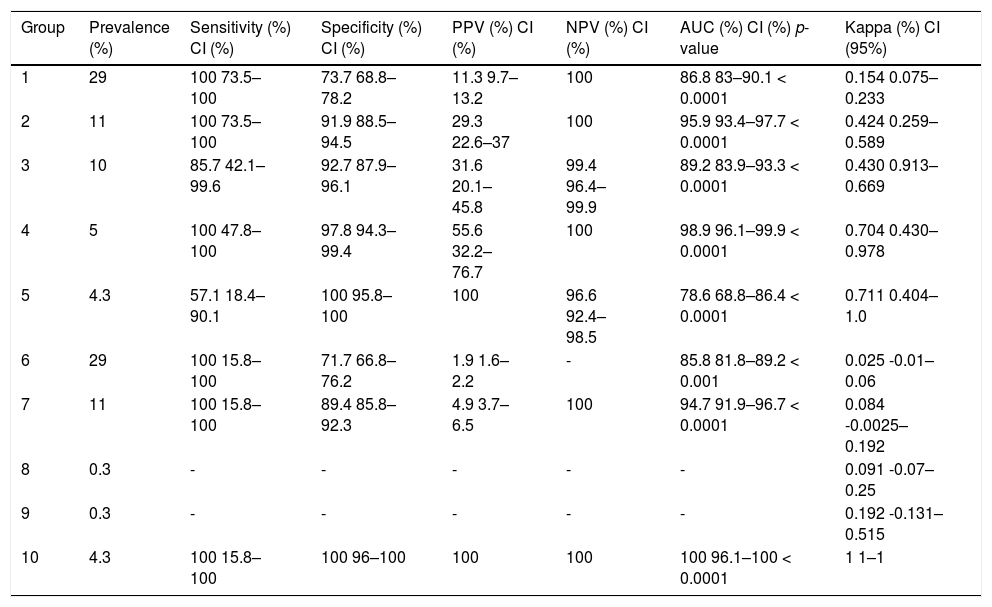
The prevalence of microcephaly, calculated according to the established HC cutoff points, was 4.1%. This translated to 3.2% for term births and 4.3% for babies delivered preterm. The results for microcephaly prevalence in each group, as well as the comparison between the HC cutoff points and standard IG curve, are shown in Table 3. Groups 8 and 9 had only one case each, which ruled out statistical analysis. In the remaining groups, the percentage varied from 4.3–29%, specificity varied from 71.7–100%, and sensitivity ranged from 57.1–100%.
Comparisons between the cutoff points and reference curve (IG).
| Group | Prevalence (%) | Sensitivity (%) CI (%) | Specificity (%) CI (%) | PPV (%) CI (%) | NPV (%) CI (%) | AUC (%) CI (%) p-value | Kappa (%) CI (95%) |
|---|---|---|---|---|---|---|---|
| 1 | 29 | 100 73.5–100 | 73.7 68.8–78.2 | 11.3 9.7–13.2 | 100 | 86.8 83–90.1 < 0.0001 | 0.154 0.075–0.233 |
| 2 | 11 | 100 73.5–100 | 91.9 88.5–94.5 | 29.3 22.6–37 | 100 | 95.9 93.4–97.7 < 0.0001 | 0.424 0.259–0.589 |
| 3 | 10 | 85.7 42.1–99.6 | 92.7 87.9–96.1 | 31.6 20.1–45.8 | 99.4 96.4–99.9 | 89.2 83.9–93.3 < 0.0001 | 0.430 0.913–0.669 |
| 4 | 5 | 100 47.8–100 | 97.8 94.3–99.4 | 55.6 32.2–76.7 | 100 | 98.9 96.1–99.9 < 0.0001 | 0.704 0.430–0.978 |
| 5 | 4.3 | 57.1 18.4–90.1 | 100 95.8–100 | 100 | 96.6 92.4–98.5 | 78.6 68.8–86.4 < 0.0001 | 0.711 0.404–1.0 |
| 6 | 29 | 100 15.8–100 | 71.7 66.8–76.2 | 1.9 1.6–2.2 | - | 85.8 81.8–89.2 < 0.001 | 0.025 -0.01–0.06 |
| 7 | 11 | 100 15.8–100 | 89.4 85.8–92.3 | 4.9 3.7–6.5 | 100 | 94.7 91.9–96.7 < 0.0001 | 0.084 -0.0025–0.192 |
| 8 | 0.3 | - | - | - | - | - | 0.091 -0.07–0.25 |
| 9 | 0.3 | - | - | - | - | - | 0.192 -0.131–0.515 |
| 10 | 4.3 | 100 15.8–100 | 100 96–100 | 100 | 100 | 100 96.1–100 < 0.0001 | 1 1–1 |
CI, confidence interval; PPV, positive predictive value; NPV, negative predictive value; AUC, area under the curve.
Utilizing a cutoff value of 33cm resulted in increased reporting of suspected microcephaly cases. We identified 106 babies with an HC≤33cm compared to 12 cases when using the reference standard. Therefore, 84 cases (79.2%) were presumptive false positives. When the cutoff was subsequently changed to 32cm, 41 babies (38.7%) were defined as having microcephaly, and of them, only 12 were true positives. The accuracy for detecting infants who were truly positive for microcephaly increased further when different cutoffs were used for each sex. It is also worth noting that as the groups were stratified, the number of cases sampled decreased, which reduced the statistical power of the tests performed. The utilization of the World Health Organization (WHO) curve resulted in a further increase in specificity. In addition, it is noteworthy that for male babies the accuracy in detecting those who were indeed positive for microcephaly was very high (100% sensitivity and 98% specificity) in relation to the standard curve (IG).
From the 19 cases of microcephaly, only 16 were available for analysis due to the loss of three cases to follow-up. In terms of etiology (Table 2), there were three (15.8%) positive cases for ZIKV, three cases (15.8%) with other congenital anomalies (one case each of trisomy 21, band heterotopia, and an unknown congenital syndrome still under diagnostic investigation), and nine cases (47.4%) of intrauterine growth restriction with no other determined cause. Lastly, there was one case (5.2%) of a twin born to a ZIKV-positive mother who had microcephaly and intrauterine growth restriction and tested negative for ZIKV at birth. All cases were negative for Dengue virus, Chikungunya virus, Parvovirus B19, and STORCH. Of the three microcephalic newborns with ZIKV infection at birth, two were positive by PCR in urine and the third was positive for IgG antibodies to ZIKV, but negative by PCR. One PCR-positive newborn, delivered at term, had a z-score difference of 0.82 between HC and weight, with no additional findings on examination.
The baby went on to have HC catch-up growth and normal neurodevelopment. The other PCR-positive baby had an imaging examination that showed lissencephaly, ventriculomegaly, and agenesis of the corpus callosum, as well as clinical arthrogryposis and dysphagia. The z-score difference between HC and weight was 3.21. The ZIKV IgG-positive newborn had altered visual acuity, without any other clinical alterations, and the z-score difference between HC and weight was not significant at birth but increased to 4.10 during follow-up (increased over time).
DiscussionIn this study, the prevalence of microcephaly was 4.1%. In the literature, the reported prevalence of microcephaly varies widely.
The Latin American Collaborative Study of Congenital Malformations (ECLAMC) group conducted a study on microcephaly from 2005 to 2014, including 10 Latin American countries (including Brazil) before the ZIKV epidemic, which considered microcephaly as an HC less than or equal to three standard deviations below the reference according to the IG curve. During this period, the prevalence of microcephaly was 4.4 per 10,000 live births (5.4 cases per 10,000 live births in Brazil).5
Other studies utilizing the same diagnostic criteria as the present study have also been reported. In the United States, one population-based survey conducted from 2009 to 2013 reported 9,678 cases of microcephaly with a prevalence of 8.7 cases per 10,000 live births, and 95% of these cases had a definite diagnosis of microcephaly.17
A Brazilian study using population-based data showed differences in the prevalence of microcephaly between the cities of São Luis (state of Maranhão, Northeast region of Brazil; 3.5%) and Ribeirão Preto (state of São Paulo, Southeast region of Brazil; 2.5%) in 2010.6
During the ZIKV epidemic, a study from the SINASC (“Sistema de Informações sobre Nascidos Vivos” – Information System about Livebirths) reported a nine-fold increase in the prevalence of microcephaly.18 Also during the same period in Southern Brazil, in a study with a large number of newborns, microcephaly was detected in 9.6 per 10,000 live births (from the initial sample, 60.8% were “non-confirmed” microcephaly).19
In Brazil, those differences in the prevalence of microcephaly may also have occurred because of the different cutoff points established by the Brazilian MoH from November 2015 to August 2016. During this period, four different cutoff points were considered (for term babies: 33cm in November 2015, 32cm in December 2015, WHO curve in March 2016, and IG curve in August 2016; for preterm babies: Fenton curve from November 2015 to March 2016, and then the IG curve).20–23
Considering the IG curve as the gold-standard and comparing the different cutoff points previously established by the MoH, we observed that the sensitivity was 100% but the specificity was low, especially with the first two cutoff points.
In addition to increasing sensitivity, the use of a more stringent cutoff point for reporting suspected cases of microcephaly has an economic impact by reducing the number of babies who require additional screening. In a country with low to moderate health resources such as Brazil, this cost impact must be seriously considered.
A strength of our study was the inclusion of newborns with a very well-defined gestational age, which increased accuracy since age was a dependent variable in the IG curve (the standard curve for this study).
The limitations of our study should also be mentioned. Firstly, most of our study sample were the offspring of high-risk pregnant women. Six of the nineteen microcephaly cases were from pregnant women with hypertension (chronic and/or gestational); one had diabetes; and another had thrombophilia. In these high-risk women, there is a known association between maternal pathology and intrauterine growth restriction.24,25 A second limitation was that 20% of our subjects were preterm newborns. This varies from the rates (7.5–11%) observed in countries such as France and the United States. This difference may have increased the number of small-for-gestational-age newborns in our study.26,27 Lastly, although newborns were tested for both viral antibodies and ZIKV by gene amplification, there remains a small possibility that a variable number of ZIKV-negative babies with microcephaly were actually infected with this virus. Inadequacies of the testing protocols have been previously reported.28
Regarding the etiology of microcephaly, it is noteworthy that although ZIKV infection was a primary motivator for recent microcephaly-based studies in Brazil, it was only one of several etiological factors identified. Thus, even in the periods of a particular outbreak, multiple etiologies must be considered. However, when HC was adjusted for weight (by the difference in z-score) a greater disproportion was noticed in two of the three cases with ZIKV infection. Microcephaly in relation to birth weight predicts adverse neurological outcomes in infants with congenital infection, and the disproportion between them suggests a higher risk of developmental disability.15,16
We conclude that the WHO cutoff point was almost as sensitive as the INTERGROWTH-21st curve to diagnose microcephaly in our study. Despite the ZIKV epidemic being the trigger of this study, it was not the main cause of microcephaly. For the majority of patients other causes were found, thus emphasizing the importance of screening and follow-up to facilitate individual approaches and to maximize their developmental potential.
FundingThis work and this manuscript were supported by the Fundação de Amparo à Pesquisa do Estado de São Paulo (SDP#grant 2016/08578-0), the Brazilian Ministry of Health (SDP#grant 861306/2017 and 861307/2017), and the London School of Hygiene and Tropical Medicine (SDP#grant PC0002/16).
Conflicts of interestThe authors declare no conflicts of interest.
The authors want to acknowledge all the patients that participated at this study, as well as all the volunteers, researchers, and professionals involved in this project. We acknowledge the researchers team, named “Cohort Zika Jundiaí Consortium”, which includes, in addition to the authors of this paper, Rita de Cássia Aguirre Dezena, Andrea Cristina Botelho Silva, Alexandra Siqueira Mello, Clovis Antonio Lopes Pinto, Dora Fix Ventura, Danielle Bruna Leal de Oliveira, Danilla Soares Tambalo, Diego da Silva Lima, Dirce Takako Fujiwara, Edison Luiz Durigon, Eduardo Roberto Bagne, Fernanda Guerra Velasco, Fernando Novo Arita, Francisco Del Moral Hernandez, Geovane Ribeiro dos Santos, Juliana Paula Gomes de Almeida, Karen Richter Camandulli, Lucas Pires de Castro, Luiz C P Baran, Márcia Borges Machado, Mayana Zatz, Maria Manoela Duarte Rodrigues, Maria de Fátima Valente Rizzo, Maria Amélia Farrão, Raquel Prestes, Sandra Helena A Bonom, Sergio Vranjac, Sérgio Rosemberg, Tathiana Ghisi de Souza, Viviane Cristina Martori Pandini, and Viviam Paschoarelli Paiva.
Sutdy conducted at Faculdade de Medicina de Jundiaí, Jundiaí, SP, Brazil.


