To develop and validate an instrument about nutritional knowledge and feeding practices to be used in children aged 7–11 years, based on the latest Brazilian Food Guide.
MethodsReview on the subject; instrument creation; content validity with two groups of judges: first, nutritionists and, after adjustments, a multidisciplinary group (content validity index [CVI]); FACE validity; reproducibility analysis (intraclass correlation coefficient [ICC], level of agreement, and kappa [k]); internal consistency analysis (Cronbach's alpha[α]) and construct validity (Kaiser–Meyer–Olkin and exploratory factorial analysis). The sample was calculated, considering at least ten subjects for each question of the questionnaire.
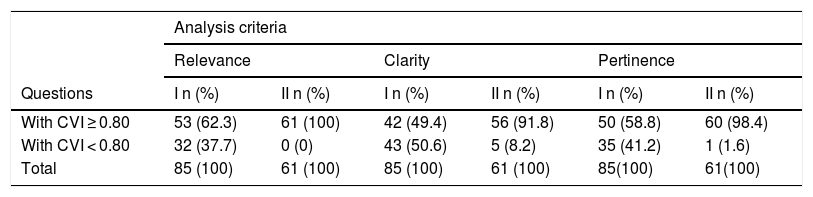
ResultsThere was a final sample of 453 children (53.6% girls), with a mean age of 9.45 years (SD = 1.44). The content validity showed a CVI ≥ 0.80 for relevance in 62.3% of the items for nutritionists’ group and 100% of the items for the multidisciplinary group, clarity (49.4%, 91.8%), and pertinence (58.8%, 98.4%), respectively. The test-retest showed a level of agreement of 84.3% and k = 0.740 for the Knowledge dimension and ICC = 0.754 for the Food Practices dimension. The internal consistency showed α = 0.589 for the Knowledge dimension and α = 0.618 for the Food Practices dimension. For the construct validity, Kaiser–Meyer–Olkin was 0.724 and exploratory factorial analysis showed a variance of 47.01 with varimax rotation and defined five factors for the Practices Dimension.
ConclusionThe Food Knowledge and Practices Questionnaire (Questionário de Conhecimento e Práticas Alimentares [QCPA]) instrument showed validity and reliability to assess nutritional knowledge and food practices in children aged 7–11 years.
Obesity is among the most important public health problems worldwide, with a 47.1% increase in the last 20 years in children.1 In Brazil, 15% of the pediatric population of Brazilian capitals has excess weight.2 Knowledge of the dietary habits in early childhood is essential for implementing dietary education programs, providing better health conditions, developing knowledge for healthy choices, and reducing negative health outcomes in the future.3
Studies have shown that knowledge in nutrition can influence food practices4,5 and, consequently, alter the nutritional status of children and adults.6 Others, however, have shown that the association between knowledge and eating behavior is weak7,8 and that isolated knowledge is not enough for children and adolescents to adopt healthy eating behaviors.
The findings show the importance of improving the instruments used to investigate children's eating habits. One of the main research difficulties in this area is the absence of validated instruments to measure knowledge and food practices that are adequate to the current guidelines for healthy eating in Brazil.9 Thus, the construction of validated instruments is fundamental for the consistency of the assessment of these variables.
No self-applicable instruments were found to assess knowledge and food practices in children, based on the current Food Guide for the Brazilian Population. Researchers develop their own study questionnaires10,11 when no there is adequate pre-existing instrument or when it cannot be found.10
The present study aims to construct and validate a questionnaire instrument to assess the knowledge of healthy eating habits and food practices in children aged 7–11 years, based on the principles of the current Food Guide for the Brazilian Population.12
MethodThis study was approved by the Research Ethics Committee of Fundação Universitária de Cardiologia de Porto Alegre, Brazil. Public schools were selected for convenience. The inclusion criteria were literate children aged 7–11 years. The exclusion criteria were children with cognitive or neurological deficits (reported by the parents or the school). All children who participated in the study had parental or guardian approval through an informed consent.
The validation process of this instrument followed the recommended steps:
1. Literature review: A non-systematic search was carried out in the PubMed, SciELO, and Google Scholar databases, for national and international studies using the terms ‘food and nutrition knowledge,’ ‘food education,’ ‘child eating behavior,’ ‘food habits and practices,’ ‘association between knowledge and eating behavior,’ ‘validation,’ ‘instrument validation,’ and ‘Food Guides for the Brazilian Population’. The search was performed with these terms alone and in combination.
2. Development of the instrument: Initially, the dimensions of the instrument (Knowledge and Food Practices) and the questions of each dimension were defined, as well as the layout of the instrument in the form of a questionnaire and the scope of the responses. The questions were based on the Ten Steps to Adequate and Healthy Eating of the Food Guide for the Brazilian Population,12 with the essential foods in the diet of children and the most consumed foods by the Brazilian population, according to results of the last Household Budget Survey (Pesquisa de Orçamentos Familiares [POF]).13 With these data, version I of the instrument was created.
3. Content validity: Two content analyses (I and II) were performed by two expert groups, called judges, presented sequentially to verify whether the proposed items and dimensions were pertinent and appropriate for their purpose. The initial version was evaluated by a first group of six nutrition experts (content validation I) and, after the analyses and suggested changes, version II was reviewed by a second multiprofessional group of five judges (nutritionists, an educator, and psychologists).
A link was made available for content analyses, (http://189.28.128.100/dab/docs/portaldab/publicacoes/guia_alimentar_populacao_brasileira.pdf) to provide access to the “Ten Steps to Adequate and Healthy Eating” and a “Judge Proof” document was sent with clarifications on the study and analysis completion instructions. For the analysis of the questions, the following variables were considered: clarity, pertinence, and relevance, with four-point Likert scale responses ranging from “irrelevant” to “extremely relevant,” the dimensionality, and overall assessment of the instrument.
4. FACE validity: The judges’ and the children’s suggestions (pilot test) for the content were considered, regarding whether the language and layout of the instrument were appropriate and accessible to the age group.
5. Pilot: The instrument was applied to 40 children (aged 7–9 years old) to identify difficulties in completing the instrument; to assess the children's behavior (tiredness, irritable mood, restlessness, etc.); to measure the application time; to identify the variations of comprehension in relation to the different ages; and to monitor elicited feelings, etc. The observations were recorded and then considered regarding their frequency, relevance, and type of difficulty, empirically. With these data, version IV was created, consisting of 39 questions, 20 for the Knowledge dimension and 19 for the Food Practices dimension.
6. Analysis of reliability/reproducibility: After further adjustments, the instrument went through the test-retest phase; it was applied twice to the same sample of 39 children, with a seven-day interval between the applications.
7. Analysis of reliability/internal consistency and construct validity: The final version of the instrument was applied to 453 children to verify its internal consistency and construct validity. The sample was calculated using the criterion “item/subject ratio”: ten subjects for each instrument item.14
Statistical analysisThe analyses were performed using the SPSS (IBM SPSS Statistics for Windows, Version 22.0. NY, USA) and the significance level was set at 5%. For the content analysis, the content validation index (CVI) was used: the number of answers “3” and “4” divided by the number of judges,15 with an approval rate of over 80%.16 For the reproducibility of the Food Practices dimension, the intraclass correlation coefficient (ICC) was used, with a value ≥0.717 being considered valid, whereas for the Knowledge dimension, the level of agreement was calculated using the following formula: number of participants who showed agreement, divided by the number of participants multiplied by100, with a value >0.80 being considered adequate15 and the kappa coefficient (k) showing an agreement >0.61.18,19 For the analysis of the internal consistency of the dimensions, Cronbach's alpha (α) was used, with values ≥0.60.14 For the construct validity, the exploratory factor analysis (EFA) in the Food Practices dimension was performed using varimax rotation, and the criterion of significance for the factor loadings in the items was established as values ≥0.3014 and to measure the adequacy of the sample, the Kaiser–Meyer–Olkin (KMO) criterion was used, considering consistent values ≥0.70.14 The Knowledge dimension was not submitted to the factor analysis because the response metrics showed categorical and nominal variables.14
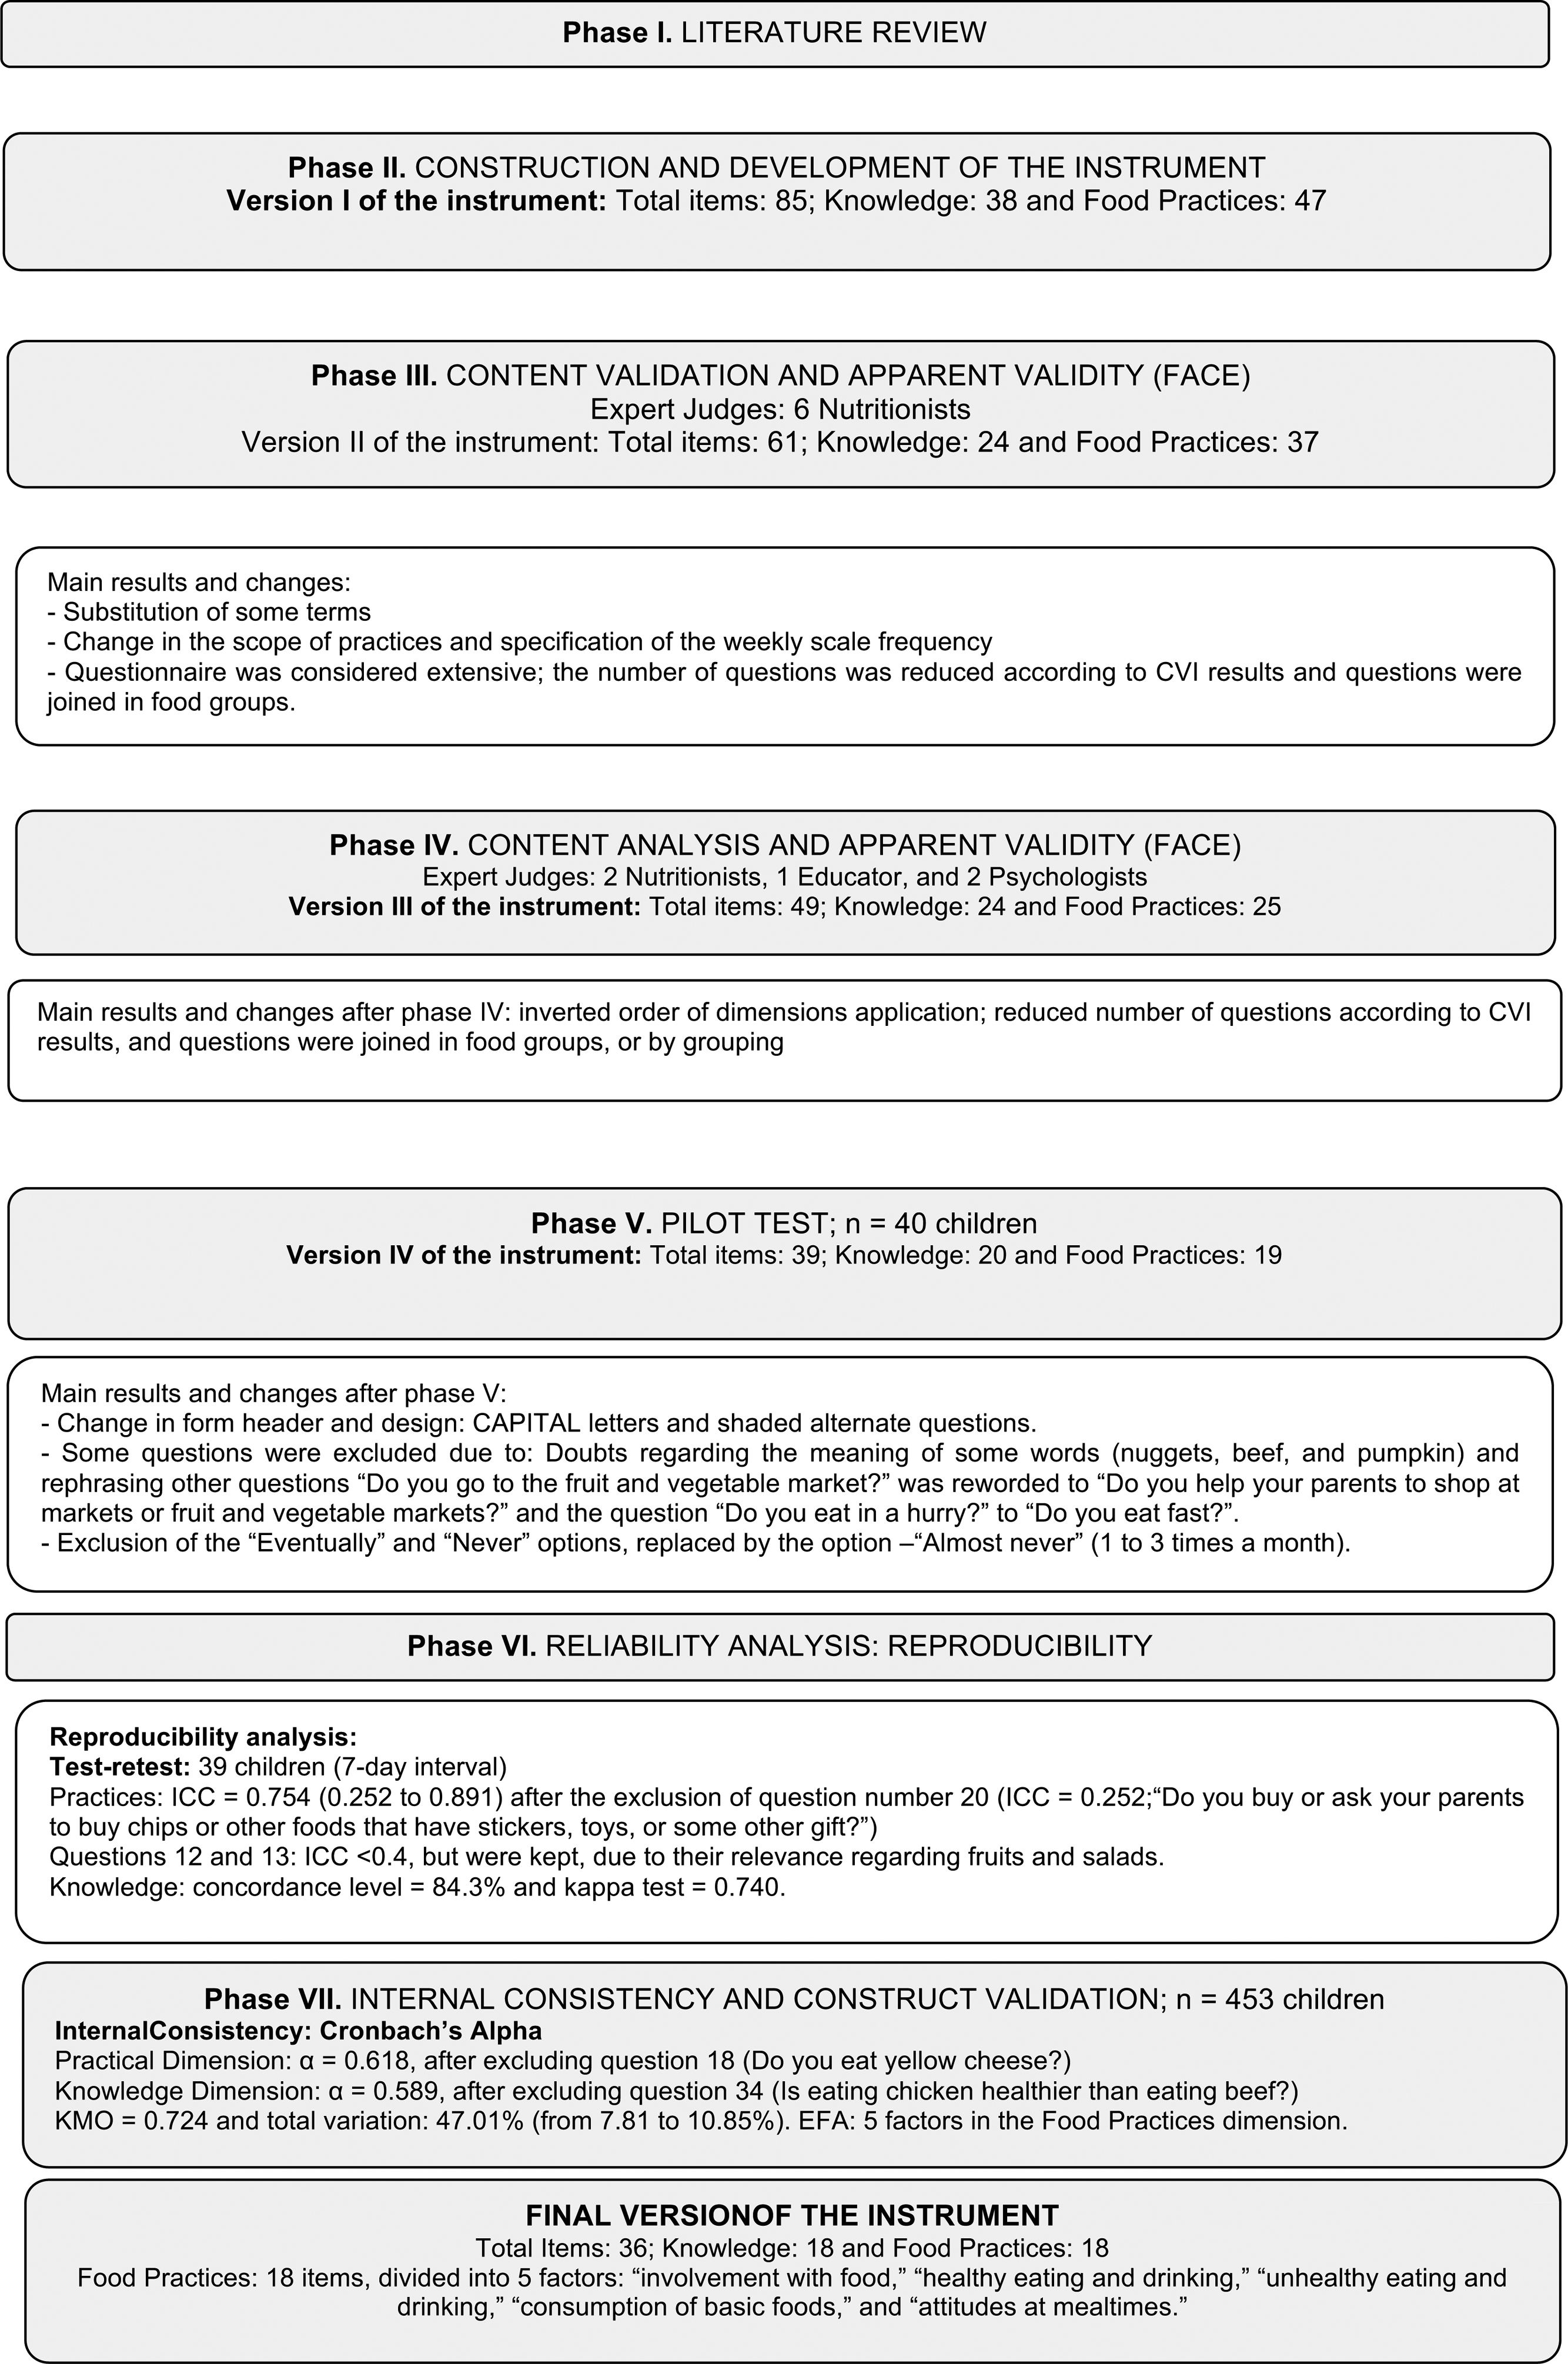
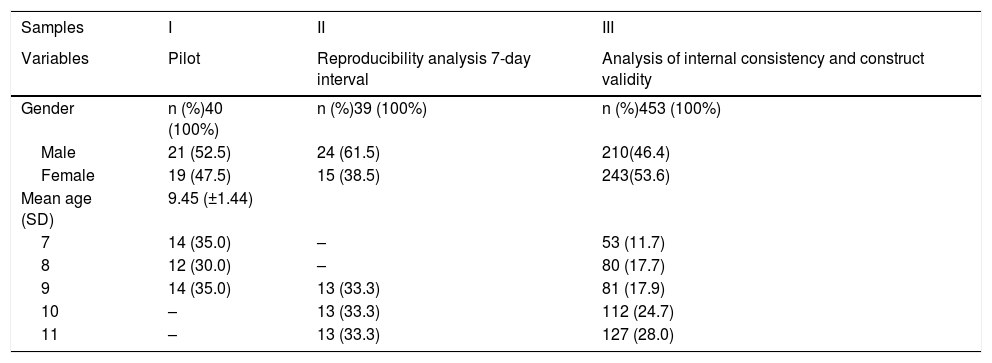
ResultsThe study involved ten schools and three distinct samples of children (Table 1). Fig. 1 represents the flowchart of the validation process phases with the main results, described below:
Sample characteristics.
| Samples | I | II | III |
|---|---|---|---|
| Variables | Pilot | Reproducibility analysis 7-day interval | Analysis of internal consistency and construct validity |
| Gender | n (%)40 (100%) | n (%)39 (100%) | n (%)453 (100%) |
| Male | 21 (52.5) | 24 (61.5) | 210(46.4) |
| Female | 19 (47.5) | 15 (38.5) | 243(53.6) |
| Mean age (SD) | 9.45 (±1.44) | ||
| 7 | 14 (35.0) | – | 53 (11.7) |
| 8 | 12 (30.0) | – | 80 (17.7) |
| 9 | 14 (35.0) | 13 (33.3) | 81 (17.9) |
| 10 | – | 13 (33.3) | 112 (24.7) |
| 11 | – | 13 (33.3) | 127 (28.0) |

The initial version had 85 questions (38 for the Knowledge dimension and 47 for the Food Practices dimension). For each Knowledge question (K) there was at least one corresponding Practice question (P), such as: “Is it healthy to eat fruits?” and “Do you eat fruits? (Banana, Apple, Orange, Papaya, or others).”
Regarding the answers, there were three alternatives in the Knowledge dimension: “Yes,” “No,” and “I don't know.” In the Food Practices dimension, the responses were presented on a Likert scale with four options: “Every day,” “Almost every day,” “Every now and then,” and “Never.”
Content and FACE validationVersion I: 100% of the judges, who were nutrition experts, agreed on the appropriateness of the questions in these dimensions. Items with CVI ≤ 0.80 were reviewed or eliminated. The words “It's healthy” and “It's good for your health” were replaced by “Helps with growth" or “It’s good for the body,” as the former could induce the response. Regarding the scope of answers from the Knowledge and Food Practices dimensions, 83.3% and 50% of the judges, respectively, considered that the alternatives were adequate. In the Food Practices dimension, each point on the scale was standardized with specific frequencies (number of days) so that the children could measure their food practices, since “Almost every day” might not represent the same frequency among the children and might not be differentiated from another point on the scale, such as “Every now and then.”
Version I was considered extensive. Thus, the questions were reformulated according to the criteria of food groups, such as the ultraprocessed food or sweets, with the understanding that it would not matter which food the children consumed, but whether they were eating some type of that food. After the considerations, the second version of the instrument consisted of 61 questions, 24 in the Knowledge and 37 in Food Practices dimensions.
Version II: A second group of judges with professionals from different areas performed a new analysis. In this new assessment, the order of application of the dimensions was changed, with the Food Practices dimension being presented before the Knowledge dimension, to avoid influencing the children's responses to indicate they ate something healthy after identifying it in the Knowledge questions. The third version of the instrument had 49 questions, 25 in the Food Practice dimension and 24 in the Knowledge dimension (Table 2).
Content validation results from the two groups of judges.
| Analysis criteria | ||||||
|---|---|---|---|---|---|---|
| Relevance | Clarity | Pertinence | ||||
| Questions | I n (%) | II n (%) | I n (%) | II n (%) | I n (%) | II n (%) |
| With CVI ≥ 0.80 | 53 (62.3) | 61 (100) | 42 (49.4) | 56 (91.8) | 50 (58.8) | 60 (98.4) |
| With CVI < 0.80 | 32 (37.7) | 0 (0) | 43 (50.6) | 5 (8.2) | 35 (41.2) | 1 (1.6) |
| Total | 85 (100) | 61 (100) | 85 (100) | 61 (100) | 85(100) | 61(100) |
CVI, content validation index; I, nutritionist judge group; II, multidisciplinary judge group.
The time to fill out the instrument ranged from 15−30 min, considered acceptable. The children showed no tiredness or irritability when answering it. Regarding the scope of the answers, there were doubts regarding the meaning of “Eventually.” Thus, it was decided to exclude two options: “Eventually” and “Never” and replace them with “Almost Never.” The layout was modified: capitalization and font size enlargement were used to make it easier for newly literate children to read them; gray-shaded questions were used to make it easier for the child to answer in the right line. Version IV had 49 questions, 25 in the Food Practice dimension and 24 in the Knowledge dimension.
Analysis of reliability: reproducibilityTwo test-retests were performed. In the first, with 58 children and retest interval between 10 and 18 days, the ICC results were below the expectations. It was understood that the time for instrument reapplication was not adequate and, to confirm this hypothesis (time/memory bias), a second test-retest was performed, with 39 children after a seven-day interval between one application and the other. The ICC for the Food Practice dimension was adequate (0.754 and p = 0.000, ranging from 0.252 to 0.891) after excluding item number 20, with ICC = 0.252 (“Do you buy or ask your parents to buy snacks or other foods that have stickers, toys, or a gift in the package?”). For the Knowledge dimension, the level of agreement was 84.3% and the kappa coefficient was k = 0.740. Questions 12 and 13 respectively: “Do you eat fruits (Banana or Apple or Orange or Melon or other fruits)?” and “Do you eat salads (lettuce or tomato or beets or carrots or other salads?” showed ICCs of 0.383 and 0.248, respectively.
Internal consistency and construct validationInternal consistency and construct validity were performed in 453 children. The Cronbach's alpha of the Food Practices dimension was α = 0.618, whereas for the Knowledge dimension, it was α = 0.589, after excluding one item from each dimension.
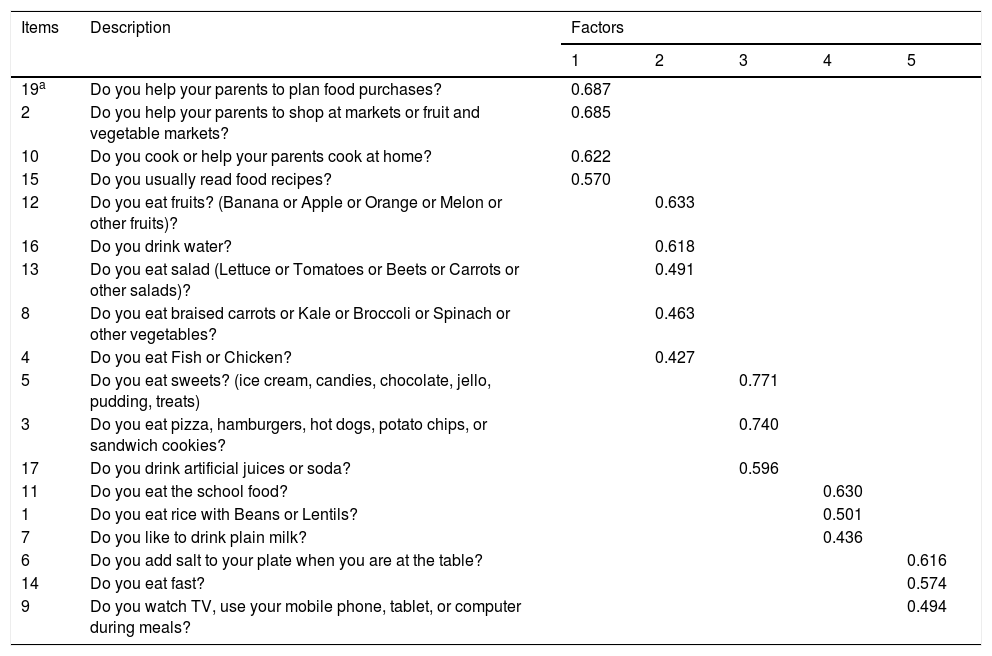
For the construct analysis of the Food Practices dimension, the EFA showed five factors (Table 3). The five factors explained 47.01% of the total variation, ranging from 7.81 to 10.85%. The KMO test showed a value of 0.724. In the end, the instrument had 36 questions, 18 in each dimension (Supplementary Material).
Exploratory factor analysis of the Food Practices dimension.
| Items | Description | Factors | ||||
|---|---|---|---|---|---|---|
| 1 | 2 | 3 | 4 | 5 | ||
| 19a | Do you help your parents to plan food purchases? | 0.687 | ||||
| 2 | Do you help your parents to shop at markets or fruit and vegetable markets? | 0.685 | ||||
| 10 | Do you cook or help your parents cook at home? | 0.622 | ||||
| 15 | Do you usually read food recipes? | 0.570 | ||||
| 12 | Do you eat fruits? (Banana or Apple or Orange or Melon or other fruits)? | 0.633 | ||||
| 16 | Do you drink water? | 0.618 | ||||
| 13 | Do you eat salad (Lettuce or Tomatoes or Beets or Carrots or other salads)? | 0.491 | ||||
| 8 | Do you eat braised carrots or Kale or Broccoli or Spinach or other vegetables? | 0.463 | ||||
| 4 | Do you eat Fish or Chicken? | 0.427 | ||||
| 5 | Do you eat sweets? (ice cream, candies, chocolate, jello, pudding, treats) | 0.771 | ||||
| 3 | Do you eat pizza, hamburgers, hot dogs, potato chips, or sandwich cookies? | 0.740 | ||||
| 17 | Do you drink artificial juices or soda? | 0.596 | ||||
| 11 | Do you eat the school food? | 0.630 | ||||
| 1 | Do you eat rice with Beans or Lentils? | 0.501 | ||||
| 7 | Do you like to drink plain milk? | 0.436 | ||||
| 6 | Do you add salt to your plate when you are at the table? | 0.616 | ||||
| 14 | Do you eat fast? | 0.574 | ||||
| 9 | Do you watch TV, use your mobile phone, tablet, or computer during meals? | 0.494 | ||||
Factor 1, involvement with food; Factor 2, healthy eating and drinking; Factor 3, unhealthy eating and drinking; Factor 4, consumption of basic foods; Factor 5, attitudes during the meal.
Each factor was defined operationally: a) “Involvement with food” (questions 2, 10, 15, 19): assesses how the child engages in, exercises, or shares eating-related activities; b) “Healthy eating and drinking” (questions 4, 8, 12, 13, 16): assesses how much healthy food the child consumes; c) “Unhealthy eating and drinking” (questions 3, 5, 17): assesses how much unhealthy food the child consumes; d) “Consumption of basic foods” (questions 1, 7, 11): assesses how much of the foods considered basic and essential for growth the child consumes and e) “Attitudes at mealtimes” (questions 6, 9, 14): assesses the child's attitudes when eating during a meal.
DiscussionThe population has reduced their consumption of healthy foods and increased their consumption of processed products rich in saturated fat, sodium, and refined carbohydrates,20 which is considered by the WHO as one of the main factors for obesity, diabetes, and other chronic diseases.21
In Brazil, between 2002 and 2008, the number of meals consumed away from home (30%), the purchase of ready-to-eat foods (37%), and the consumption of soft drinks (20%) and beer (88%) increased; whereas the acquisition of legumes (19.4%) and cereals (20.5%) decreased.13 These results showed the need to update the national food guidelines, and the Food Guide for the Brazilian Population was implemented in 2006 and later revised in 2014.
However, it is necessary to evaluate the population regarding their knowledge and food practices and, considering that there are no instruments to evaluate these variables in children, based on the Brazilian Food Guide, this study is important. With a similar proposal, Lera et al. validated an instrument to assess the knowledge, consumption, eating habits, and food practices, using questions about culinary skills and school spending, among 8- to 11-year-old students from public schools in Chile, based on the new Chilean Food Guides.22
Regarding the validation process of this instrument (QCPA), the two content analyses were crucial for the instrument to have a good acceptance by different health professionals. The CVI of the evaluated criteria (relevance, clarity, and pertinence) increased after the first analysis by nutritionist judges, indicating that an analysis by multidisciplinary judges offered better quality for the instrument, especially in the technical sense of the object to be evaluated. Lorenzato et al. validated the QCPA for the evaluation of parents' beliefs, attitudes, and practices regarding their children's diet and obesity with similar CVI rates.23 The creation of the “Judge Proof” document was fundamental to minimize subjectivity biases. As for the analysis of FACE, it offered the qualitative content of the instrument for the age group.
In the reproducibility analysis, the low ICC value (0.252) of question 20 was attributed to the size and complexity of the question. As for questions 12 and 13 (ICC ≤ 0.4), it was decided to keep these items, because the consumption of fruits and salads is crucial to evaluate healthy practices. It was understood that the questions having “or…or” food choices may have caused confusion in the children and may have been the likely reason for low ICC.
The seven-day interval used was adequate and provided an answer to our hypothesis regarding a possible memory or time bias. This interval accounted for weekly and weekend feeding variations and the ICC results for the Food Practice dimension items showed stability and accuracy of the scores. In the study by Mais et al., reproducibility analyses showed ICC values similar to those found in this study.24 In the Knowledge dimension, the results of the test-retest suggested that knowledge about healthy eating habits is internalized in the child and that, despite being of a more complex nature for age, daily life can be a source of learning. The Cronbach's alpha results for the Food Practicesdimension showed “substantial” internal consistency, according to the classification by Hair et al.,14 after excluding question 18. Regarding the Knowledge dimension, Cronbach's alpha showed a borderline value after the exclusion of question 34. This value was considered satisfactory, since the instrument was considered unprecedented for the age group. De Bourdeaudhuij et al. claimed that a possible cause for internal consistency values to be low is that some factors have few items, two or three.25
As for the construct validation, the KMO result showed that the sample was adequate and accepted the possibility of factoring of the data matrix.26 The EFA showed five factors in the Food Practices dimension, which ranged from three to five items. Although three-item factors are not ideal, it was decided to keep them, considering the thematic grouping relevant to the factor and adequate factor loading. The total variation of 47.01% showed the proportion of variance of items that the group of five factors was able to extract from the data set. According to Peterson, there is no cutoff point for what would be an acceptable level of variance; he reports that the data should be interpreted with caution.27 Hair et al. reported that the individual loading values are more important for the definition of variables than the total variation.14 The varimax rotation assumes that the extracted factors are independent from each other, i.e., they do not correlate with each other. All items reached a minimum factor loading of 0.30, showing that they were strong representatives of the factors.
Among the study limitations are: (1) broad age group, considering the literacy process and the differences in development among 7-year-old children in relation to older ones with higher levels of schooling. However, Pereira et al. stated that 7-to-8-year-olds have the ability to respond reliably, and 10-to-12-year-olds respond accurately;28 the present authors understand that for an instrument aimed at population-level assessment of eating behavior, the broad age range is important; (2) the variable children’s socioeconomic status was not stratified. However, the sample with students from public schools is understood as representative of the population sample, since there is a variation in the income and social condition of children in this context. Thus, as the instrument was designed to generalize results from a population, social-economic differences are important but not relevant; (3) the convenience selection of the sample may be another limitation, considering that the validity of the instrument was performed only with children from public schools and certain urban areas. The results could be different if also applied to children from private schools and with the inclusion of new regions.
In conclusion, the QCPA instrument showed validity, reliability, and internal consistency to assess knowledge and food practices in children aged 7–11 years old that attended public schools. The QCPA dimensions can be applied and/or analyzed alone, considering the research objectives and the application of the instrument in other contexts is suggested.
Conflicts of interestThe authors declare no conflicts of interest.
Funding SourcesFAPERGS (Fundac¸ão de Amparo à Pesquisa do Estado do Rio Grande do Sul)/CAPES (Coordenac¸ão de Aperfeic¸oamento de Pessoal de Nível Superior).
The following is Supplementary data to this article:


