Allergic sensitization is one of the key components for the development of allergies. Polysensitization seems to be related to the persistence and severity of allergic diseases. Furthermore, allergic sensitization has a predictive role in the development of allergies. The aim of this study was to characterize the pattern of sensitization of atopic patients treated at different pediatric allergy referral centers in Brazil.
MethodsA nation-wide transversal multicenter study collected data on patients attended in Brazil. Peripheral blood samples were collected to determine the serum levels of allergen-specific IgE. If allergen-specific IgE was higher than 0.1 kUA/L, the following specific components were quantified.
ResultsA total of 470 individuals were enrolled in the study. Mite sensitization was the most frequent kind in all participants. A high frequency of sensitization to furry animals and grasses featured in the respiratory allergies. Regarding components, there was a predominance of sensitization to Der p 1 and Der p 2. It has been verified that having a food allergy, atopic dermatitis, or multimorbidity are risk factors for the development of more severe allergic disease.
ConclusionStudies on the pattern of allergic sensitization to a specific population offer tools for the more effectual prevention, diagnosis, and treatment of allergic diseases. Sensitization to dust mites house was the most prevalent in the evaluated sample. High rates of sensitization to furry animals also stand out. Patients with food allergy, atopic dermatitis, or multimorbidity appear to be at greater risk for developing more severe allergic diseases.
Allergic sensitization is one of the key components for the development of allergies.1,2 With the advance of technology and the goal of developing precision medicine, the search for biological markers that can assist in the management of diseases is fundamental to a variety of medical fields and can contribute significantly to the efficiency of allergological clinical practice.3
Prospective studies have allowed for the mechanisms involved in the development of allergic disease to be examined more closely. Knowing this, monosensitized individuals should be analyzed differently than polysensitized individuals. Polysensitization seems to be associated with the persistence and severity of allergic diseases.4 Furthermore, allergic sensitization has a predictive role in the development of allergies.5 Individuals also need to be evaluated for having one or more allergic diseases. Allergic multimorbidity also seems to be a helpful tool for evaluating the severity and continuity of a patient’s allergic disease.4
Therefore, the objective of this study was to characterize the allergen sensitization of atopic patients treated at different pediatric allergy centers in Brazil, by measuring serum specific IgE for major allergens and their respective protein components (component resolved diagnosis, CRD), to relate the results with the patient’s medical history and further compare the results with that of asymptomatic children without a medical history of allergies.
MethodsThis was a cross-sectional, multicenter study across the country. The authors collected data from patients (convenience sampling) who were seen for treatment at 11 childhood and adolescence allergy treatment specialist centers in Brazil. The sample size was calculated according to the results of the first PROAL I study.6 An effective sample group of 433 children and adolescents was used to estimate the frequency of total allergic sensitization with a sampling error of 4.0%, a confidence level of 95%, and an estimated frequency of 73.0%.6 In order to compare allergic patients to asymptomatic patients, the previous study needed to evaluate the allergen sensitization percentage, which was prevalent and in similar magnitudes between allergic groups and asymptomatic groups. There was a 15.0% difference in allergic sensitization to cow’s milk between both groups, in a test with a significance level of 5% and a power of 95.0% using a comparison test of two proportions. Sample size calculations were performed using the PASS 2008 (Power Analysis and Sample Size System) – NCSS statistical software. The calculations defined a sample group of 360 patients with allergies and 73 asymptomatic participants (the control group), assuming a sensitization ratio of 20% and 5%, respectively. The sample was expanded by 8.5% to account for possible losses.
Participants (6 months to 18 years old) were selected during routine treatments between 2015−16 (all seasons). Each center was asked to include 40 patients with allergies and ten asymptomatic participants (Control [C] – the control participants had no allergy history and were asymptomatic). Allergies were divided into respiratory allergies (RA), such as allergic rhinitis or asthma,7,8 atopic dermatitis (AD),9 IgE-mediated food allergies (FA),10 and wheezing infants (WI; recurring episodes of wheezing in children up to two years old).11 Patients with an underlying disease that alters the antibody formation or who used immunomodulators were not considered for this study.
The parents of the participants signed the informed consent or the agreements when applicable. The Federal University of São Paulo Research Ethics Committee approved this study (No. 824.156).
Clinical information regarding sex, the severity of the principal disease, concomitant allergic diseases, family history of atopy, history of second-hand or in-utero exposure to tobacco smoking, having pets at home, and premature birth was obtained. Allergic diseases were classified by severity, according to the criteria of the Global Initiative for Asthma (GINA),7 Allergic Rhinitis and its Impact on Asthma (ARIA),6 and Scoring Atopic Dermatitis (SCORAD) for AD,8 and of the study by Boyce et al.12 for FA. Since ARIA classifies rhinitis, it was considered moderate if it did not require frequent antihistamines cycles.6
Peripheral blood samples were collected to determine the serum levels of allergen-specific IgE (sIgE; ImmunoCAP®; Thermo Fisher Scientific – Uppsala, Sweden) for Dermatophagoides pteronyssinus (Dp); Dermatophagoides farinae (Df); Blomia tropicalis (Bt); cat, horse, cow, and dog epithelium; grasses (Cynodon dactylon, Lolium perenne, Phleum pratense, Poa pratensis, Sorghum halepense, Paspalum notatum); fungi (Penicillium chrysogenum, Clad osporium herbarum, Aspergillus fumigatus, Alternaria alternata); Periplaneta americana; Ascaris lumbricoides; egg; cow’s milk (CM); fish; wheat; corn; peanut; soy; shrimp; cashew nut; and nuts (pecan, cashew nut, pistachio, walnut). Patients with sIgE higher than 0.1 kUA/L were considered sensitized. For these, the specific components were quantified as follows: Der p 1, Der p 2, Der p 10 (Dp); ovomucoid, ovalbumin, conalbumin (egg); alpha-lactalbumin, beta-lactoglobulin, casein, bovine serum albumin (CM); parvalbumin (fish); omega-5-gliadin, Tri a 14, gliadin (wheat); Ara h 1, Ara h 2, Ara h 3, Ara h 8, Ara h 9 (peanut); beta-conglycinin, glycinin, rGly m 4 (soy); and shrimp tropomyosin. Although controversial for some expert groups, the authors decided to consider 0.1 kUA/L as the cut-off because it resembled that found in studies with similar designs. The authors also performed calculations assuming a cut-off point of 0.35 kUA/L, and the results showed no significant difference.13
When patients had two or more groups of allergic diseases, they were classified as presenting multimorbidity.4,5 Concerning sensitization: monosensitization refers to the presence of sIgE in one or more mites or another single allergen; paucisensitization refers to the presence of one or more mites associated with another allergen or two non-mite allergens, and polysensitization infers the presence of one or more mite allergens added to two other allergens or at least three allergens unrelated to the mites.5
In the statistical analysis, this study utilized the geometric mean (GM) (exponentiation of the arithmetic mean of the log-transformed variables) of sIgE, with a 95% confidence interval. A comparison of log-transformed IgE levels (natural logarithm) was performed between the groups via an analysis of variance (ANOVA), after confirming the normal distribution of the data (Kolmogorov–Smirnov test). Alternatively, if there was no normal distribution, the non-parametric Kruskal–Wallis test was used. Multiple Duncan or Dunn-Bonferroni comparisons complemented both tests, maintaining the level of overall significance. A logistic regression model was used to evaluate the severity factors of the diseases jointly.
A significance level of 5% was utilized for each statistical test. Statistical analyses were conducted using IBM SPSS 20.0 (Chicago, Illinois, United States) and STATA 12 (StataCorp, 2001, Texas, United States).
ResultsA total of 470 individuals were enrolled in the study, distributed as follows: RA (n = 111); AD (n = 99); FA (n = 95); WI (n = 80); and C (n = 85). There were no significant differences between the number of participants and the distribution of sex in each group (47.7% boys). According to their medical histories, 127 children were diagnosed with a FA (only FA = 95 and AD + FA = 32), 92 to one type of food, and 35 to multiple types of food. The most common types of food reported were CM (n = 102), egg (n = 39), wheat (n = 7), nuts (n = 5), soy, peanuts, corn (n = 4), and shrimp (n = 2).
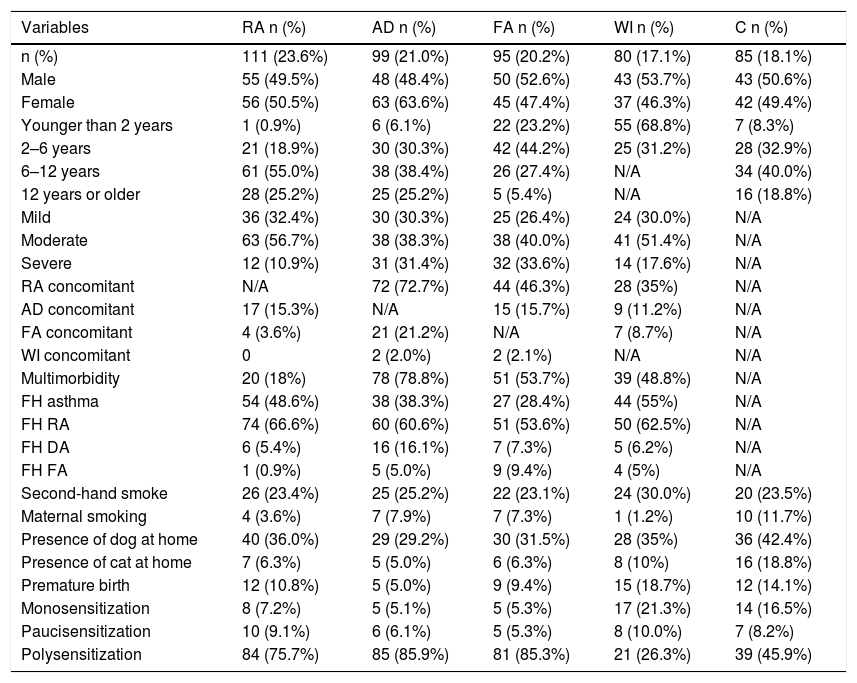
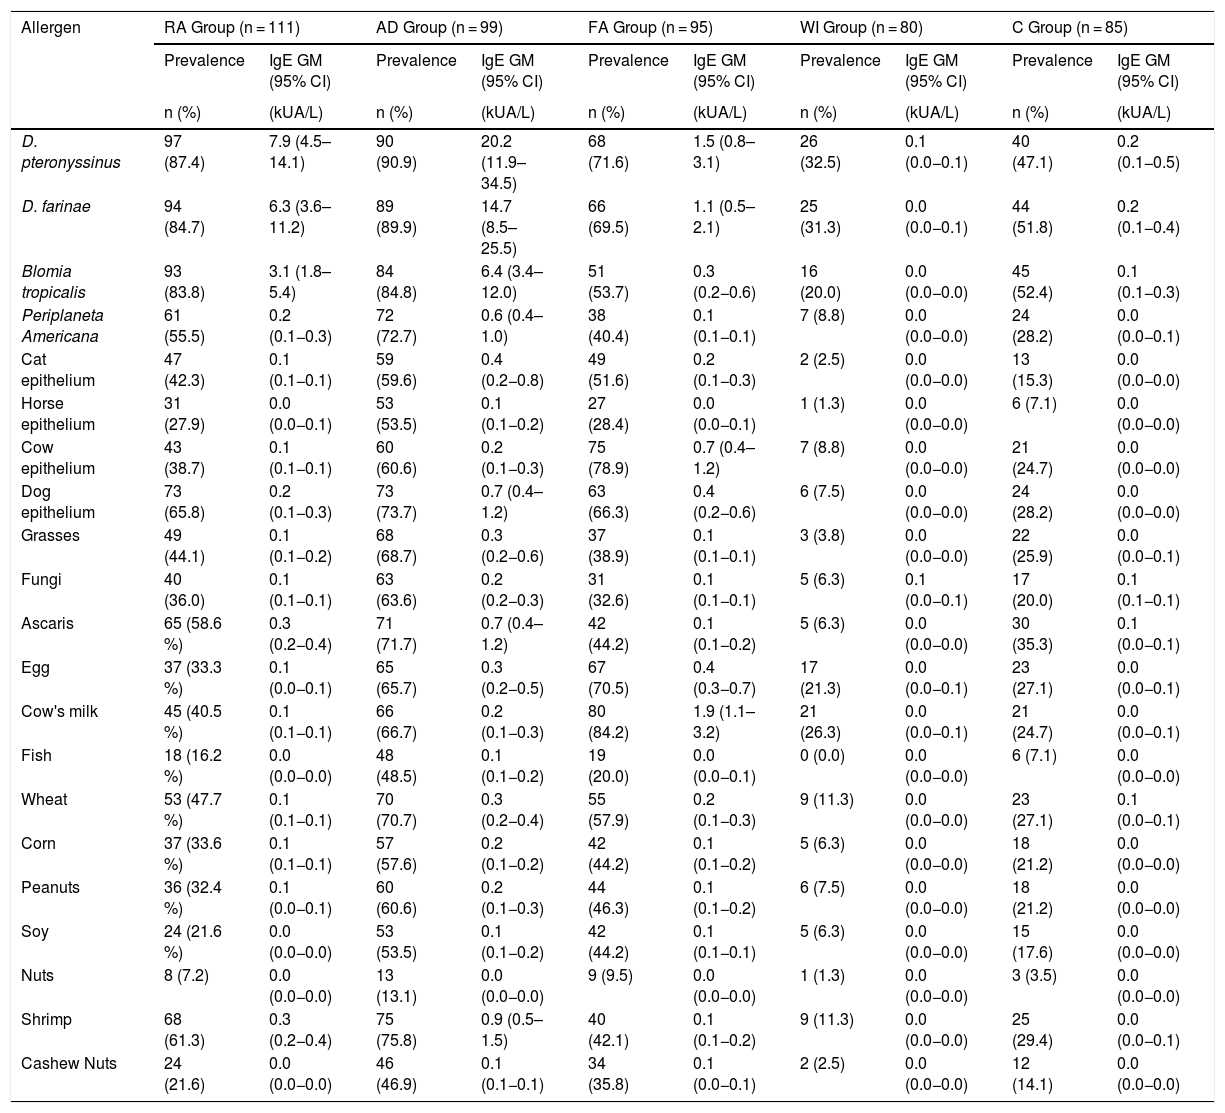
Table 1 shows the personal and clinical characteristics of the participants. The AD group had the highest multimorbidity (78.8%). A family history of rhinitis was the most prevalent trait in all groups. Having a dog in the home was the same for each group, while premature births were more common among the WI group. Of the 111 participants in the RA group, 101 had asthma or asthma and rhinitis. Table 2 describes the prevalence of sensitization and the sIgE GM, according to the disease group and sources of allergens measured. Mite sensitization was the most frequent kind in all groups. A high frequency of sensitization to dog epithelium (65.8%) and grasses (44.1%) was seen in the RA group.
Personal and clinical characteristics of the participants, according to the principal disease group (n = 470).
| Variables | RA n (%) | AD n (%) | FA n (%) | WI n (%) | C n (%) |
|---|---|---|---|---|---|
| n (%) | 111 (23.6%) | 99 (21.0%) | 95 (20.2%) | 80 (17.1%) | 85 (18.1%) |
| Male | 55 (49.5%) | 48 (48.4%) | 50 (52.6%) | 43 (53.7%) | 43 (50.6%) |
| Female | 56 (50.5%) | 63 (63.6%) | 45 (47.4%) | 37 (46.3%) | 42 (49.4%) |
| Younger than 2 years | 1 (0.9%) | 6 (6.1%) | 22 (23.2%) | 55 (68.8%) | 7 (8.3%) |
| 2–6 years | 21 (18.9%) | 30 (30.3%) | 42 (44.2%) | 25 (31.2%) | 28 (32.9%) |
| 6–12 years | 61 (55.0%) | 38 (38.4%) | 26 (27.4%) | N/A | 34 (40.0%) |
| 12 years or older | 28 (25.2%) | 25 (25.2%) | 5 (5.4%) | N/A | 16 (18.8%) |
| Mild | 36 (32.4%) | 30 (30.3%) | 25 (26.4%) | 24 (30.0%) | N/A |
| Moderate | 63 (56.7%) | 38 (38.3%) | 38 (40.0%) | 41 (51.4%) | N/A |
| Severe | 12 (10.9%) | 31 (31.4%) | 32 (33.6%) | 14 (17.6%) | N/A |
| RA concomitant | N/A | 72 (72.7%) | 44 (46.3%) | 28 (35%) | N/A |
| AD concomitant | 17 (15.3%) | N/A | 15 (15.7%) | 9 (11.2%) | N/A |
| FA concomitant | 4 (3.6%) | 21 (21.2%) | N/A | 7 (8.7%) | N/A |
| WI concomitant | 0 | 2 (2.0%) | 2 (2.1%) | N/A | N/A |
| Multimorbidity | 20 (18%) | 78 (78.8%) | 51 (53.7%) | 39 (48.8%) | N/A |
| FH asthma | 54 (48.6%) | 38 (38.3%) | 27 (28.4%) | 44 (55%) | N/A |
| FH RA | 74 (66.6%) | 60 (60.6%) | 51 (53.6%) | 50 (62.5%) | N/A |
| FH DA | 6 (5.4%) | 16 (16.1%) | 7 (7.3%) | 5 (6.2%) | N/A |
| FH FA | 1 (0.9%) | 5 (5.0%) | 9 (9.4%) | 4 (5%) | N/A |
| Second-hand smoke | 26 (23.4%) | 25 (25.2%) | 22 (23.1%) | 24 (30.0%) | 20 (23.5%) |
| Maternal smoking | 4 (3.6%) | 7 (7.9%) | 7 (7.3%) | 1 (1.2%) | 10 (11.7%) |
| Presence of dog at home | 40 (36.0%) | 29 (29.2%) | 30 (31.5%) | 28 (35%) | 36 (42.4%) |
| Presence of cat at home | 7 (6.3%) | 5 (5.0%) | 6 (6.3%) | 8 (10%) | 16 (18.8%) |
| Premature birth | 12 (10.8%) | 5 (5.0%) | 9 (9.4%) | 15 (18.7%) | 12 (14.1%) |
| Monosensitization | 8 (7.2%) | 5 (5.1%) | 5 (5.3%) | 17 (21.3%) | 14 (16.5%) |
| Paucisensitization | 10 (9.1%) | 6 (6.1%) | 5 (5.3%) | 8 (10.0%) | 7 (8.2%) |
| Polysensitization | 84 (75.7%) | 85 (85.9%) | 81 (85.3%) | 21 (26.3%) | 39 (45.9%) |
RA, respiratory allergy; AD, atopic dermatitis; FA, food allergy; WI, wheezing infants; C, controls; FH, family history of ɣ; N/A, not applicable.
Prevalence of sensitization (positive from sIgE > 0.1 kUA/L) and geometric mean (GM) of serum sIgE levels, according to groups of participants.
| Allergen | RA Group (n = 111) | AD Group (n = 99) | FA Group (n = 95) | WI Group (n = 80) | C Group (n = 85) | |||||
|---|---|---|---|---|---|---|---|---|---|---|
| Prevalence | IgE GM (95% CI) | Prevalence | IgE GM (95% CI) | Prevalence | IgE GM (95% CI) | Prevalence | IgE GM (95% CI) | Prevalence | IgE GM (95% CI) | |
| n (%) | (kUA/L) | n (%) | (kUA/L) | n (%) | (kUA/L) | n (%) | (kUA/L) | n (%) | (kUA/L) | |
| D. pteronyssinus | 97 (87.4) | 7.9 (4.5–14.1) | 90 (90.9) | 20.2 (11.9–34.5) | 68 (71.6) | 1.5 (0.8–3.1) | 26 (32.5) | 0.1 (0.0−0.1) | 40 (47.1) | 0.2 (0.1−0.5) |
| D. farinae | 94 (84.7) | 6.3 (3.6–11.2) | 89 (89.9) | 14.7 (8.5–25.5) | 66 (69.5) | 1.1 (0.5–2.1) | 25 (31.3) | 0.0 (0.0−0.1) | 44 (51.8) | 0.2 (0.1−0.4) |
| Blomia tropicalis | 93 (83.8) | 3.1 (1.8–5.4) | 84 (84.8) | 6.4 (3.4–12.0) | 51 (53.7) | 0.3 (0.2−0.6) | 16 (20.0) | 0.0 (0.0−0.0) | 45 (52.4) | 0.1 (0.1−0.3) |
| Periplaneta Americana | 61 (55.5) | 0.2 (0.1−0.3) | 72 (72.7) | 0.6 (0.4–1.0) | 38 (40.4) | 0.1 (0.1−0.1) | 7 (8.8) | 0.0 (0.0−0.0) | 24 (28.2) | 0.0 (0.0−0.1) |
| Cat epithelium | 47 (42.3) | 0.1 (0.1−0.1) | 59 (59.6) | 0.4 (0.2−0.8) | 49 (51.6) | 0.2 (0.1−0.3) | 2 (2.5) | 0.0 (0.0−0.0) | 13 (15.3) | 0.0 (0.0−0.0) |
| Horse epithelium | 31 (27.9) | 0.0 (0.0−0.1) | 53 (53.5) | 0.1 (0.1−0.2) | 27 (28.4) | 0.0 (0.0−0.1) | 1 (1.3) | 0.0 (0.0−0.0) | 6 (7.1) | 0.0 (0.0−0.0) |
| Cow epithelium | 43 (38.7) | 0.1 (0.1−0.1) | 60 (60.6) | 0.2 (0.1−0.3) | 75 (78.9) | 0.7 (0.4–1.2) | 7 (8.8) | 0.0 (0.0−0.0) | 21 (24.7) | 0.0 (0.0−0.0) |
| Dog epithelium | 73 (65.8) | 0.2 (0.1−0.3) | 73 (73.7) | 0.7 (0.4–1.2) | 63 (66.3) | 0.4 (0.2−0.6) | 6 (7.5) | 0.0 (0.0−0.0) | 24 (28.2) | 0.0 (0.0−0.0) |
| Grasses | 49 (44.1) | 0.1 (0.1−0.2) | 68 (68.7) | 0.3 (0.2−0.6) | 37 (38.9) | 0.1 (0.1−0.1) | 3 (3.8) | 0.0 (0.0−0.0) | 22 (25.9) | 0.0 (0.0−0.1) |
| Fungi | 40 (36.0) | 0.1 (0.1−0.1) | 63 (63.6) | 0.2 (0.2−0.3) | 31 (32.6) | 0.1 (0.1−0.1) | 5 (6.3) | 0.1 (0.0−0.1) | 17 (20.0) | 0.1 (0.1−0.1) |
| Ascaris | 65 (58.6 %) | 0.3 (0.2−0.4) | 71 (71.7) | 0.7 (0.4–1.2) | 42 (44.2) | 0.1 (0.1−0.2) | 5 (6.3) | 0.0 (0.0−0.0) | 30 (35.3) | 0.1 (0.0−0.1) |
| Egg | 37 (33.3 %) | 0.1 (0.0−0.1) | 65 (65.7) | 0.3 (0.2−0.5) | 67 (70.5) | 0.4 (0.3−0.7) | 17 (21.3) | 0.0 (0.0−0.1) | 23 (27.1) | 0.0 (0.0−0.1) |
| Cow's milk | 45 (40.5 %) | 0.1 (0.1−0.1) | 66 (66.7) | 0.2 (0.1−0.3) | 80 (84.2) | 1.9 (1.1–3.2) | 21 (26.3) | 0.0 (0.0−0.1) | 21 (24.7) | 0.0 (0.0−0.1) |
| Fish | 18 (16.2 %) | 0.0 (0.0−0.0) | 48 (48.5) | 0.1 (0.1−0.2) | 19 (20.0) | 0.0 (0.0−0.1) | 0 (0.0) | 0.0 (0.0−0.0) | 6 (7.1) | 0.0 (0.0−0.0) |
| Wheat | 53 (47.7 %) | 0.1 (0.1−0.1) | 70 (70.7) | 0.3 (0.2−0.4) | 55 (57.9) | 0.2 (0.1−0.3) | 9 (11.3) | 0.0 (0.0−0.0) | 23 (27.1) | 0.1 (0.0−0.1) |
| Corn | 37 (33.6 %) | 0.1 (0.1−0.1) | 57 (57.6) | 0.2 (0.1−0.2) | 42 (44.2) | 0.1 (0.1−0.2) | 5 (6.3) | 0.0 (0.0−0.0) | 18 (21.2) | 0.0 (0.0−0.0) |
| Peanuts | 36 (32.4 %) | 0.1 (0.0−0.1) | 60 (60.6) | 0.2 (0.1−0.3) | 44 (46.3) | 0.1 (0.1−0.2) | 6 (7.5) | 0.0 (0.0−0.0) | 18 (21.2) | 0.0 (0.0−0.0) |
| Soy | 24 (21.6 %) | 0.0 (0.0−0.0) | 53 (53.5) | 0.1 (0.1−0.2) | 42 (44.2) | 0.1 (0.1−0.1) | 5 (6.3) | 0.0 (0.0−0.0) | 15 (17.6) | 0.0 (0.0−0.0) |
| Nuts | 8 (7.2) | 0.0 (0.0−0.0) | 13 (13.1) | 0.0 (0.0−0.0) | 9 (9.5) | 0.0 (0.0−0.0) | 1 (1.3) | 0.0 (0.0−0.0) | 3 (3.5) | 0.0 (0.0−0.0) |
| Shrimp | 68 (61.3) | 0.3 (0.2−0.4) | 75 (75.8) | 0.9 (0.5–1.5) | 40 (42.1) | 0.1 (0.1−0.2) | 9 (11.3) | 0.0 (0.0−0.0) | 25 (29.4) | 0.0 (0.0−0.1) |
| Cashew Nuts | 24 (21.6) | 0.0 (0.0−0.0) | 46 (46.9) | 0.1 (0.1−0.1) | 34 (35.8) | 0.1 (0.0−0.1) | 2 (2.5) | 0.0 (0.0−0.0) | 12 (14.1) | 0.0 (0.0−0.0) |
RA, respiratory allergy; AD, atopic dermatitis; FA, food allergy; WI, wheezing infants; C, controls.
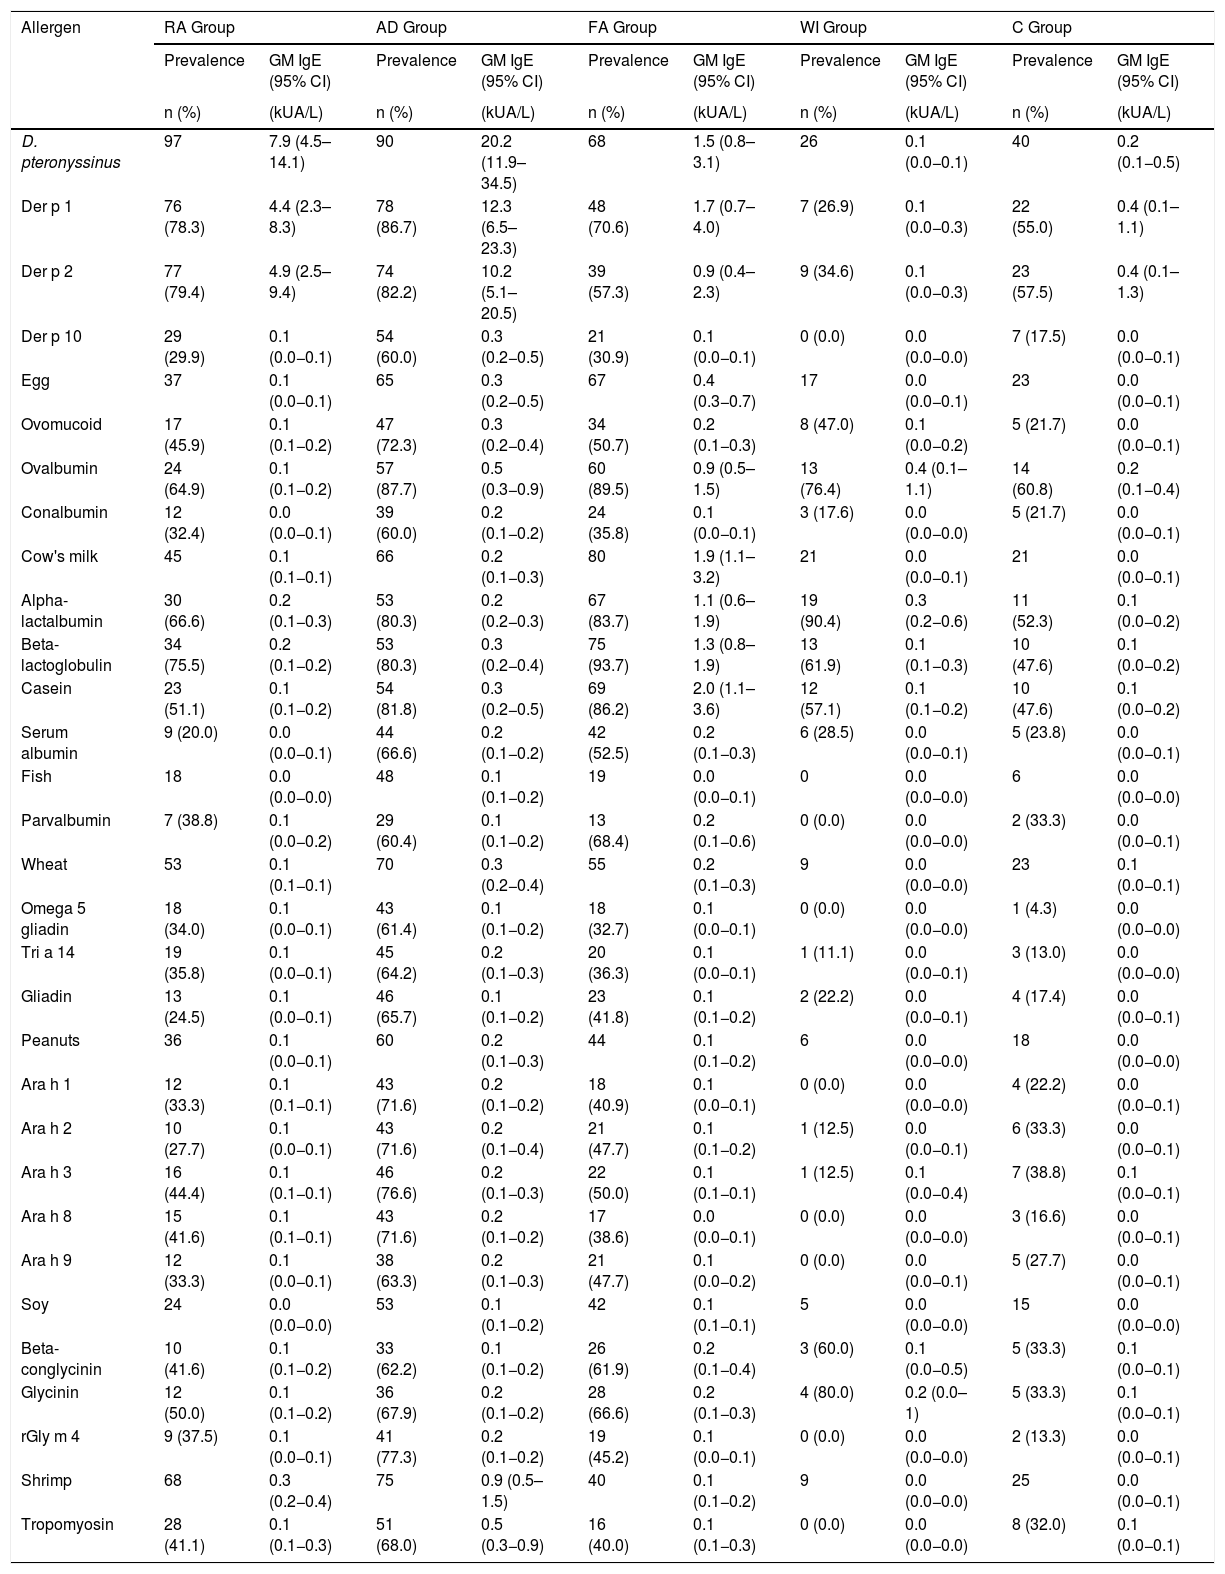
Table 3 shows the prevalence of sensitization and the sIgE GM of the components examined, according to the disease group with a predominance of Der p 1 and Der p 2 sensitization (78.3% and 79.4%, respectively). Beta-lactoglobulin was the most common component (93.7%) among the CM fractions. Table 4 presents the factors associated with the severity of the diseases, per a bivariate analysis. It has been verified that FA, AD, or multimorbidity are risk factors for the development of a more severe allergic disease.
Prevalence of sensitization (based on the positive result for the main allergen) and geometric mean (GM) of sIgE of the allergen components, according to the groups of participants.
| Allergen | RA Group | AD Group | FA Group | WI Group | C Group | |||||
|---|---|---|---|---|---|---|---|---|---|---|
| Prevalence | GM IgE (95% CI) | Prevalence | GM IgE (95% CI) | Prevalence | GM IgE (95% CI) | Prevalence | GM IgE (95% CI) | Prevalence | GM IgE (95% CI) | |
| n (%) | (kUA/L) | n (%) | (kUA/L) | n (%) | (kUA/L) | n (%) | (kUA/L) | n (%) | (kUA/L) | |
| D. pteronyssinus | 97 | 7.9 (4.5–14.1) | 90 | 20.2 (11.9–34.5) | 68 | 1.5 (0.8–3.1) | 26 | 0.1 (0.0−0.1) | 40 | 0.2 (0.1−0.5) |
| Der p 1 | 76 (78.3) | 4.4 (2.3–8.3) | 78 (86.7) | 12.3 (6.5–23.3) | 48 (70.6) | 1.7 (0.7–4.0) | 7 (26.9) | 0.1 (0.0−0.3) | 22 (55.0) | 0.4 (0.1–1.1) |
| Der p 2 | 77 (79.4) | 4.9 (2.5–9.4) | 74 (82.2) | 10.2 (5.1–20.5) | 39 (57.3) | 0.9 (0.4–2.3) | 9 (34.6) | 0.1 (0.0−0.3) | 23 (57.5) | 0.4 (0.1–1.3) |
| Der p 10 | 29 (29.9) | 0.1 (0.0−0.1) | 54 (60.0) | 0.3 (0.2−0.5) | 21 (30.9) | 0.1 (0.0−0.1) | 0 (0.0) | 0.0 (0.0−0.0) | 7 (17.5) | 0.0 (0.0−0.1) |
| Egg | 37 | 0.1 (0.0−0.1) | 65 | 0.3 (0.2−0.5) | 67 | 0.4 (0.3−0.7) | 17 | 0.0 (0.0−0.1) | 23 | 0.0 (0.0−0.1) |
| Ovomucoid | 17 (45.9) | 0.1 (0.1−0.2) | 47 (72.3) | 0.3 (0.2−0.4) | 34 (50.7) | 0.2 (0.1−0.3) | 8 (47.0) | 0.1 (0.0−0.2) | 5 (21.7) | 0.0 (0.0−0.1) |
| Ovalbumin | 24 (64.9) | 0.1 (0.1−0.2) | 57 (87.7) | 0.5 (0.3−0.9) | 60 (89.5) | 0.9 (0.5–1.5) | 13 (76.4) | 0.4 (0.1–1.1) | 14 (60.8) | 0.2 (0.1−0.4) |
| Conalbumin | 12 (32.4) | 0.0 (0.0−0.1) | 39 (60.0) | 0.2 (0.1−0.2) | 24 (35.8) | 0.1 (0.0−0.1) | 3 (17.6) | 0.0 (0.0−0.0) | 5 (21.7) | 0.0 (0.0−0.1) |
| Cow's milk | 45 | 0.1 (0.1−0.1) | 66 | 0.2 (0.1−0.3) | 80 | 1.9 (1.1–3.2) | 21 | 0.0 (0.0−0.1) | 21 | 0.0 (0.0−0.1) |
| Alpha-lactalbumin | 30 (66.6) | 0.2 (0.1−0.3) | 53 (80.3) | 0.2 (0.2−0.3) | 67 (83.7) | 1.1 (0.6–1.9) | 19 (90.4) | 0.3 (0.2−0.6) | 11 (52.3) | 0.1 (0.0−0.2) |
| Beta-lactoglobulin | 34 (75.5) | 0.2 (0.1−0.2) | 53 (80.3) | 0.3 (0.2−0.4) | 75 (93.7) | 1.3 (0.8–1.9) | 13 (61.9) | 0.1 (0.1−0.3) | 10 (47.6) | 0.1 (0.0−0.2) |
| Casein | 23 (51.1) | 0.1 (0.1−0.2) | 54 (81.8) | 0.3 (0.2−0.5) | 69 (86.2) | 2.0 (1.1–3.6) | 12 (57.1) | 0.1 (0.1−0.2) | 10 (47.6) | 0.1 (0.0−0.2) |
| Serum albumin | 9 (20.0) | 0.0 (0.0−0.1) | 44 (66.6) | 0.2 (0.1−0.2) | 42 (52.5) | 0.2 (0.1−0.3) | 6 (28.5) | 0.0 (0.0−0.1) | 5 (23.8) | 0.0 (0.0−0.1) |
| Fish | 18 | 0.0 (0.0−0.0) | 48 | 0.1 (0.1−0.2) | 19 | 0.0 (0.0−0.1) | 0 | 0.0 (0.0−0.0) | 6 | 0.0 (0.0−0.0) |
| Parvalbumin | 7 (38.8) | 0.1 (0.0−0.2) | 29 (60.4) | 0.1 (0.1−0.2) | 13 (68.4) | 0.2 (0.1−0.6) | 0 (0.0) | 0.0 (0.0−0.0) | 2 (33.3) | 0.0 (0.0−0.1) |
| Wheat | 53 | 0.1 (0.1−0.1) | 70 | 0.3 (0.2−0.4) | 55 | 0.2 (0.1−0.3) | 9 | 0.0 (0.0−0.0) | 23 | 0.1 (0.0−0.1) |
| Omega 5 gliadin | 18 (34.0) | 0.1 (0.0−0.1) | 43 (61.4) | 0.1 (0.1−0.2) | 18 (32.7) | 0.1 (0.0−0.1) | 0 (0.0) | 0.0 (0.0−0.0) | 1 (4.3) | 0.0 (0.0−0.0) |
| Tri a 14 | 19 (35.8) | 0.1 (0.0−0.1) | 45 (64.2) | 0.2 (0.1−0.3) | 20 (36.3) | 0.1 (0.0−0.1) | 1 (11.1) | 0.0 (0.0−0.1) | 3 (13.0) | 0.0 (0.0−0.0) |
| Gliadin | 13 (24.5) | 0.1 (0.0−0.1) | 46 (65.7) | 0.1 (0.1−0.2) | 23 (41.8) | 0.1 (0.1−0.2) | 2 (22.2) | 0.0 (0.0−0.1) | 4 (17.4) | 0.0 (0.0−0.1) |
| Peanuts | 36 | 0.1 (0.0−0.1) | 60 | 0.2 (0.1−0.3) | 44 | 0.1 (0.1−0.2) | 6 | 0.0 (0.0−0.0) | 18 | 0.0 (0.0−0.0) |
| Ara h 1 | 12 (33.3) | 0.1 (0.1−0.1) | 43 (71.6) | 0.2 (0.1−0.2) | 18 (40.9) | 0.1 (0.0−0.1) | 0 (0.0) | 0.0 (0.0−0.0) | 4 (22.2) | 0.0 (0.0−0.1) |
| Ara h 2 | 10 (27.7) | 0.1 (0.0−0.1) | 43 (71.6) | 0.2 (0.1−0.4) | 21 (47.7) | 0.1 (0.1−0.2) | 1 (12.5) | 0.0 (0.0−0.1) | 6 (33.3) | 0.0 (0.0−0.1) |
| Ara h 3 | 16 (44.4) | 0.1 (0.1−0.1) | 46 (76.6) | 0.2 (0.1−0.3) | 22 (50.0) | 0.1 (0.1−0.1) | 1 (12.5) | 0.1 (0.0−0.4) | 7 (38.8) | 0.1 (0.0−0.1) |
| Ara h 8 | 15 (41.6) | 0.1 (0.1−0.1) | 43 (71.6) | 0.2 (0.1−0.2) | 17 (38.6) | 0.0 (0.0−0.1) | 0 (0.0) | 0.0 (0.0−0.0) | 3 (16.6) | 0.0 (0.0−0.1) |
| Ara h 9 | 12 (33.3) | 0.1 (0.0−0.1) | 38 (63.3) | 0.2 (0.1−0.3) | 21 (47.7) | 0.1 (0.0−0.2) | 0 (0.0) | 0.0 (0.0−0.1) | 5 (27.7) | 0.0 (0.0−0.1) |
| Soy | 24 | 0.0 (0.0−0.0) | 53 | 0.1 (0.1−0.2) | 42 | 0.1 (0.1−0.1) | 5 | 0.0 (0.0−0.0) | 15 | 0.0 (0.0−0.0) |
| Beta-conglycinin | 10 (41.6) | 0.1 (0.1−0.2) | 33 (62.2) | 0.1 (0.1−0.2) | 26 (61.9) | 0.2 (0.1−0.4) | 3 (60.0) | 0.1 (0.0−0.5) | 5 (33.3) | 0.1 (0.0−0.1) |
| Glycinin | 12 (50.0) | 0.1 (0.1−0.2) | 36 (67.9) | 0.2 (0.1−0.2) | 28 (66.6) | 0.2 (0.1−0.3) | 4 (80.0) | 0.2 (0.0–1) | 5 (33.3) | 0.1 (0.0−0.1) |
| rGly m 4 | 9 (37.5) | 0.1 (0.0−0.1) | 41 (77.3) | 0.2 (0.1−0.2) | 19 (45.2) | 0.1 (0.0−0.1) | 0 (0.0) | 0.0 (0.0−0.0) | 2 (13.3) | 0.0 (0.0−0.1) |
| Shrimp | 68 | 0.3 (0.2−0.4) | 75 | 0.9 (0.5–1.5) | 40 | 0.1 (0.1−0.2) | 9 | 0.0 (0.0−0.0) | 25 | 0.0 (0.0−0.1) |
| Tropomyosin | 28 (41.1) | 0.1 (0.1−0.3) | 51 (68.0) | 0.5 (0.3−0.9) | 16 (40.0) | 0.1 (0.1−0.3) | 0 (0.0) | 0.0 (0.0−0.0) | 8 (32.0) | 0.1 (0.0−0.1) |
RA, respiratory allergy; AD, atopic dermatitis; FA, food allergy; WI, wheezing infants; C, controls.
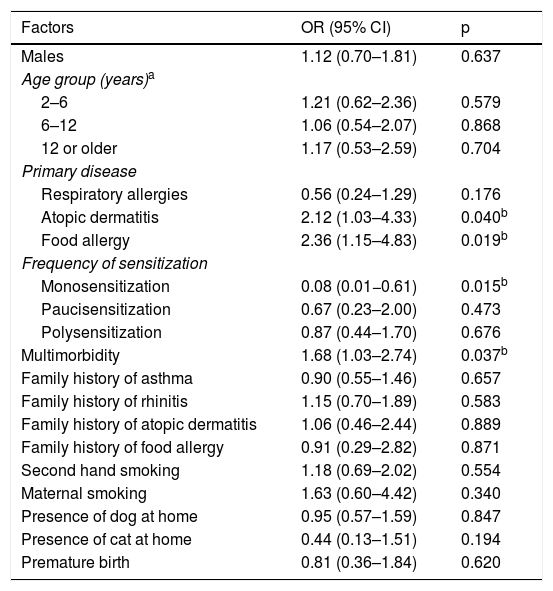
Factors associated with the severity of allergic diseases examined in bivariate analysis.
| Factors | OR (95% CI) | p |
|---|---|---|
| Males | 1.12 (0.70–1.81) | 0.637 |
| Age group (years)a | ||
| 2–6 | 1.21 (0.62–2.36) | 0.579 |
| 6–12 | 1.06 (0.54–2.07) | 0.868 |
| 12 or older | 1.17 (0.53–2.59) | 0.704 |
| Primary disease | ||
| Respiratory allergies | 0.56 (0.24–1.29) | 0.176 |
| Atopic dermatitis | 2.12 (1.03–4.33) | 0.040b |
| Food allergy | 2.36 (1.15–4.83) | 0.019b |
| Frequency of sensitization | ||
| Monosensitization | 0.08 (0.01−0.61) | 0.015b |
| Paucisensitization | 0.67 (0.23–2.00) | 0.473 |
| Polysensitization | 0.87 (0.44–1.70) | 0.676 |
| Multimorbidity | 1.68 (1.03–2.74) | 0.037b |
| Family history of asthma | 0.90 (0.55–1.46) | 0.657 |
| Family history of rhinitis | 1.15 (0.70–1.89) | 0.583 |
| Family history of atopic dermatitis | 1.06 (0.46–2.44) | 0.889 |
| Family history of food allergy | 0.91 (0.29–2.82) | 0.871 |
| Second hand smoking | 1.18 (0.69–2.02) | 0.554 |
| Maternal smoking | 1.63 (0.60–4.42) | 0.340 |
| Presence of dog at home | 0.95 (0.57–1.59) | 0.847 |
| Presence of cat at home | 0.44 (0.13–1.51) | 0.194 |
| Premature birth | 0.81 (0.36–1.84) | 0.620 |
The WI group was excluded from this analysis because it was more heterogeneous and significantly altered all regression models previously performed.
Allergic rhinitis, asthma, AD, and FA are allergic diseases that can be mediated by IgE antibodies.5 Allergic sensitization plays an important role in the development of these allergies. However, mechanisms unrelated to IgE may be involved and should be considered, especially when it comes to explaining the appearance of an allergy in infants and young children.14
The sIgE acts as an initial trigger for a sequence of pro-inflammatory reactions in sensitized individuals that leads to allergy symptoms affecting different organs. However, the presence of an allergen-specific IgE can also be observed in asymptomatic individuals.5,15 In general, asymptomatic patients are mono or paucisensitized and present lower sIgE,5 as was observed in the C group. Furthermore, sensitization patterns varied according to age group.4 The WI group presented lower rates of allergic sensitization. In addition, multifactorial etiology can be inferred in the development of recurring wheezing in infants, such as viral respiratory infections.16
Mite sensitization was the most frequent type in all groups. Exposure to these animals is year-round, and warm temperatures favor their proliferation.17 A high frequency of sensitization to dog epithelium (65.8%) and grasses (44.1%) stand out among the RA group. The rise in urbanization has fostered pollen allergenicity, while the indoor lifestyle of Western society favors contact with pet allergens, especially that of dogs (pet dogs are a prevalent cultural characteristic in Brazil), which were present in 36% of the RA participants’ homes.18
The increased consumption of ultra-processed food products is another aspect of modern lifestyles that appears to alter the human microbiota, which appears to facilitate sensitization to different allergens, especially food allergens.6,18
Of all the allergen components analyzed, there was a predominance of sensitization to Der p 1 and Der p 2 (78.3% and 79.4%, respectively). Der p 1 relates to a high risk of asthma in sensitized patients.19 Der p 10 was present in 30% of the individuals included in the study. Despite having lower clinical significance, Der p 10 is a diagnostic marker for broad awareness in household dust mite allergy.20 That component is a member of the tropomyosin family and presents similarities to shrimp tropomyosin and Ascaris lumbricoides tropomyosin. This information is consistent with the prevalence of sensitization to shrimp tropomyosin (41.1%) and Ascaris lumbricoides tropomyosin (58.6%) observed in the results of the present study. The Ascaris lumbricoides issue is fascinating, since a large part of the population is parasitized by these pathogens, and the tropomyosin of Ascaris is cross-reactive with those of mites, the most prevalent group in the entire sample.
The relation between asthma and food allergies is controversial. Some authors have suggested that the frequency of food sensitization in asthmatic children to be higher than what would be expected for the general population. A North American study of patients with asthma found that 45% were sensitized to at least one of the six types of food for which they were tested (egg, cow’s milk, soy, peanuts, wheat, and fish)21 Wheat sensitization was considerable in the respiratory diseases group (47.7%). A relation between wheat and asthma is well-known, principally because asthma is a common occupational disease in bakers.22 However, some components of wheat may have proteins similar to those of grasses. Therefore, patients that are allergic to pollen can present with false positives for wheat allergies.23
The AD group’s prevalence of sensitization was 50% higher to most allergens and components included in this study. The AD group has a high rate of allergic sensitization to foods, and two possibilities can be inferred. IgE is generally higher in these patients and, due to a convenience sample from reference centers, many patients with moderate-severe atopic dermatitis have concomitant food allergies.4
A discrepancy can be seen concerning nuts, as the overall frequency was low (13.1%), but cashews had a frequency of 46.9%, perhaps due to their high consumption in the population examined. Brazil is among the top five highest cashew-consuming countries, as they are used in many industrialized food products.24 Just like with peanuts, allergic reactions to nuts can be severe, even with low sIgE levels. Knowing the components can help identify if the allergenic protein is labile or stable, as well as if it is cross-reactive with other types of food, which would help in the management of allergic disease.3
Commenting on the FA group, besides the higher prevalence of sensitization to airborne allergens, the sensitization to the foods most associated with allergic reactions found in this group were even higher. Sensitization to CM was found to be at 84.2%, a finding consistent with the patients’ medical histories, which suggests that the CM allergy is the most common. Among the CM fractions, beta-lactoglobulin was the most common component (93.7%), followed by casein, which is generally responsible for the persistence of the condition.25 Among those sensitized to egg, ovalbumin was the most prevalent (89.5%). This protein is thermolabile and more associated with tolerance to egg.26 No difference was found with sensitization to the components of peanuts; however, Ara h 2 was the storage protein found to have the highest serum concentration in the patients of this group. This fraction is generally associated with severe systemic allergic reactions.27 The prevalence of sensitization to shrimp tropomyosin (40.0%) may be related to cross-reactivity from mite allergies, which are also very prevalent in this group.12
It must be emphasized that even asymptomatic patients in the control group tested positive for sensitization to the different allergens, especially those of mites. However, the GM of sIgE found in this group was significantly lower than the other groups examined.
The term multimorbidity was initially used to designate the presence of allergic diseases that share the same embryonic development: asthma, rhinitis, and AD.4 However, recent studies suggest that patients with FA, especially those with multiple FA, are at a higher risk of developing asthma and other allergic diseases.28,29
Furthermore, asthma, rhinitis, AD, and IgE-mediated FA co-occur with related chemical mediators of inflammation elaborated by the lymphocyte T helper 2 (Th2), denote common genes, and even present similar clinical characteristics.29
Besides that, patients in this study were designated as having multimorbidity when they presented allergic diseases from two or more of the disease groups (RA, AD, FA, and WI), which was found to be the case in 48.8% (n = 188 — Table 1) of the sample group. AD patients were those who had more multimorbidity (78.8%).
A logistic regression model was created for the severity of diseases. It was found that having FA, AD, or multimorbidity are risk factors for the development of more severe allergic diseases. However, monosensitization was identified as a protective factor in the severity of allergic diseases. This is an important observation, as recent studies have addressed the importance of multimorbidity to the development of allergic diseases, and it is associated with higher severity and greater persistence of allergic symptoms. Concerning allergic sensitization, although it does not explain the development of allergic disease in young children, different studies have evaluated the impact of polysensitization on the severity of allergic diseases.4,5
The present study presented several limitations. Although asthma and allergic rhinitis have many similarities and have been grouped as respiratory diseases, this may have led to an undervaluation of certain information, especially regarding asthma-only patients. It is essential to highlight that 91% of the AR group had asthma in their medical history. Another consideration is that despite the study having only involved children and adolescents, there was a wide age range studied, which may lead to bias in the evaluation.
Moreover, the lacking relevant information, such as breastfeeding habits, infections, and medication use during the first year of life, could have contributed to a better categorization of the disease groups, especially when it came to WI. Another limitation was measuring only the components of allergens that appeared above the sensitization threshold. Several components not quantified by conventional testing were found at minute levels in the blood samples.
In conclusion, studies on the profile of allergic sensitization to a specific population offer tools for the more effective prevention, diagnosis, and treatment of allergic diseases. Sensitization to mites was found to be prevalent in all the groups included in this study, both those composed of allergy patients and the asymptomatic control group. High rates of sensitization to dogs also stand out. Though sIgE were found in part of the control group, the GM was lower than the patients with allergic disease. The low sensitization rates and low mean sIgE found in WI patients may indicate that the causes of wheezing are heterogeneous. Patients with FA, AD, or multimorbidity appear to be at higher risk for developing more severe allergic diseases.
Conflicts of interestProf. Magnus Borres is an employee of Thermo Fisher Scientific. The other authors declare no conflicts of interest.


