Using a wide and representative sample of adolescents from 37 countries, this study aimed to analyze how age changes adolescents’ healthy lifestyle.
MethodsThe study included 148,839 adolescents who participated in the Health Behavior in School-aged Children 2010 survey. A composite score of a healthy lifestyle was created using the combination of daily physical activity, daily fruit and vegetable consumption, <2h daily on screen-based behaviors, abstinence from alcohol, and abstinence from tobacco products. Healthy lifestyle measures were based on self-report.
Results4.7% of boys and 4.4% of girls aged 11 years, 3% of boys and 2% of girls aged 13 years, and 1.5% of boys and 0.8% of girls aged 15 scored perfectly on the healthy lifestyle score. As age increased, the prevalence of adolescents with a healthy lifestyle decreased. In 37 countries and regions, the prevalence of healthy behaviors decreased linearly between early adolescence and the age of 15 years.
ConclusionsIn general, adolescents do not have a healthy lifestyle. Results from this study highlight that there is still much work to be done in promoting healthy lifestyles and to raise awareness among adolescents of the potential risk to their health status.
Com o uso de uma amostra ampla e representativa de adolescentes de 37 países, analisar como a idade muda o estilo de vida saudável dos adolescentes.
MétodosParticiparam 148.839 adolescentes provenientes da pesquisa Health Behavior in School-aged Children, de 2010. Foi elaborado um escore composto de um estilo de vida saudável, com a combinação de atividade física diária, consumo diário de frutas e vegetais, menos de duas horas diárias de comportamento sedentário baseado em tempo de tela, abstinência de álcool e abstinência de produtos de tabaco. As medidas do estilo de vida saudável foram baseadas em autorrelato.
ResultadosObtiveram um escore perfeito no estilo de vida saudável 4,7% dos meninos e 4,4% das meninas de 11 anos, 3% dos meninos e 2% das meninas de 13 anos e 1,5% dos meninos e 0,8% das meninas de 15 anos. Com o aumento da idade, a prevalência de adolescentes com estilo de vida saudável diminuiu. Em 37 países e regiões, a prevalência de comportamentos saudáveis diminuiu linearmente entre o início da adolescência e os 15 anos.
ConclusõesEm geral, os adolescentes não têm um estilo de vida saudável. Os resultados deste estudo destacam que ainda há muito trabalho a ser feito na promoção de estilos de vida saudáveis e na conscientização dos adolescentes sobre os riscos potenciais para o seu estado de saúde.
Adolescence might be critical for later health and disease,1 because there is some evidence stating that habits acquired in this period may track into adulthood. For instance, alcohol habits during adolescence increase the likelihood of heavy consumption in adulthood,2 as well as food consumption in adolescence is a predictor of intake in adulthood.3 For this reason, several chronic diseases may have their origin, and disease progression, during adolescence.1
To improve adolescents’ health, it is important to promote healthy behaviors at an early age, especially during adolescence. Healthy behaviors are a determinant of health; positive changes can have an impact on the overall health outcomes.4 The main behaviors associated with adolescents’ health are physical activity, less time engaging with multi-media, healthy diet, and absence of alcohol and tobacco consumption,4–6 as well as caffeine/stimulant use, sleep deprivation, drug use, condomless sex, and unhealthy relationships.7 During the transition into adolescence and throughout it, there is an increase in desiring novelty, along with the courage and curiosity to experiment with new and often unhealthy behaviors.8
Since adolescence is a critical time to establish the foundations of a person's health,1,2 it is important to understand the behavioral practice during the transition from early to late adolescence. Studies on adolescents’ healthy habits have focused on the relationship between individual behaviors and their outcome on health.9,10 Attempts to combine several health behaviors to create a solution to express a healthy lifestyle are sparse.11 Such measure could be important to the public health policy by influencing the way in which programs set up to promote healthy lifestyles are developed. Thus, there is a need to understand how healthy behaviors, and a healthy lifestyle, change during this stage of life. Therefore, using a wide and representative sample of adolescents from 37 countries and regions, this study aimed to examine the association between age and changes in self-reported prevalence of healthy behaviors in adolescents.
MethodsProcedures and participantsData was extracted from the international survey database Health Behavior in School-aged Children (HBSC) 2010, available at http://www.uib.no/en/hbscdata. The HBSC survey is conducted every four years in several European and Northern American countries, in representative school-based samples.12 It examines health behaviors and lifestyles among adolescents from grades 6, 8, and 10, aged 11, 13, and 15 years, respectively. In each country, adolescents are recruited from schools randomly selected from a list stratified by regions. The procedures of the HBSC survey are developed through an internationally standardized research protocol, in order to allow cross-cultural comparisons. The methods and instrument description can be found elsewhere.12 The survey was conducted and approved in accordance with the ethical guidelines from ethical committees from each country. For instance, in Portugal, the research was conducted in accordance with both the Ethical Committee of the Oporto Medical School and the National Data Protection System. A written informed consent to participate was required from parents or legal guardians, and adolescents provided their assent. Participation was anonymous and there were no incentives for participation.
The number of adolescents participating in the HBSC 2010 survey was 213,594 (105,099 boys and 108,496 girls). For the present study, the selected adolescents were those who reported physical activity levels, screen-based sedentary behaviors, eating fruits and vegetables, involvement in alcohol consumption and tobacco use, and being aged 11, 13, and 15 years old (i.e., the age-grade equivalent for grades 6, 8, and 10). The final sample comprised 148,839 adolescents (71,415 boys and 77,424 girls). The final sample did not differ in sex distribution, age, and health behaviors from all adolescents participating in the HBSC 2010, and from those who were not included in the analysis.
MeasuresSocio-demographic characteristicsAdolescents reported their age, gender, number of people in their household, and number of siblings. Furthermore, the family affluence scale was used to assess socioeconomic status. Adolescents were asked about family car ownership, whether they had a bedroom for themselves, whether they traveled on holidays, and the number of computers at home. Subsequently, a composite score was calculated based on responses to these four items, and a three-point scale was obtained: low (0–2), middle (3–5), and high (6–9).
Healthy lifestyle behaviors and healthy lifestyle composite scoreAdolescents were asked to report the number of days they were physically active for a total of at least 60min per day in the last seven days. Prior to answer, adolescents were provided with a definition of physical activity,13 accompanied by examples of some age relevant activities. Answers were given on an 8-point scale (0=none to 7=daily). Responses were dichotomized into ≤six times or seven times per week, according to the physical activity guidelines.13 Adolescents were asked to indicate the customary time (hours per day) that they spend watching television, playing videogames, and using the computer. Screen-based behavior was calculated by the sum of these behaviors. The screen-based behaviors time was dichotomized into ≥2h and <2h daily.14 Adolescents were asked to report the frequency that they consumed fruits and vegetables. The options were “never,” “less than once a week,” “once a week,” “two-four days a week,” “five-six days a week,” “once a day,” and “several times every day.” The items were dichotomized into “less than daily” and “daily,” because the daily consumption of fruits and vegetables daily is an important healthy behavior in school-aged children.15,16 Adolescents were asked how often they consume alcohol (e.g., beer, wine, liquor). For each option, the answer choices were: “never,” “rarely,” “every month,” “every week,” and “every day.” Alcohol ingestion is damaging for the adolescents’ health,17 and the guidelines regarding alcohol consumption for adolescents recommends abstinence.18 Thus, responses were dichotomized into drinking (regardless of the frequency) and never drinking. Tobacco use was measured by asking, “How often do you smoke tobacco at present?” Response options were “every day,” “at least once a week, but not every day,” “less than once a week,” or “never”. Since there is no threshold of safety for smoking, responses were recoded into current smoker (regularly or sometimes), and non-smoker.
Most studies of adolescent health have focused on the relationship between a specific health outcome and a given behavior.9,10 However, studies that combined several health behaviors in an attempt to create a measure that expresses a healthy lifestyle are sparse.11 Such a measure could be important to public health policy, influencing the way in which programs to promote healthy lifestyles are developed. Accordingly, by combining all these healthy behaviors, a healthy lifestyle composite score was created. One point was assigned for each of the following healthy lifestyle categories: (a) daily physical activity, (b) daily consumption of fruits and vegetables, (c) spending <2 daily hours in screen-based sedentary behaviors, (d) never drinking, and (e) never smoking. The healthy lifestyle score ranged from 0 to 5, with a total score of 5 healthy behaviors representing a healthy lifestyle.
Data analysisFor the entire sample, descriptive statistics were calculated (means, standard deviation, and percentages). Estimates and 95% confidence intervals were reported for the prevalence of healthy lifestyle behaviors, and for the number of behaviors criteria met. Moreover, the mean number of behaviors reported was also calculated. This information was stratified by age (11, 13, and 15 years). The chi-squared test for trends and ANCOVA were used to analyze the relationship between adolescents’ age, healthy lifestyle behaviors, and number of behaviors reported. Analyses were stratified by gender. Statistical analysis was performed using SPSS 24. The significance level was set at p<0.05.
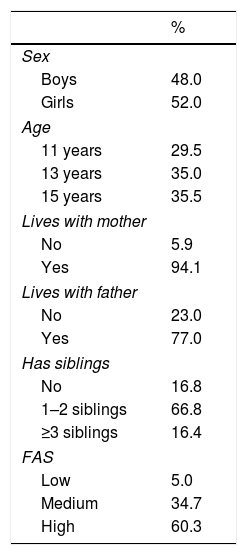
ResultsThe characteristics of the sample data are presented in Table 1. Most of the adolescents lived with their mother (94.1%), 77% lived with their father at home, and more than 80% had siblings. Only 5% were classified as having a lower socioeconomic status, while the remaining were classified as medium (34.7%) or high (60.3%) socioeconomic status.
Participants’ characteristics (n=148,839).
| % | |
|---|---|
| Sex | |
| Boys | 48.0 |
| Girls | 52.0 |
| Age | |
| 11 years | 29.5 |
| 13 years | 35.0 |
| 15 years | 35.5 |
| Lives with mother | |
| No | 5.9 |
| Yes | 94.1 |
| Lives with father | |
| No | 23.0 |
| Yes | 77.0 |
| Has siblings | |
| No | 16.8 |
| 1–2 siblings | 66.8 |
| ≥3 siblings | 16.4 |
| FAS | |
| Low | 5.0 |
| Medium | 34.7 |
| High | 60.3 |
FAS, family affluence scale.
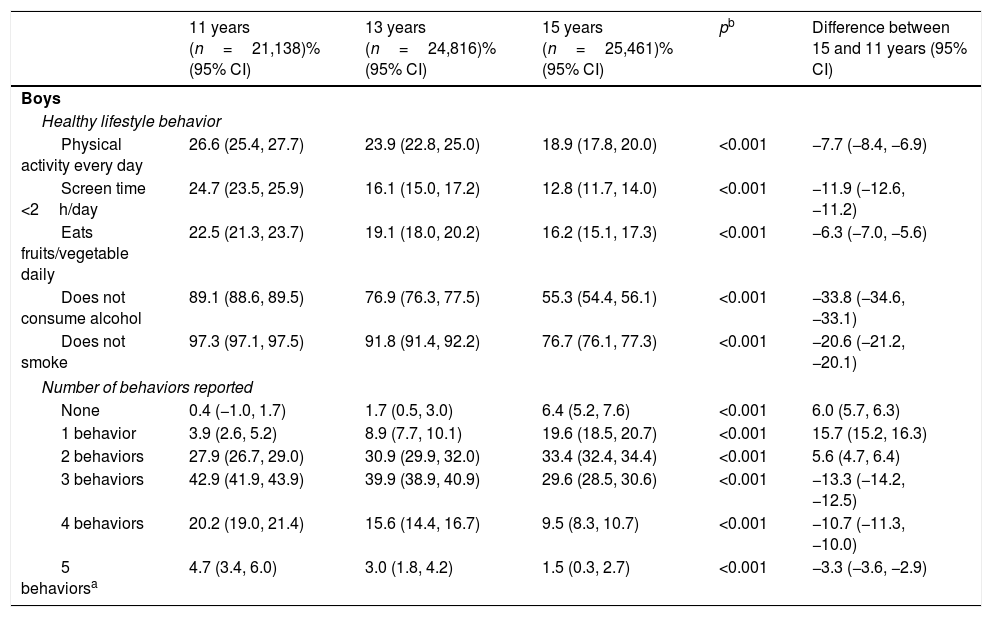
Table 2 presents the prevalence of healthy lifestyle behaviors. Among boys, screen time less than 2h/day (12.8%, 95% CI: 11.7, 14.0), eating fruit and vegetables every day (16.2%, 95% CI: 15.1, 17.3), and practice of physical activity every day (18.9%, 95% CI: 17.8, 20.0) were the least prevalent healthy behaviors at the age of 15 years. In turn, the prevalence of boys who did not consume alcohol (89.1.5%; 95% CI: 88.6, 89.6) and did not smoke (97.3%; 95% CI: 97.1, 97.5) was higher at age 11. The prevalence of all healthy behaviors significantly decreased with age, and the decreasing trend was more pronounced regarding alcohol consumption (−43.5%; 95% CI: −44.1, −42.8) and smoking (−21.6%; 95% CI: −22.1, −21.0) than regarding physical activity, screen time less than 2h/day, and eating fruits or vegetables every day. Only 4.7% (95% CI: 3.4, 6.0) of boys aged 11 years had a healthy lifestyle. The figures are even smaller at 13 years (3.0%; 95% CI: 1.8, 4.2) and 15 years (1.5%; 95% CI: 0.3, 2.7). This decrease presented a significant trend (−3.3%; 95% CI: −3.6, −2.9).
Behavior of a composite healthy lifestyle measure.
| 11 years (n=21,138)% (95% CI) | 13 years (n=24,816)% (95% CI) | 15 years (n=25,461)% (95% CI) | pb | Difference between 15 and 11 years (95% CI) | |
|---|---|---|---|---|---|
| Boys | |||||
| Healthy lifestyle behavior | |||||
| Physical activity every day | 26.6 (25.4, 27.7) | 23.9 (22.8, 25.0) | 18.9 (17.8, 20.0) | <0.001 | −7.7 (−8.4, −6.9) |
| Screen time <2h/day | 24.7 (23.5, 25.9) | 16.1 (15.0, 17.2) | 12.8 (11.7, 14.0) | <0.001 | −11.9 (−12.6, −11.2) |
| Eats fruits/vegetable daily | 22.5 (21.3, 23.7) | 19.1 (18.0, 20.2) | 16.2 (15.1, 17.3) | <0.001 | −6.3 (−7.0, −5.6) |
| Does not consume alcohol | 89.1 (88.6, 89.5) | 76.9 (76.3, 77.5) | 55.3 (54.4, 56.1) | <0.001 | −33.8 (−34.6, −33.1) |
| Does not smoke | 97.3 (97.1, 97.5) | 91.8 (91.4, 92.2) | 76.7 (76.1, 77.3) | <0.001 | −20.6 (−21.2, −20.1) |
| Number of behaviors reported | |||||
| None | 0.4 (−1.0, 1.7) | 1.7 (0.5, 3.0) | 6.4 (5.2, 7.6) | <0.001 | 6.0 (5.7, 6.3) |
| 1 behavior | 3.9 (2.6, 5.2) | 8.9 (7.7, 10.1) | 19.6 (18.5, 20.7) | <0.001 | 15.7 (15.2, 16.3) |
| 2 behaviors | 27.9 (26.7, 29.0) | 30.9 (29.9, 32.0) | 33.4 (32.4, 34.4) | <0.001 | 5.6 (4.7, 6.4) |
| 3 behaviors | 42.9 (41.9, 43.9) | 39.9 (38.9, 40.9) | 29.6 (28.5, 30.6) | <0.001 | −13.3 (−14.2, −12.5) |
| 4 behaviors | 20.2 (19.0, 21.4) | 15.6 (14.4, 16.7) | 9.5 (8.3, 10.7) | <0.001 | −10.7 (−11.3, −10.0) |
| 5 behaviorsa | 4.7 (3.4, 6.0) | 3.0 (1.8, 4.2) | 1.5 (0.3, 2.7) | <0.001 | −3.3 (−3.6, −2.9) |
| Mean (95% CI) | Mean (95% CI) | Mean (95% CI) | pc | Mean (95% CI) | |
|---|---|---|---|---|---|
| All behaviors | |||||
| Mean of behavior reported | 2.6 (2.6, 2.6) | 2.3 (2.3, 2.3) | 1.8 (1.8, 1.8) | <0.001 | −0.8 (−0.8, −0.8) |
| 11 years (n=22,788)% (95% CI) | 13 years (n=27,207)% (95% CI) | 15 years (n=27,429)% (95% CI) | pb | Difference between 15 and 11 years (95% CI) | |
|---|---|---|---|---|---|
| Girls | |||||
| Healthy lifestyle behavior | |||||
| Physical activity every day | 18.2 (17.0, 19.4) | 12.9 (11.8, 14.0) | 9.4 (8.3, 10.6) | <0.001 | −8.8 (−9.4, −8.2) |
| Screen time <2h/day | 33.3 (32.3, 34.4) | 20.6 (19.5, 21.6) | 18.7 (17.6, 19.8) | <0.001 | −14.6 (−15.4, −13.9) |
| Eats fruits/vegetable daily | 29.3 (28.2, 30.4) | 23.8 (22.8, 24.9) | 22.6 (21.5, 23.6) | <0.001 | −6.7 (−7.5, −5.9) |
| Does not consume alcohol | 93.0 (92.6, 93.3) | 76.8 (76.2, 77.4) | 49.5 (48.7, 50.3) | <0.001 | −43.5 (−44.1, −42.8) |
| Does not smoke | 98.8 (98.7, 99.0) | 92.1 (91.8, 92.4) | 77.3 (76.7, 77.8) | <0.001 | −21.6 (−22.1, −21.0) |
| Number of behaviors reported | |||||
| None | 0.2 (−1.1, 1.5) | 2.4 (1.2, 3.6) | 8.7 (7.6, 9.9) | <0.001 | 8.6 (8.2, 8.9) |
| 1 behavior | 2.8 (1.5, 4.0) | 10.3 (9.2, 11.5) | 23.1 (22.1, 24.1) | <0.001 | 20.4 (19.8, 20.9) |
| 2 behaviors | 29.0 (27.9, 30.1) | 34.6 (33.6, 35.5) | 34.0 (33.0, 35.0) | <0.001 | 5.0 (4.2, 5.8) |
| 3 behaviors | 44.1 (43.1, 45.1) | 37.5 (36.5, 38.4) | 26.1 (25.0, 27.1) | <0.001 | −18.0 (−18.9, −17.2) |
| 4 behaviors | 19.6 (18.4, 20.8) | 13.2 (12.1, 14.4) | 7.2 (6.1, 8.4) | <0.001 | −12.4 (−13.0, −11.8) |
| 5 behaviors | 4.4 (3.2, 5.7) | 2.0 (0.8, 3.2) | 0.8 (−0.3, 2.0) | <0.001 | −1.5 (−1.7, −1.3) |
| Mean (95% CI) | Mean (95% CI) | Mean (95% CI) | pc | Mean (95% CI) | |
|---|---|---|---|---|---|
| All behaviors | |||||
| Mean of behavior reported | 2.7 (2.7, 2.7) | 2.3 (2.3, 2.3) | 1.8 (1.8, 1.8) | <0.001 | −0.9 (−0.9, −0.9) |
CI, confidence interval.
Among girls, practice of physical activity every day was the least prevalent healthy behavior (9.4%, 95% CI: 8.3, 10.6), followed by screen time less than 2h/day (18.7%, 95% CI: 17.6, 19.8), and eating fruit and vegetables every day (22.6%, 95% CI: 21.5, 23.6) at the age of 15. More than 90% of 11 years girls did not consume alcohol (93.0%; 95% CI: 92.6. 93.3) and did not smoke (98.8%; 95% CI: 98.7, 99.0) at the age of 11 years. However, this prevalence decreases by more than 43% for no alcohol consumption and more than 20% for not smoking. Only 4.4% (95% CI: 3.2, 5.7) of girls aged 11 years had a healthy lifestyle. The figures decrease to 2% (95% CI: 0.8, 3.2) at 13 years, and to less than 1% at15 years. This decrease presented a significant trend (−1.5%; 95% CI: −1.7, −1.3).
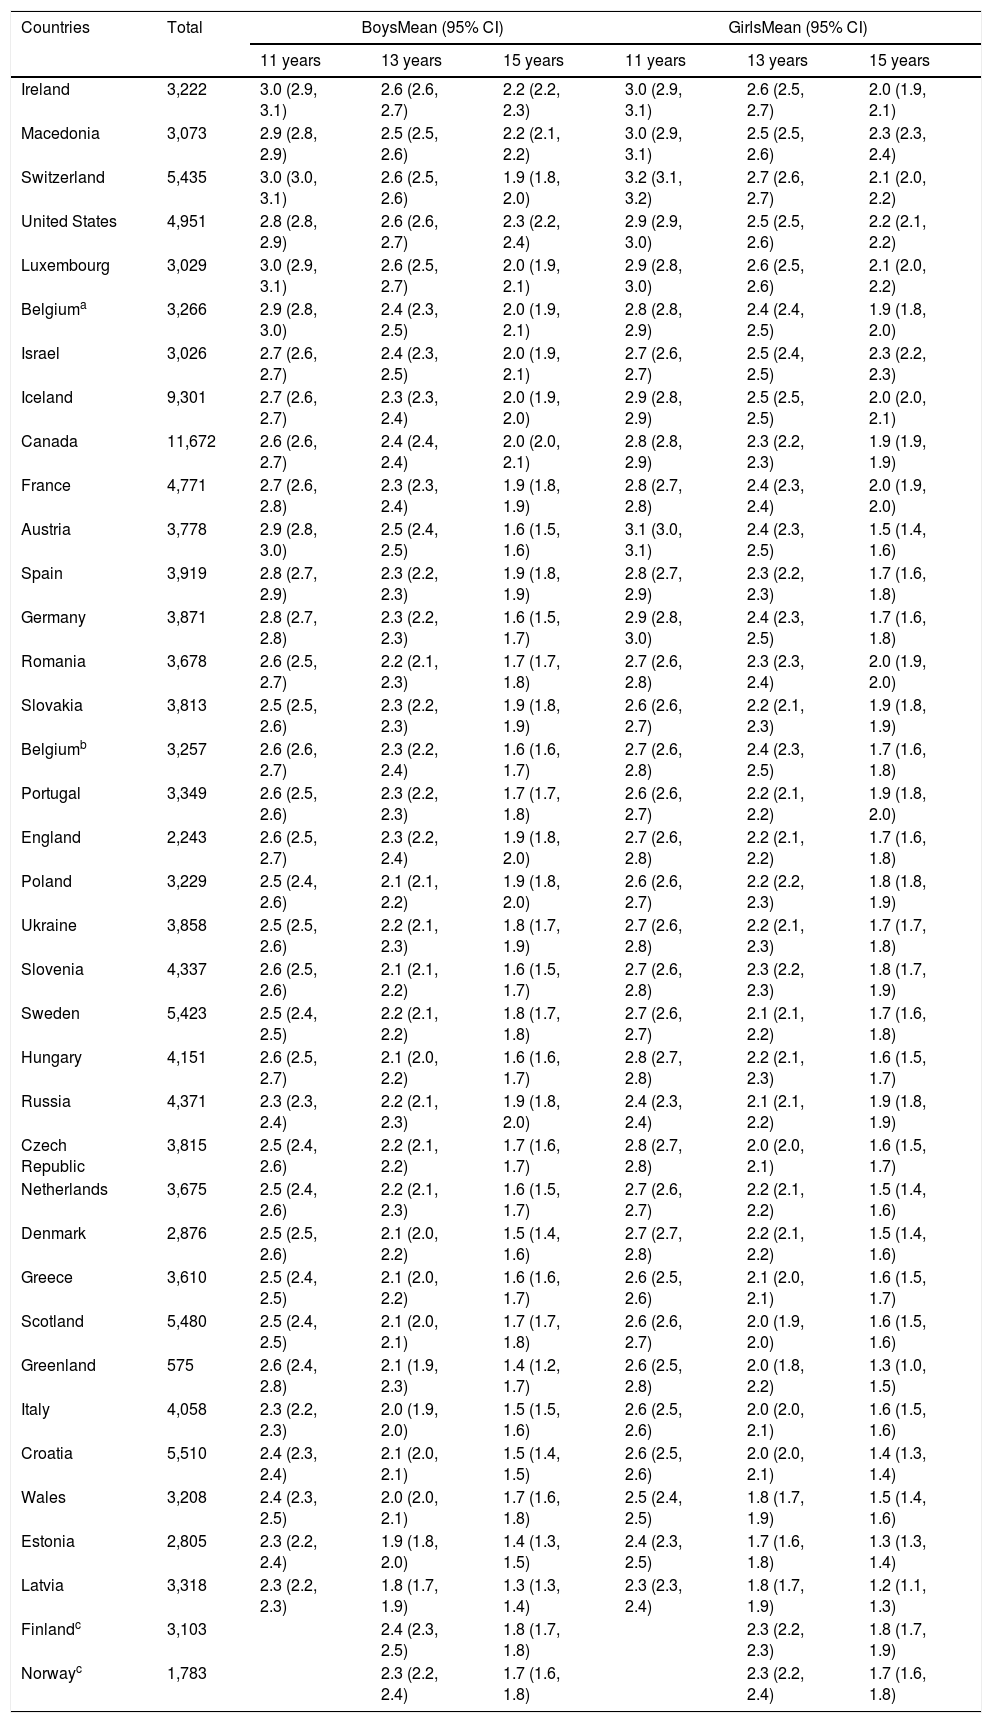
The mean of healthy behaviors by country, stratified by age, is presented in Table 3. The mean of healthy behaviors decreased significantly in all countries from age 11 to age 15.
Mean of healthy behaviors in each HBSC countries.
| Countries | Total | BoysMean (95% CI) | GirlsMean (95% CI) | ||||
|---|---|---|---|---|---|---|---|
| 11 years | 13 years | 15 years | 11 years | 13 years | 15 years | ||
| Ireland | 3,222 | 3.0 (2.9, 3.1) | 2.6 (2.6, 2.7) | 2.2 (2.2, 2.3) | 3.0 (2.9, 3.1) | 2.6 (2.5, 2.7) | 2.0 (1.9, 2.1) |
| Macedonia | 3,073 | 2.9 (2.8, 2.9) | 2.5 (2.5, 2.6) | 2.2 (2.1, 2.2) | 3.0 (2.9, 3.1) | 2.5 (2.5, 2.6) | 2.3 (2.3, 2.4) |
| Switzerland | 5,435 | 3.0 (3.0, 3.1) | 2.6 (2.5, 2.6) | 1.9 (1.8, 2.0) | 3.2 (3.1, 3.2) | 2.7 (2.6, 2.7) | 2.1 (2.0, 2.2) |
| United States | 4,951 | 2.8 (2.8, 2.9) | 2.6 (2.6, 2.7) | 2.3 (2.2, 2.4) | 2.9 (2.9, 3.0) | 2.5 (2.5, 2.6) | 2.2 (2.1, 2.2) |
| Luxembourg | 3,029 | 3.0 (2.9, 3.1) | 2.6 (2.5, 2.7) | 2.0 (1.9, 2.1) | 2.9 (2.8, 3.0) | 2.6 (2.5, 2.6) | 2.1 (2.0, 2.2) |
| Belgiuma | 3,266 | 2.9 (2.8, 3.0) | 2.4 (2.3, 2.5) | 2.0 (1.9, 2.1) | 2.8 (2.8, 2.9) | 2.4 (2.4, 2.5) | 1.9 (1.8, 2.0) |
| Israel | 3,026 | 2.7 (2.6, 2.7) | 2.4 (2.3, 2.5) | 2.0 (1.9, 2.1) | 2.7 (2.6, 2.7) | 2.5 (2.4, 2.5) | 2.3 (2.2, 2.3) |
| Iceland | 9,301 | 2.7 (2.6, 2.7) | 2.3 (2.3, 2.4) | 2.0 (1.9, 2.0) | 2.9 (2.8, 2.9) | 2.5 (2.5, 2.5) | 2.0 (2.0, 2.1) |
| Canada | 11,672 | 2.6 (2.6, 2.7) | 2.4 (2.4, 2.4) | 2.0 (2.0, 2.1) | 2.8 (2.8, 2.9) | 2.3 (2.2, 2.3) | 1.9 (1.9, 1.9) |
| France | 4,771 | 2.7 (2.6, 2.8) | 2.3 (2.3, 2.4) | 1.9 (1.8, 1.9) | 2.8 (2.7, 2.8) | 2.4 (2.3, 2.4) | 2.0 (1.9, 2.0) |
| Austria | 3,778 | 2.9 (2.8, 3.0) | 2.5 (2.4, 2.5) | 1.6 (1.5, 1.6) | 3.1 (3.0, 3.1) | 2.4 (2.3, 2.5) | 1.5 (1.4, 1.6) |
| Spain | 3,919 | 2.8 (2.7, 2.9) | 2.3 (2.2, 2.3) | 1.9 (1.8, 1.9) | 2.8 (2.7, 2.9) | 2.3 (2.2, 2.3) | 1.7 (1.6, 1.8) |
| Germany | 3,871 | 2.8 (2.7, 2.8) | 2.3 (2.2, 2.3) | 1.6 (1.5, 1.7) | 2.9 (2.8, 3.0) | 2.4 (2.3, 2.5) | 1.7 (1.6, 1.8) |
| Romania | 3,678 | 2.6 (2.5, 2.7) | 2.2 (2.1, 2.3) | 1.7 (1.7, 1.8) | 2.7 (2.6, 2.8) | 2.3 (2.3, 2.4) | 2.0 (1.9, 2.0) |
| Slovakia | 3,813 | 2.5 (2.5, 2.6) | 2.3 (2.2, 2.3) | 1.9 (1.8, 1.9) | 2.6 (2.6, 2.7) | 2.2 (2.1, 2.3) | 1.9 (1.8, 1.9) |
| Belgiumb | 3,257 | 2.6 (2.6, 2.7) | 2.3 (2.2, 2.4) | 1.6 (1.6, 1.7) | 2.7 (2.6, 2.8) | 2.4 (2.3, 2.5) | 1.7 (1.6, 1.8) |
| Portugal | 3,349 | 2.6 (2.5, 2.6) | 2.3 (2.2, 2.3) | 1.7 (1.7, 1.8) | 2.6 (2.6, 2.7) | 2.2 (2.1, 2.2) | 1.9 (1.8, 2.0) |
| England | 2,243 | 2.6 (2.5, 2.7) | 2.3 (2.2, 2.4) | 1.9 (1.8, 2.0) | 2.7 (2.6, 2.8) | 2.2 (2.1, 2.2) | 1.7 (1.6, 1.8) |
| Poland | 3,229 | 2.5 (2.4, 2.6) | 2.1 (2.1, 2.2) | 1.9 (1.8, 2.0) | 2.6 (2.6, 2.7) | 2.2 (2.2, 2.3) | 1.8 (1.8, 1.9) |
| Ukraine | 3,858 | 2.5 (2.5, 2.6) | 2.2 (2.1, 2.3) | 1.8 (1.7, 1.9) | 2.7 (2.6, 2.8) | 2.2 (2.1, 2.3) | 1.7 (1.7, 1.8) |
| Slovenia | 4,337 | 2.6 (2.5, 2.6) | 2.1 (2.1, 2.2) | 1.6 (1.5, 1.7) | 2.7 (2.6, 2.8) | 2.3 (2.2, 2.3) | 1.8 (1.7, 1.9) |
| Sweden | 5,423 | 2.5 (2.4, 2.5) | 2.2 (2.1, 2.2) | 1.8 (1.7, 1.8) | 2.7 (2.6, 2.7) | 2.1 (2.1, 2.2) | 1.7 (1.6, 1.8) |
| Hungary | 4,151 | 2.6 (2.5, 2.7) | 2.1 (2.0, 2.2) | 1.6 (1.6, 1.7) | 2.8 (2.7, 2.8) | 2.2 (2.1, 2.3) | 1.6 (1.5, 1.7) |
| Russia | 4,371 | 2.3 (2.3, 2.4) | 2.2 (2.1, 2.3) | 1.9 (1.8, 2.0) | 2.4 (2.3, 2.4) | 2.1 (2.1, 2.2) | 1.9 (1.8, 1.9) |
| Czech Republic | 3,815 | 2.5 (2.4, 2.6) | 2.2 (2.1, 2.2) | 1.7 (1.6, 1.7) | 2.8 (2.7, 2.8) | 2.0 (2.0, 2.1) | 1.6 (1.5, 1.7) |
| Netherlands | 3,675 | 2.5 (2.4, 2.6) | 2.2 (2.1, 2.3) | 1.6 (1.5, 1.7) | 2.7 (2.6, 2.7) | 2.2 (2.1, 2.2) | 1.5 (1.4, 1.6) |
| Denmark | 2,876 | 2.5 (2.5, 2.6) | 2.1 (2.0, 2.2) | 1.5 (1.4, 1.6) | 2.7 (2.7, 2.8) | 2.2 (2.1, 2.2) | 1.5 (1.4, 1.6) |
| Greece | 3,610 | 2.5 (2.4, 2.5) | 2.1 (2.0, 2.2) | 1.6 (1.6, 1.7) | 2.6 (2.5, 2.6) | 2.1 (2.0, 2.1) | 1.6 (1.5, 1.7) |
| Scotland | 5,480 | 2.5 (2.4, 2.5) | 2.1 (2.0, 2.1) | 1.7 (1.7, 1.8) | 2.6 (2.6, 2.7) | 2.0 (1.9, 2.0) | 1.6 (1.5, 1.6) |
| Greenland | 575 | 2.6 (2.4, 2.8) | 2.1 (1.9, 2.3) | 1.4 (1.2, 1.7) | 2.6 (2.5, 2.8) | 2.0 (1.8, 2.2) | 1.3 (1.0, 1.5) |
| Italy | 4,058 | 2.3 (2.2, 2.3) | 2.0 (1.9, 2.0) | 1.5 (1.5, 1.6) | 2.6 (2.5, 2.6) | 2.0 (2.0, 2.1) | 1.6 (1.5, 1.6) |
| Croatia | 5,510 | 2.4 (2.3, 2.4) | 2.1 (2.0, 2.1) | 1.5 (1.4, 1.5) | 2.6 (2.5, 2.6) | 2.0 (2.0, 2.1) | 1.4 (1.3, 1.4) |
| Wales | 3,208 | 2.4 (2.3, 2.5) | 2.0 (2.0, 2.1) | 1.7 (1.6, 1.8) | 2.5 (2.4, 2.5) | 1.8 (1.7, 1.9) | 1.5 (1.4, 1.6) |
| Estonia | 2,805 | 2.3 (2.2, 2.4) | 1.9 (1.8, 2.0) | 1.4 (1.3, 1.5) | 2.4 (2.3, 2.5) | 1.7 (1.6, 1.8) | 1.3 (1.3, 1.4) |
| Latvia | 3,318 | 2.3 (2.2, 2.3) | 1.8 (1.7, 1.9) | 1.3 (1.3, 1.4) | 2.3 (2.3, 2.4) | 1.8 (1.7, 1.9) | 1.2 (1.1, 1.3) |
| Finlandc | 3,103 | 2.4 (2.3, 2.5) | 1.8 (1.7, 1.8) | 2.3 (2.2, 2.3) | 1.8 (1.7, 1.9) | ||
| Norwayc | 1,783 | 2.3 (2.2, 2.4) | 1.7 (1.6, 1.8) | 2.3 (2.2, 2.4) | 1.7 (1.6, 1.8) | ||
CI, confidence interval.
There were no data for adolescents aged 11 years. The comparison was made between those aged 15 and 13 years.
Differences among ages were tested by ANCOVA. Analyses were adjusted for living with mother, living with father, having brothers or sisters and family affluence scale.
In all countries, significant differences of mean of behavior reported among ages were observed (p<0.001).
Countries were sorted by the general mean of healthy behaviors reported.
This study aimed to examine the association between age and changes in self-reported prevalence of healthy behaviors in adolescents. As age increased, the prevalence of adolescents with a healthy lifestyle decreased. Only 4.7% of boys and 4.4% of girls aged 11 years, 3.0% of boys and 2.0% of girls aged 13 years, and 1.5% of boys and 0.8% of girls aged 15 scored perfectly on the healthy lifestyle score. Since a healthy lifestyle has a positive impact on health and is essential to prevent early onset of chronic diseases,4 these results show that most adolescents are at risk. The choices in regards to health during adolescence may jeopardize their future health.
Concerning physical activity, a strong decrease in its practice was observed from 11 to 15 years of age. All countries and regions were similar in showing a decrease of physical activity by age. The physical activity decrease by age was also documented in previous studies using objective measures of physical activity.19,20 As adolescents age, they gain more independence and are exposed to other environments and influences (e.g., school and peers). Furthermore, the cost of activities also influences the decrease of physical activity with age. Physical activity during childhood is mostly informal. However, adolescents tend to practice formal physical activity, which has associated economic costs (e.g., membership, purchase of equipment). Thus, among socioeconomically disadvantaged adolescents, there are less opportunities; naturally, the number of participants decreases with age.
In line with previous studies,21,22 screen time behavior increases throughout adolescence. This trend tends to increase given that new media screen time has significantly increased in recent years, especially after smartphones and similar portable devices such as tablets gained over 50% market saturation among adolescents.23 This finding probably reflects two realities for adolescents: increased academic demands and a higher need for social interaction. Nowadays, many screen electronic components might be used as tools to help students with homework and diverse school content.22
The decrease in the consumption of fruits and vegetables in adolescence has been observed,24 and age is considered a determinant factor in this intake.25 The decreasing trend of fruit and vegetable consumption begins in childhood and continues into young adulthood.26 From early to mid-adolescence, this decreasing trajectory stands out from multiple changes in lifestyle, and both physical and environmental aspects that take place in adolescence, such as peer influence or availability in schools.25 The greater freedom in food choice experienced by adolescents and the level of support for fruit and vegetable consumption during this phase might explain the decrease in fruit and vegetable consumption throughout adolescence.24
Concerning alcohol and tobacco use, these behaviors tend to be clustered; trajectories of the consumption of these substances are linked.27 As age increases, the consumption of alcohol and use of tobacco also increases. Among the healthy behaviors, these presented a bigger decrease with age. The same trend had been previously observed,27 meaning that the transition from early adolescence to mid-adolescence is a critical period for alcohol consumption and tobacco use.
The general decrease in the prevalence of healthy behaviors with age shows that adolescents have a lifestyle that harms their health and jeopardizes it in the future. This was clearly demonstrated in the present study, in which less than 2% at the age of 15 had a healthy lifestyle. As demonstrated, adolescents become more independent with age; they start to have different interests, suffer marked influence from peers, and spend more time at school without parent supervision. Thus, interventions are needed to reverse the increase in the prevalence of unhealthy lifestyles. Schools are a gateway to provide adolescents with skills to manage and improve their lifestyle.28 Virtually all adolescents attend school, spending much time there; in schools, they are subjected to the transmission of knowledge that can be used to improve their health. There is evidence that school-based single-component or multicomponent interventions can improve short- and long-term adolescents’ healthy behaviors.24,25,28 Therefore, a large number of adolescents could benefit from these interventions.
This study has strengths and limitations that should be acknowledged. One strong point is that the findings are from an international study comprising 42 countries with the same standardized instruments, which allows comparisons. A noteworthy strength is the fact that only 5% of the participants have low family affluence scale. This gives hope to generalize the findings, because there is not much variation among the adolescents’ socioeconomic status. The HBSC database contains numerous missing values. Over 40,000 adolescents did not report the healthy behaviors and were excluded from the data analysis, because it was not possible to create a healthy lifestyle composite score based on the five healthy behaviors. Data collection was based on self-reported information, which is subject to bias. Furthermore, eating fruits or vegetables daily does not mean the adolescents necessarily consumed the recommended servings. It would be important to accurately measure fruit and vegetable consumption to determine whether it meets the guidelines.15 Lastly, the cross-sectional design precludes a causal inference for the relationship between a healthy lifestyle and age.
Results from this study highlight the fact that there is still much work to be done to promote healthy lifestyles and to raise awareness among adolescents of the potential benefits to their health status. Given that it known that health behaviors are set during this developmental period, understanding how best to promote healthy lifestyles is still of crucial importance during this life phase. It is also important to highlight that the lower prevalence of adolescents with a healthy lifestyle appears to corroborate that unhealthy behaviors tend to cluster.29 Schools also can improve adolescents’ lifestyle through knowledge. It is important to teach adolescents the physical guidelines,13 the health problems associated with time in screen-based behaviors,30 the recommendation for the amount of time that can be devoted to these behaviors,14 the habits of healthy eating, the recommended daily consumption of fruit and vegetables,15,16 and the benefits of abstinence from alcohol consumption18 and tobacco usage. Knowledge may not be sufficient to improve the adolescents’ lifestyles, but having knowledge put into practice could be a step closer to raising awareness of the importance of healthy behaviors, with the intent that the younger generation may make educated decisions about their health.
Conflicts of interestThe authors declare no conflicts of interest.
Please cite this article as: Marques A, Loureiro N, Avelar-Rosa B, Naia A, Matos MG. Adolescents’ healthy lifestyle. J Pediatr (Rio J). 2020;96:217–24.


