To assess the agreement between the results of the Subjective Global Nutritional Assessment questionnaire, adapted for children and adolescents of the Brazilian population, and the nutritional status assessment method through growth curves and the classification of the World Health Organization in a pediatric hospital service.
MethodsThis was an analytical, quantitative, cross-sectional study. During the data collection period, the nutritional status of all patients from 0 to 12 years of age, admitted to the pediatric unit of a university hospital, was concomitantly assessed according to the Subjective Global Nutritional Assessment and World Health Organization curves. To determine the assessment and agreement between these methods, the Kappa and Kendall coefficients were used, respectively, considering a significance level of 5%.
ResultsSixty-one children participated, with a predominance of males. It was observed that the highest frequency of equivalent results occurred among the group classified as well nourished, and that only the height/age variable showed a close agreement between the methods. Additionally, there was a good correlation only for the weight/height variable between the assessment tools used.
ConclusionDue to the low agreement between the methods, the combination of both may be beneficial for the nutritional assessment of pediatric patients, collaborating with the early diagnosis of nutritional alterations and facilitating the use of adequate dietary therapy.
Avaliar a concordância entre os resultados do questionário da Avaliação Nutricional Subjetiva Global adaptado para crianças e adolescentes da população brasileira e do método de avaliação do estado nutricional por meio de curvas de crescimento e a classificação da Organização Mundial da Saúde em um serviço pediátrico hospitalar.
MétodosTrata-se de um estudo analítico, quantitativo, de caráter transversal. Durante o período de coleta de dados, foi avaliado o estado nutricional de todos os pacientes de zero a doze anos admitidos na Enfermaria de Pediatria de um hospital universitário segundo a Avaliação Nutricional Subjetiva Global as curvas da Organização Mundial da Saúde, concomitantemente. Para determinar a avaliação e a concordância entre estes métodos, os coeficientes de Kappa e de Kendall foram utilizados, respectivamente, considerando nível de significância de 5%.
ResultadosParticiparam do trabalho 61 crianças, com predominância do sexo masculino. Observou-se que a maior frequência de resultados iguais ocorreu entre o grupo classificado como bem nutrido, e que somente a variável altura/idade demonstrou íntima concordância entre os métodos. Além disso, verificou-se uma boa correlação somente para a variável peso/altura entre os instrumentos utilizados.
ConclusãoDevido à baixa concordância entre os métodos, a combinação de ambos pode ser benéfica para a avaliação nutricional dos pacientes pediátricos colaborando com o diagnóstico precoce de alterações nutricionais, facilitando a aplicação do tratamento dietoterápico adequado.
The integration of nutritional assessment into the complex routine of child hospitalization is essential, regardless of the severity and risks of morbidity and mortality associated with it.1 This is due to the possibility of identifying the presence of nutritional disorders, such as malnutrition and obesity, which may be associated with diseases and/or other unfavorable social conditions.2,3
Child malnutrition is considered the second most common cause of death among children under 5 years of age in developing countries. At this stage of life, malnutrition results in a loss of physical growth and neuropsychomotor development, and causes greater vulnerability to several comorbidities4 and, consequently, a greater risk of hospital admission.1
Hospitalization, in turn, is a risk factor for the development and/or worsening of malnutrition, as it often causes a loss in the nutritional status of the pediatric patient. This nutritional impairment can significantly affect morbidity and mortality rates, as well as length of hospital stay and hospitalization costs. Thus, there will be a lower hospital bed turnover rate, which consequently hinders the service to the population.1 Therefore, it is essential to perform the early nutritional assessment of all these patients at admission, to diagnose not only malnutrition but also the risk of nutritional status impairment of this group.5
According to Resolution No. 304/2003 of the Federal Council of Nutritionists, the implementation of nutritional assessment and diagnosis through anthropometric, biochemical, clinical, and dietary data favors the creation of an adequate nutritional care plan.6 Ideally, the nutritional assessment should be quick, practical, easy to apply, noninvasive, and capable of being performed at the bedside. Additionally, it is important that it can provide a result as fast as possible.7
Anthropometrics is a widely used science to assess, classify, and monitor nutritional status8 in several age groups, such as in childhood and adolescence, and it allows the perception of growth variations.1 In pediatric patients, the most often used anthropometric data for the analysis of nutritional status are weight, height, weight-to-height ratio, and body mass index (BMI),8 which are assessed according to the curves and reference values created by the World Health Organization (WHO) according to gender and age group; and the use of weight/age, height/age, weight/height, and BMI/age indexes.9,10 In Brazil, the Food and Nutrition Surveillance System (Sistema de Vigilância Alimentar e Nutricional [SISVAN]) suggests that the classification of nutritional status must be based on these curves.11
In addition to anthropometrics, screening methods have been widely used aiming at identifying malnutrition or the risk of developing it.8 In adults, the use of these methods is well established. However, in the case of pediatric patients, there is no consensus on the best technique for nutritional risk screening at the time of hospital admission and during hospitalization.8
There are some tools in the literature used for nutritional screening in pediatric patients. Overall, these tools correlate anthropometric data and patient history information, such as weight history, presence of disease, gastrointestinal symptoms, and food intake data. The best-known pediatric screening tools include the STAMP tool (Screening Tool for the Assessment of Malnutrition in Pediatrics),12 Pediatric Nutritional Risk Score,13 Pediatric Yorkhill Malnutrition Score,14 Strong Kids,15 and Subjective Global Nutritional Assessment (SGNA) for children.16 However, only the last two have been translated into Portuguese and validated for the Brazilian population.8
In 2007, the SGNA questionnaire was adapted for the pediatric age group by Secker and Jeejeebhoy.16 It was validated for this same group in the Brazilian population by Carniel et al., in 2015.17 In the field of child and adolescent health, for the purposes of nutritional assessment, the use of the WHO growth curves9,10 and the nutritional status classification proposed by them are already well known, and have been recognized regarding their importance in the nutritional diagnosis of this population. However, this methodology can identify malnutrition only after it is installed, i.e., it does not allow the detection of milder degrees of malnutrition and/or the risk of developing it.18 Thus, in the individual assessment, anthropometric data are more significant for follow-up, since they allow verifying whether the growth rate considered normal is maintained.19
For this reason, new nutritional assessment tools for this target population are being developed with the objective of improving existing resources. However, it is crucial that these new tools be tested to evaluate their applicability and agreement with other methods already used in the pediatric age group.18 Additionally, few studies have used the SGNA in pediatric patients, or compared their results with methods currently more widely used in the evaluation of children and adolescents, such as the WHO curves.
Thus, the objective of this study was to evaluate the agreement between the results of the SGNA questionnaire, adapted for children and adolescents of the Brazilian population, and the nutritional status assessment method through the WHO growth curves and classification in a pediatric hospital service.
MethodsStudy participants and designThis was an analytical, quantitative, and cross-sectional study, in which two nutritional assessment tools were concomitantly applied to patients aged 1 month to 12 years, of both genders, hospitalized for clinical and/or surgical reasons in the Pediatric Ward of Hospital das Clínicas de Uberlândia of Universidade Federal de Uberlândia (HCU-UFU), who accepted to participate in the study and had the informed consent form signed by their parents/guardians.
All children with a diagnosis of genetic syndromes, cerebral palsy, or chronic renal failure were excluded from the study. The data collection protocol was applied from June to August 2016, due to higher number of hospitalizations during the same period in 2015.
The work was approved by the Human Research Ethics Committee of Universidade Federal de Uberlândia (UFU) (1,585,335/2016).
ToolsThe collection of anthropometric data, weight, and height, and the application of the SGNA questionnaires adapted to pediatric patients proposed by Carniel et al. (2015)17 were carried out within a maximum period of 72h after the patients’ hospitalization in the service, as recommended by the 2011 Project Guidelines.20 These measurements were used for the nutritional assessment proposed by this SGNA questionnaire,17 which has different versions for children younger than 2 and older than 2 years of age, and for nutritional assessment through the WHO curves.9,10
Children aged 1 month to 2 years were weighed without clothing and diapers, while those older than 2 were weighed wearing the pajamas provided by the hospital and without shoes, both on electronic scales available at the service.
The height of children younger than 2 years and with a length of less than 100cm was measured with the aid of a graduated anthropometric ruler, with the patient in the supine position. The other children were measured in the vertical position, using a manual stadiometer with a mobile cursor.
The BMI value was obtained using the Quetelet formula, calculated by the weight (kg)/height2 (m2). Premature children were assessed at their respective corrected age up to 2 years of age.
To evaluate the agreement between the results obtained, the nutritional status of all patients was evaluated by the SGNA and by the WHO growth curves,9,10 a method currently used in the pediatric ward to classify the nutritional status of hospitalized patients.
When using the SGNA, the individual was classified according to a global score as: (a) well nourished, when the child is growing normally, with adequate food consumption and without gastrointestinal symptoms; (b) moderately malnourished, when the patient shows signs of weight loss or loss of food consumption, functional capacity, and reduced muscle mass, demonstrating nutritional status impairment, when it was previously normal; and (c) severely malnourished, when the child has progressive malnutrition, with weight loss, reduction of muscle and fat mass, and loss of food consumption.
For the purpose of comparison, WHO classifications were grouped according to the classification proposed in the SGNA, as follows: children classified as very thin according to the WHO were considered to be severely malnourished, while those classified as thin were considered moderately malnourished, and finally those with normal weight, at risk of overweight, overweight, and obese were grouped in the well-nourished classification.
The WHO Anthro (World Health Organization, Geneva, Switzerland)21 and WHO Anthro Plus (World Health Organization, Geneva, Switzerland)22 computer programs were used to determine the Z-score of weight/age (up to 10 years), height/age, weight/height (up to 5 years), and BMI/age curves of children of all age groups.
The SGNA17 questionnaire application and the collection of anthropometric data, as well as their classification according to the WHO curves,9,10 were performed by the same observer, who was trained and qualified for this function. The same research and assessment protocol was used for all patients.
Statistical analysisTo estimate the sample size, the G*POWER23 computer program was used for power analysis. Aiming to estimate the minimum sample size, considering the two-tailed hypothesis and the parameters of significance level (α=0.05), test power (1−β=0.95), and effect size (Cohen's d=0, 50), a minimum sample size of 34 individuals was obtained.23,24
Initially, data normality was verified with the Shapiro–Wilks test. Parametric data are shown as means and standard deviations, and non-parametric data are shown as medians and interquartile range.
To compare the proportions between the variables, the chi-squared test or Fisher's exact test was used. Cohen's kappa coefficient was used to evaluate the agreement between the methods. The Kendall coefficient was used to analyze the association between the methods. The level of significance was adjusted to 5% in all analyses.
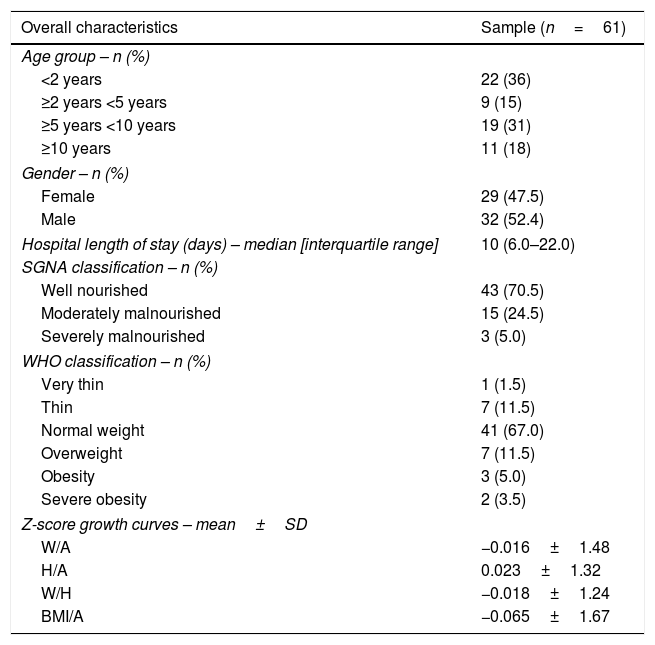
ResultsThe characterization of the studied sample is described in Table 1, which consisted of 61 hospitalized children, aged between 1 and 155 months. There was a predominance of males (52.4%) and children younger than 2 years (36%) in the sample, with 47.5% females. The median hospital length of stay was ten days.
Demographic characteristics and nutritional status by the Subjective Global Nutritional Assessment (SGNA) method and growth curves (weight/age, height/age, weight/height, and BMI/age) in children and adolescents.
| Overall characteristics | Sample (n=61) |
|---|---|
| Age group – n (%) | |
| <2 years | 22 (36) |
| ≥2 years <5 years | 9 (15) |
| ≥5 years <10 years | 19 (31) |
| ≥10 years | 11 (18) |
| Gender – n (%) | |
| Female | 29 (47.5) |
| Male | 32 (52.4) |
| Hospital length of stay (days) – median [interquartile range] | 10 (6.0–22.0) |
| SGNA classification – n (%) | |
| Well nourished | 43 (70.5) |
| Moderately malnourished | 15 (24.5) |
| Severely malnourished | 3 (5.0) |
| WHO classification – n (%) | |
| Very thin | 1 (1.5) |
| Thin | 7 (11.5) |
| Normal weight | 41 (67.0) |
| Overweight | 7 (11.5) |
| Obesity | 3 (5.0) |
| Severe obesity | 2 (3.5) |
| Z-score growth curves – mean±SD | |
| W/A | −0.016±1.48 |
| H/A | 0.023±1.32 |
| W/H | −0.018±1.24 |
| BMI/A | −0.065±1.67 |
WHO, World Health Organization; W, weight; A, age; H, height; BMI, body mass index.
Most patients who participated in the study were classified as well nourished by the SGNA (70.5%) and as normal weight according to the WHO (67%), while the lowest percentages were found for severely malnourished and very thin children, according to the SGNA (5%) and WHO (1.5%), respectively.
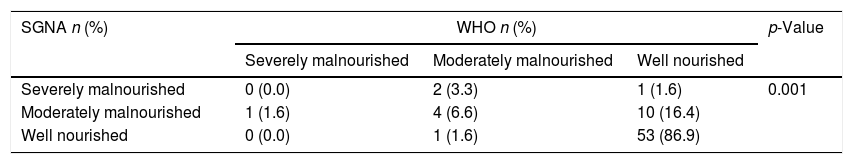
The frequencies of each classification (severely malnourished, moderately malnourished, and well-nourished) were analyzed for each of the assessed methods (Table 2), noting that there was a difference in the frequencies between them (p=0.001).
Frequency of severely malnourished, moderately malnourished, and well-nourished individuals by the Subjective Global Nutrition Assessment (SGNA) method and WHO growth curves in children and adolescents (n=61).
| SGNA n (%) | WHO n (%) | p-Value | ||
|---|---|---|---|---|
| Severely malnourished | Moderately malnourished | Well nourished | ||
| Severely malnourished | 0 (0.0) | 2 (3.3) | 1 (1.6) | 0.001 |
| Moderately malnourished | 1 (1.6) | 4 (6.6) | 10 (16.4) | |
| Well nourished | 0 (0.0) | 1 (1.6) | 53 (86.9) | |
WHO, World Health Organization.
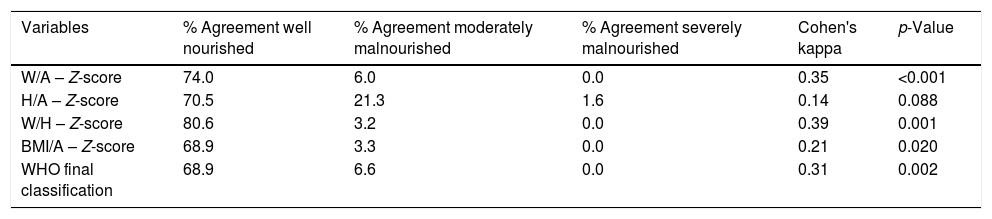
When assessing the agreement between the two tools, it was verified that all growth curves showed agreement with the SGNA, except for height/age. However, the degree of this agreement is classified as low (0.20–0.40)25 (Table 3).
Agreement between the Subjective Global Nutritional Assessment (SGNA) method and WHO growth curves in children and adolescents (weight/age, height/age, weight/height, BMI/age).
| Variables | % Agreement well nourished | % Agreement moderately malnourished | % Agreement severely malnourished | Cohen's kappa | p-Value |
|---|---|---|---|---|---|
| W/A – Z-score | 74.0 | 6.0 | 0.0 | 0.35 | <0.001 |
| H/A – Z-score | 70.5 | 21.3 | 1.6 | 0.14 | 0.088 |
| W/H – Z-score | 80.6 | 3.2 | 0.0 | 0.39 | 0.001 |
| BMI/A – Z-score | 68.9 | 3.3 | 0.0 | 0.21 | 0.020 |
| WHO final classification | 68.9 | 6.6 | 0.0 | 0.31 | 0.002 |
W, weight; A, age; H, height; BMI, body mass index; WHO, World Health Organization.
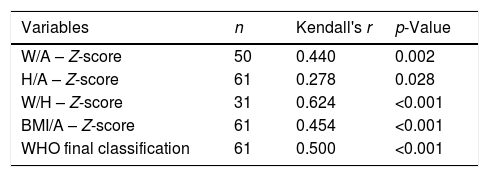
In the analysis of the association between the nutritional assessment techniques, it was observed that the variables weight/height, BMI/age, and the final WHO classification were associated with SGNA (p<0.001) and also with the weight/age (p=0.002) and height/age (p=0.028) variables. The Kendall coefficient values showed associations ranging from low (0.20–0.39) to good (0.60–0.79),26 especially the weight/height variable, which showed a considerable (0.624) association with the SGNA (Table 4).
Association between the Subjective Global Nutritional Assessment (SGNA) method and WHO growth curves in children and adolescents (weight/age, height/age, weight/height, BMI/age).
| Variables | n | Kendall's r | p-Value |
|---|---|---|---|
| W/A – Z-score | 50 | 0.440 | 0.002 |
| H/A – Z-score | 61 | 0.278 | 0.028 |
| W/H – Z-score | 31 | 0.624 | <0.001 |
| BMI/A – Z-score | 61 | 0.454 | <0.001 |
| WHO final classification | 61 | 0.500 | <0.001 |
W, weight; A, age; H, height; BMI, body mass index; WHO, World Health Organization.
When concomitantly evaluating the patients according to the SGNA17 and the WHO,9,10 it was verified that most patients were classified as well-nourished and normal weight, respectively. Therefore, the greatest disagreements were found among the groups classified as moderately or severely malnourished, where the percentage of diagnosis of malnourished patients was higher in the SGNA than in the WHO curves. It was observed that of 11 patients classified as malnourished by the subjective assessment (one severely malnourished and ten moderately malnourished), all were considered well nourished by the WHO classification.
In 2006, Yamauti7 found a similar result when comparing nutritional diagnoses obtained by the SGNA and anthropometrics in adult patients with heart disease, in which there was a prevalence of malnutrition that was 9.4% higher by the SGNA than by anthropometrics. Similarly, in 1996, the study by Ek et al.,27 when comparing the same methods in hospitalized elderly individuals, also observed that the number of patients classified as malnourished by subjective methods exceeded that identified by objective methods.
These differences can be explained by the fact that the subjective methodology consists of qualitative questions, and thus, it is efficient in the early identification of nutritional risk and nutritional alterations.28
This can be explained by the fact that the SGNA questionnaire addresses some of the points that actually improve the study of the child's nutritional status, such as weight loss, anthropometric birth data for children younger than 2 years (weight and length), home eating habits, presence of gastrointestinal symptoms, physical examination, etc. For this reason, it is able to detect signs of malnutrition that might go undetected when considering only weight, height, and BMI in the nutritional assessment, as in the case of the classification according to the WHO curves.28
In the present study, it was observed that the nutritional statuses generated by the SGNA and the WHO have a low agreement. In 2014, Carniel18 similarly observed a low agreement (0.38, p=0.001) between the weight/height variable and the SGNA, whereas for the other variables, agreement levels were different from those found in this study.
Possibly, the combination of objective and subjective data proposed in the SGNA contributes to the fact that the final classifications of the methodologies disagree, which shows the importance of using both tools in clinical practice as complementary techniques for an adequate nutritional diagnosis.18
Based on the association between the nutritional assessment methods, it was verified that the weight/height variable showed a strong and positive correlation between the applied methods, unlike the others, which showed lower levels of correlation. This can be explained by the fact that weight/height index assesses whether the child's weight is adequate for her height, thus demonstrating the proportionality between these two measurements and eliminating the age element.18
These results demonstrate the importance of performing the nutritional assessment through objective and subjective methods at hospital admission, aiming to identify malnourished patients and/or those at nutritional risk. The early diagnosis of these conditions allows the establishment of an adequate diet therapy, which contributes to the treatment and improvement of the prognosis and hospital discharge of the individual. As demonstrated by Baccaro et al. in 2007,29 who evaluated the nutritional status of patients in a hospital in Argentina, malnourished patients were hospitalized for a period longer than seven days (on average) than patients with normal weight. Moreover, among the patients who died, 62.5% belonged to the group classified as severely malnourished.
Furthermore, the SGNA allows the concise and rapid collection of a large part of the patient's history, and also identifies those at greater nutritional risk who need a more careful investigation of their clinical history, indicating which individuals require a more intense follow-up, preventing the worsening of the nutritional picture. The same was observed by Rocha et al. in 2006,30 who evaluated the nutritional status of children younger than 5 years evaluated at admission and at hospital discharge. They found that 51.6% of the patients had weight loss during hospitalization, and 9.17% of the children with normal weight prior to hospital admission had their nutritional condition worsen during hospitalization.
However, the SGNA also has limitations, namely the need for training and experience of the observer, which is an important factor for the test accuracy, since the assessment accuracy depends on the ability to recognize nutritional variations. In addition, because it is a qualitative method, it has low sensitivity to identify small nutritional status alterations, and therefore it is not a good tool to follow the patient's evolution, with objective methods being more adequate in this case.28
At the same time, another negative point observed in the present study was the non-differentiation between children with normal weight from those with overweight and/or obesity, as proposed by the WHO classification.9,10 Therefore, all of these patients, although showing very different nutritional diagnoses and requiring diverse dietary therapies, are classified as well-nourished, which may induce errors. As well as the malnourished patients, those who are overweight also need special care, since this condition also characterizes a nutritional status imbalance and increases the risk of developing chronic diseases and, consequently, morbidity and mortality.
The fact that the assessments were made by only one observer is also a limitation of the present study, which could lead to a aferition bias. However, every precaution was taken to minimize possible errors. Furthermore, the authors emphasize the need for further studies that address this issue.
Low agreement was found among the assessed methods. Thus, in the absence of a gold standard method, it is concluded that the combination of objective and subjective methods, such as anthropometric assessment through the WHO curves and the SGNA, may be beneficial for pediatric patients, since it allows the early diagnosis of nutritional alterations and/or nutritional risk. Consequently, this indication can help in the creation of an adequate dietary therapy to minimize the risks of compromising the growth and development of the pediatric patient.
Conflicts of interestThe authors declare no conflicts of interest.
Please cite this article as: Pimenta FS, Oliveira CM, Hattori WT, Teixeira KR. Agreement between Subjective Global Nutritional Assessment and the nutritional assessment of the World Health Organization. J Pediatr (Rio J). 2018;94:602–8.


