The purpose of this study was to evaluate the antioxidant status of plasma vitamin E and plasma and intracellular coenzyme Q10 in children with type 1 diabetes.
MethodThis case–control study was conducted on 72 children with type 1 diabetes and compared to 48 healthy children, who were age, sex, and ethnicity-matched. The diabetic children were divided according to their glycosylated hemoglobin (A1c %) into two groups: poor and good glycemic control groups. All children underwent full history taking, clinical examination, and laboratory measurement of complete blood count, A1c %, plasma cholesterol, triglycerides, and vitamin E levels and coenzyme Q10 levels in plasma, erythrocytes, and platelets.
ResultsChildren with poor glycemic control showed significantly higher plasma vitamin E, coenzyme Q10, triglycerides, low-density lipoproteins, waist circumference/height ratio, cholesterol levels, and lower high-density lipoproteins and platelet coenzyme Q10 redox status in comparison to those with good glycemic control and the control group (p<0.05). Plasma coenzyme Q10 showed a positive correlation with the duration of type 1 diabetes, triglycerides, cholesterol, vitamin E, and A1c %, and negative correlation with the age of the diabetic group (p<0.05). The platelet redox status showed a negative correlation with the A1c % levels (r=−0.31; p=0.022) and the duration of type 1 diabetes (r=−0.35, p=0.012).
ConclusionPatients with type 1 diabetes, especially poorly controlled, had elevation of plasma vitamin E and coenzyme Q10 levels and decreased platelet redox status of coenzyme Q10, which may be an indicator of increased oxidative stress.
Avaliar o estado antioxidante da vitamina E no plasma e da coenzima Q10 no plasma e intracelular em crianças com diabetes tipo 1.
MétodoEste estudo caso-controle foi realizado em 72 crianças com diabetes tipo 1 comparadas comparado por idade, sexo e etnia de 58 crianças saudáveis. As crianças diabéticas foram divididas em dois grupos de acordo com sua hemoglobina glicosilada (A1c %): grupos de controle glicêmico bom e baixo. Todas as crianças foram submetidas a anamnese total, exame clínico e laboratorial para hemograma completo, A1c %, colesterol no plasma, triglicerídeos e níveis de vitamina E e níveis de coenzima Q10 no plasma, eritrócitos e plaquetas.
ResultadosAs crianças com baixo controle glicêmico mostraram nível de vitamina E no plasma significativamente maior, coenzima Q10, triglicerídeos, lipoproteína de baixa densidade, proporção da circunferência da cintura/estatura e níveis de colesterol e menor nível de lipoproteína de alta densidade e estado redox da coenzima Q10 em comparação aos com bom controle glicêmico com o grupo de controle (p < 0,05). A coenzima Q10 no plasma mostrou correlação positiva com a duração da diabetes tipo 1, triglicerídeos, colesterol, vitamina E e A1c % e correlação negativa com a idade do grupo diabético (p < 0,05). O estado redox das plaquetas mostrou correlação negativa com os níveis de A1c % (r = -0,31; p = 0,022) e a duração da diabetes tipo 1 (r = -0,35, p = 0,012).
ConclusãoOs pacientes com diabetes tipo 1, principalmente mal controlados, apresentaram aumento nos níveis de vitamina E no plasma e coenzima Q10 e redução no estado redox das plaquetas da coenzima Q10 que podem indicar aumento do estresse oxidativo.
Diabetes mellitus (DM) is a metabolic syndrome characterized by disturbed glucose homeostasis. Hyperglycemia that occurs with DM leads to more production of oxygen free radicals, oxidative stress, and diabetic complications.1,2 Children with diabetes are liable to increase oxidative stress by different mechanisms, including glucose auto-oxidation and non-enzymatic protein glycation.3 Varieties of natural antioxidants exist to eliminate oxygen free radicals and prevent oxidative damage to biological membranes. These natural antioxidants may be of dietary sources like vitamin A, C, E, and carotenoids or intracellular enzymatic antioxidants, which include superoxide dismutase, glutathione peroxidase, and catalase. In addition to enzymatic antioxidants, numerous small molecules are synthesized or produced within the body that have an antioxidant capacity (e.g. glutathione and uric acid).4–6 Vitamin E and coenzyme Q10 are considered as indices of antioxidant capacity. Vitamin E is an important chain-breaking antioxidant factor controlling low-density lipoprotein oxidation. Coenzyme Q10 is an electron carrier-proton translocator in the respiratory chain of mitochondria, and is known as a potent antioxidant either by direct removal of free radicals or indirect by regeneration of vitamin E. Changes in the redox status of coenzyme Q10 may be regarded as an indicator of oxidative stress.7 Few studies have been done on the vitamin E and coenzyme Q10 antioxidant status in type 1 diabetes (T1D).8 Therefore, the purpose of this study is to evaluate the antioxidant status of plasma vitamin E and plasma and intracellular coenzyme Q10 in children with T1D.
MethodsA case–control study was conducted in the Al-Jedaani Hospital and the Ibn-Sina National College Hospital in Jeddah, Saudi Arabia during the period from November 2014 to July 2016. The study included 72 children with T1D and 48 healthy children, who were age, sex, and ethnicity-matched as a control group. All patients were being treated with insulin and did not receive multivitamins in the previous three months. Written consent was obtained from their parents/guardians before the study, and the study was approved by the local ethical committee from Al-Jedaani Hospital and Ibn-Sina National College Hospital. Patients with T1D were divided according to glycosylated hemoglobin % (A1c %) into two groups;
Group 1: included 34 children with good glycemic control, with A1c % <7.5%.
Group 2: included 38 children with poor glycemic control, with A1c % ≥7.5%.
All studied groups were subjected to:
- 1.
Full history-taking regarding the onset of disease, insulin intake, dietary habits, and blood glucose monitoring.
- 2.
Anthropometric measures for each child; height, weight, and waist circumference were measured. The height was measured to the nearest 0.1cm using a Holtain portable anthropometer (manufactured at Holtain's global headquarters in Wales), and the weight was determined to the nearest 0.01kg using a Seca scale balance (Seca – Germany) with the patient dressed in minimal clothes and without shoes. Waist circumference (WC) was measured at the level of the umbilicus with the child standing and breathing normally, and waist circumference to height (WC/HT) was calculated. Each measurement was taken as the mean of three consecutive measurements, using standardized equipment and following the recommendations of the International Biological Program.9
- 3.
Laboratory investigations: included routine and specific laboratory tests.
The blood was taken from all subjects of study, and each sample was divided into two samples and stored at −84°C. One 2mL sample of blood was collected into EDTA-coated tubes to evaluate the coenzyme Q10 level and its redox status (percentage of oxidized coenzyme Q10 within total coenzyme Q10) in erythrocytes and platelets. Another blood sample of 1mL was collected with heparin for analysis of plasma vitamin E, cholesterol, and coenzyme Q10 levels and its redox status.
Routine laboratory testsIncluded assessment of complete blood picture, random plasma glucose (RPG), fasting plasma glucose (FPG), A1c % (Cobas Integra 6000 Roche, Germany), plasma cholesterol level (by an enzymatic photometric test, cholesterol FS, Diagnostic Systems – Holzheim, Germany), plasma triglyceride's level (assayed by the glucokinase peroxidase-peroxidase method on the BS100), high-density lipoprotein (HDL) was assayed by direct method on the BS100 (Shenzhen Mindory bio-medical electronics), and low-density lipoprotein (LDL) was calculated from three primary measurements with the use of Friedewaldl's equation: LDL (mmol/L)=TC-HDL-TG/5.
Specific laboratory tests- •
Measurement of oxidized and reduced forms of plasma coenzyme Q10 by high-performance liquid chromatography (HPLC) from Sigma (St. Louis, USA).
- •
Measurement of erythrocytes coenzyme Q10 was done in the EDTA samples after separation by using Ficoll separating solution (Ficoll; Biochrom KG, Berlin, Germany), then centrifugation, then adjustment of the final erythrocyte suspension to make a hematocrit suspension and determination of the number of cells present. The measurement was done within one week by HPLC with electrochemical detection and internal standardization. During the sample preparation, coenzyme Q10 was completely oxidized. Therefore, for erythrocytes, only the total concentration of coenzyme Q10 is measured.10
- •
Measurement of platelets coenzyme Q10 was done in the EDTA samples by the same steps done before in erythrocytes, but it was possible to measure the total coenzyme Q10 and the redox status, as there is no oxidization.10
- •
Plasma vitamin E measurement was done by a modified fluorometric method (Thompson's fluorometric method, modified by ABE and KATsul). The excitation wave-length was 295nm, and the emission wavelength was 340nm.11
Based on the MS criteria proposed by the International Diabetes Federation, patients were diagnosed as having MS when their WC was ≥90th percentile and when at least two of the following factors were present: (1) raised concentration of triglycerides: ≥150mg/dL (1.7mmol/L) or receiving specific treatment for high triglycerides; (2) reduced concentration of HDL cholesterol: <40mg/dL (1.03mmol/L), or receiving specific treatment for this lipid abnormality; (3) raised blood pressure: systolic blood pressure ≥130mmHg or diastolic blood pressure ≥85mmHg, or receiving treatment for previously diagnosed hypertension; and (4) raised FPG concentration: ≥100mg/dL (5.6mmol/L), or known type 2 diabetes.12
Statistical analysisTesting was performed using SPSS (IBM SPSS Statistics for Windows, version 21.0. NY, USA) Shapiro–Wilk test was used to test data distribution. Mann–Whitney's U-test was used to compare nonparametric samples. One-Way ANOVA with the post hoc Tukey test was used to compare multiple independent samples. The correlation coefficient between variables used was Spearman's rank correlation. p-Values were considered significant if <0.05, non-significant if >0.05.
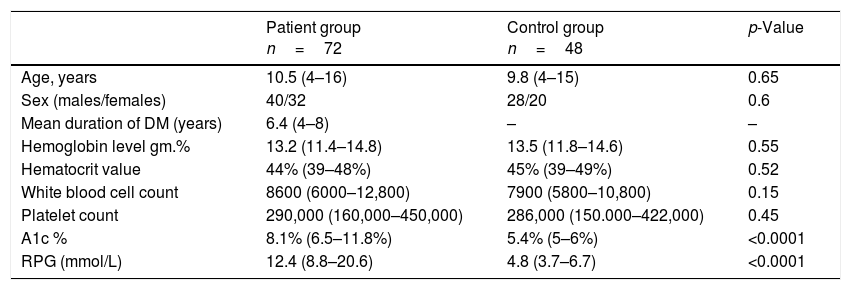
ResultsDemographic data of all children in the study are listed in Table 1.
Demographic data of all patients in the study.
| Patient group n=72 | Control group n=48 | p-Value | |
|---|---|---|---|
| Age, years | 10.5 (4–16) | 9.8 (4–15) | 0.65 |
| Sex (males/females) | 40/32 | 28/20 | 0.6 |
| Mean duration of DM (years) | 6.4 (4–8) | – | – |
| Hemoglobin level gm.% | 13.2 (11.4–14.8) | 13.5 (11.8–14.6) | 0.55 |
| Hematocrit value | 44% (39–48%) | 45% (39–49%) | 0.52 |
| White blood cell count | 8600 (6000–12,800) | 7900 (5800–10,800) | 0.15 |
| Platelet count | 290,000 (160,000–450,000) | 286,000 (150.000–422,000) | 0.45 |
| A1c % | 8.1% (6.5–11.8%) | 5.4% (5–6%) | <0.0001 |
| RPG (mmol/L) | 12.4 (8.8–20.6) | 4.8 (3.7–6.7) | <0.0001 |
Data presented as median (IQR).
A1c %, glycosylated hemoglobin; RPG, random plasma glucose.
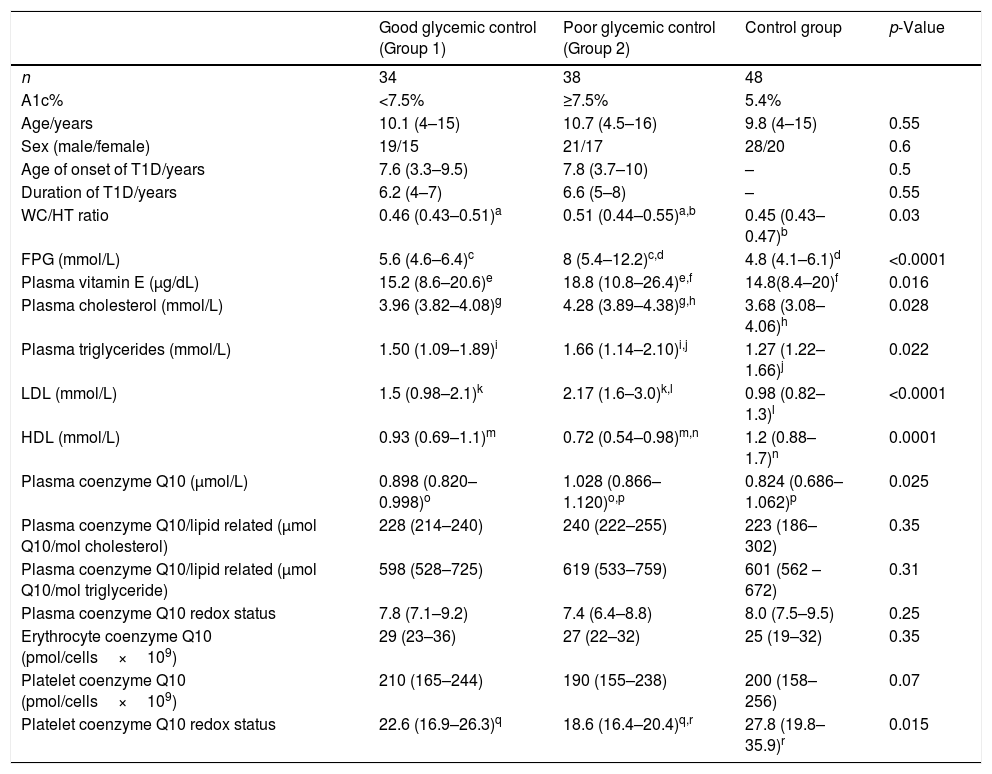
This study included 72 children with T1D, 40 males and 32 females, with a mean age of 10.5 years, and a mean duration of 6.4 years, who were compared with 48 healthy control children with a mean age of 9.8 years, comprising 28 males and 20 females. There was no significant statistical difference regarding age, sex, hemoglobin, hematocrit, WBC, and platelets between diabetic children and the control group (p>0.05). The blood glucose level and the A1c % level in diabetic children were significantly higher when compared with the control group (median [IQR]: 12.4 [8.8–20.6] and 8.1% [6.5–11.8%] vs. 4.8 [3.7–6.7] and 5.4% [5–6%], respectively, p<0.001). Table 2 presents the comparison of vitamin E and coenzyme Q10 levels in all groups of the study.
Comparison of lipid profile, vitamin E, and coenzyme Q10 levels among all groups of study.
| Good glycemic control (Group 1) | Poor glycemic control (Group 2) | Control group | p-Value | |
|---|---|---|---|---|
| n | 34 | 38 | 48 | |
| A1c% | <7.5% | ≥7.5% | 5.4% | |
| Age/years | 10.1 (4–15) | 10.7 (4.5–16) | 9.8 (4–15) | 0.55 |
| Sex (male/female) | 19/15 | 21/17 | 28/20 | 0.6 |
| Age of onset of T1D/years | 7.6 (3.3–9.5) | 7.8 (3.7–10) | – | 0.5 |
| Duration of T1D/years | 6.2 (4–7) | 6.6 (5–8) | – | 0.55 |
| WC/HT ratio | 0.46 (0.43–0.51)a | 0.51 (0.44–0.55)a,b | 0.45 (0.43–0.47)b | 0.03 |
| FPG (mmol/L) | 5.6 (4.6–6.4)c | 8 (5.4–12.2)c,d | 4.8 (4.1–6.1)d | <0.0001 |
| Plasma vitamin E (μg/dL) | 15.2 (8.6–20.6)e | 18.8 (10.8–26.4)e,f | 14.8(8.4–20)f | 0.016 |
| Plasma cholesterol (mmol/L) | 3.96 (3.82–4.08)g | 4.28 (3.89–4.38)g,h | 3.68 (3.08–4.06)h | 0.028 |
| Plasma triglycerides (mmol/L) | 1.50 (1.09–1.89)i | 1.66 (1.14–2.10)i,j | 1.27 (1.22–1.66)j | 0.022 |
| LDL (mmol/L) | 1.5 (0.98–2.1)k | 2.17 (1.6–3.0)k,l | 0.98 (0.82–1.3)l | <0.0001 |
| HDL (mmol/L) | 0.93 (0.69–1.1)m | 0.72 (0.54–0.98)m,n | 1.2 (0.88–1.7)n | 0.0001 |
| Plasma coenzyme Q10 (μmol/L) | 0.898 (0.820–0.998)o | 1.028 (0.866–1.120)o,p | 0.824 (0.686–1.062)p | 0.025 |
| Plasma coenzyme Q10/lipid related (μmol Q10/mol cholesterol) | 228 (214–240) | 240 (222–255) | 223 (186–302) | 0.35 |
| Plasma coenzyme Q10/lipid related (μmol Q10/mol triglyceride) | 598 (528–725) | 619 (533–759) | 601 (562 –672) | 0.31 |
| Plasma coenzyme Q10 redox status | 7.8 (7.1–9.2) | 7.4 (6.4–8.8) | 8.0 (7.5–9.5) | 0.25 |
| Erythrocyte coenzyme Q10 (pmol/cells×109) | 29 (23–36) | 27 (22–32) | 25 (19–32) | 0.35 |
| Platelet coenzyme Q10 (pmol/cells×109) | 210 (165–244) | 190 (155–238) | 200 (158–256) | 0.07 |
| Platelet coenzyme Q10 redox status | 22.6 (16.9–26.3)q | 18.6 (16.4–20.4)q,r | 27.8 (19.8–35.9)r | 0.015 |
A1c%, glycosylated hemoglobin; FPG, fasting plasma glucose; WC/HT, waist-to-height ratio.
Data presented as median (IQR).
Values presented as median (range).
Similar letters indicate significant difference between groups.
Children with poor glycemic control showed significantly higher plasma vitamin E, coenzyme Q10, FPG, triglyceride, LDL, WC/HT ratio, and cholesterol levels, as well as significantly lower HDL and platelet coenzyme Q10 redox status in comparison to both the good glycemic control patients and control group (p<0.05). No significant differences were present between the studied groups regarding plasma coenzyme Q10/lipid-related, plasma coenzyme Q10 redox status, erythrocyte coenzyme Q10, and platelet coenzyme Q10 (p>0.05).
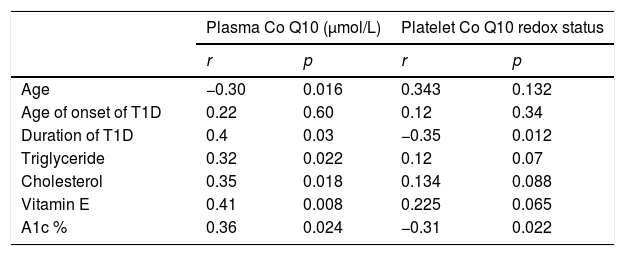
Correlation between plasma coenzyme Q10 in cases of T1D with other parameters is shown in Table 3.
Correlation between plasma coenzyme Q10 (Co Q10) and platelet Co Q10 redox status with other parameters in diabetic patients.
| Plasma Co Q10 (μmol/L) | Platelet Co Q10 redox status | |||
|---|---|---|---|---|
| r | p | r | p | |
| Age | −0.30 | 0.016 | 0.343 | 0.132 |
| Age of onset of T1D | 0.22 | 0.60 | 0.12 | 0.34 |
| Duration of T1D | 0.4 | 0.03 | −0.35 | 0.012 |
| Triglyceride | 0.32 | 0.022 | 0.12 | 0.07 |
| Cholesterol | 0.35 | 0.018 | 0.134 | 0.088 |
| Vitamin E | 0.41 | 0.008 | 0.225 | 0.065 |
| A1c % | 0.36 | 0.024 | −0.31 | 0.022 |
T1D, type 1 diabetes; A1c %, glycosylated hemoglobin.
Plasma coenzyme Q10 showed a positive correlation with the duration of DM, plasma triglyceride, plasma cholesterol, vitamin E and A1c % levels, (r=0.4, p=0.03; r=0.32, p=0.022; r=0.35, p=0.018; r=0.41; p=0.008; and r=0.36; p=0.024, respectively), negative correlation with the age of the children (r=−0.30; p=0.016), and no correlation with the age of onset of DM (r=0.22, p=0.6). Table 3 presents the correlation between the platelet redox status in cases of T1D with other parameters.
The platelet redox status showed a negative correlation with the A1c % levels (r=−0.31; p=0.022) and the duration of T1D (r=−0.35, p=0.012). No correlations were observed between the platelet redox status and age of patients, age of onset of T1D, plasma cholesterol, plasma triglyceride, or vitamin E (r=0.343, p=0.134; r=0.134, p=0.088; r=0.12, p=0.34; r=0.12, p=0.07; and r=0.225, p=0.065, respectively).
DiscussionOxidative stress is considered an important basic pathogenic mechanism in different diseases, including type 1 and 2 DM, with more production of oxygen-free radicals.13
This study revealed that plasma vitamin E level in children with poor glycemic control was significantly higher when compared to both children with good glycemic control and the control group. However, Dominguez et al., in a study with children and adolescents with T1D, found a normal vitamin E level.14 Many studies were conducted and found variable results; either normal, elevated, or decreased plasma vitamin E concentrations have been reported, independent of the type of diabetes.15–17 Another study on 20 children with T1D showed a low vitamin E level, and upon the administration of vitamin E (600mg/day for 3 months), found improvement of oxidative stress and the antioxidant defense system.18 The increased vitamin E level in children with diabetes may be secondary to poor metabolic control with over-production of vitamin E secondary to oxidative stress, and as a protective mechanism against the increased oxygen-free radicals. Different studies disagree with these results.19,20 Nonetheless, other studies agree with the authors’ study.8,21
The present study demonstrated that the plasma coenzyme Q10 level in children with poor glycemic control was significantly higher when compared to both children with good glycemic control and the control group. After adjustment of coenzyme Q10 to plasma lipids, this difference was equalized. A study conducted by Menke et al. found the same results and explained this elevation in plasma concentration of coenzyme Q10 in children with diabetes as one of the body's protective mechanism against the increased oxidative stress associated with prolonged hyperglycemia.22 Wittgenstein et al. studied plasma coenzyme Q10 in children with diabetes and found no significant difference regarding total coenzyme Q10 and lipid-related coenzyme Q10, in spite of an increase in the oxidized part of coenzyme Q10, between patients and controls.23 A study performed by Lim et al. on children with type 1 diabetes found higher plasma coenzyme Q10 concentration and lower lipid-related coenzyme Q10, in spite of an increase in the oxidized part of coenzyme Q10, between patients and controls. The authors in the same study explained that these changes in coenzyme Q10 occur secondary to increased oxidative stress.24 A study done by Salaradi et al. found significantly higher plasma vitamin E and coenzyme Q10 levels in children with poor glycemic control than those with good glycemic control.8
In the present study, despite no difference in the intracellular coenzyme Q10 level in both erythrocytes and platelets between all groups of study, the platelet coenzyme Q10 redox status in the poor glycemic control group was significantly lower in comparison to its level in both the group with good glycemic control and the control group. This in agreement with different studies that found the same result and explained that these differences in concentration in the platelet redox status were attributed to the subgroup of patients with poor glycemic control.8,22,25
In the current study, a negative correlation was found between plasma coenzyme Q10 and the age of the children; this agrees with a study that found coenzyme Q10 levels in preschool children was higher than coenzyme Q10 levels in school children.24 Nevertheless, Miles et al. found that adult patients with metabolic syndrome are associated with elevated plasma total coenzyme Q10.26 Other study found the same results; that plasma coenzyme Q10 is positively correlated with A1c % and vitamin E.8
In the present study, it was observed that most of the patients are exposed to oxidative stress evidenced by hyperglycemia, higher mean A1c % (8.1%), high plasma vitamin E level, high plasma coenzyme Q10 level, and decreased platelet coenzyme Q10 redox status. All these were supported by the positive correlation between the plasma coenzyme Q10 with both vitamin E and A1c %, and the negative correlation between the platelet coenzyme Q10 redox status and A1c %. The reduced form of coenzyme Q10 inhibits lipid peroxidation by direct removal of free radicals, or indirectly by regeneration of Vitamin E from its oxidized form.27 This decrease in platelet coenzyme Q10 redox status may be considered as an evidence of protection mechanisms by mitochondria in diabetes, so it is considered as a sign of oxidative stress.28
Patients with poor glycemic control in this study are more liable to central adiposity and MS than other groups, as they have a higher WC/HT ratio, exceeding 0.50, associated with lower HDL and higher FPG, which increases the possibility of insulin resistance and produces more oxidative stress, which in turn may be a cause of increasing vitamin E and coenzyme Q10. Against these findings, Yen et al., who reported that patients with MS might be under higher oxidative stress, resulting in low levels and consumption of active antioxidant enzymes.29 Another study conducted by Beydoun et al. found that vitamin E had no consistent association with MS.30
ConclusionPoorly controlled diabetic children had elevation of plasma vitamin E and coenzyme Q10 levels, and decreased platelet redox status of coenzyme Q10, which may be an indicator of increased oxidative stress. It is important to measure these levels in children with T1D, and further studies about therapeutic potentials of both vitamin E and coenzyme Q10 in protecting against and reversing vascular diseases are needed.
FundingThis research did not receive any specific grant from funding agencies in the public, commercial, or non-profit sectors.
Conflicts of interestThe authors declare no conflicts of interest.
Please cite this article as: Alkholy UM, Abdalmonem N, Zaki A, Elkoumi MA, Hashim MI, Basset MA, et al. The antioxidant status of coenzyme Q10 and vitamin E in children with type 1 diabetes. J Pediatr (Rio J). 2019;95:224–30.


