To develop and validate equations to estimate the percentage of body fat of children and adolescents from Mexico using anthropometric measurements.
MethodsA cross-sectional study was carried out with 601 children and adolescents from Mexico aged 5–19 years. The participants were randomly divided into the following two groups: the development sample (n=398) and the validation sample (n=203). The validity of previously published equations (e.g., Slaughter) was also assessed. The percentage of body fat was estimated by dual-energy X-ray absorptiometry. The anthropometric measurements included height, sitting height, weight, waist and arm circumferences, skinfolds (triceps, biceps, subscapular, supra-iliac, and calf), and elbow and bitrochanteric breadth. Linear regression models were estimated with the percentage of body fat as the dependent variable and the anthropometric measurements as the independent variables.
ResultsEquations were created based on combinations of six to nine anthropometric variables and had coefficients of determination (r2) equal to or higher than 92.4% for boys and 85.8% for girls. In the validation sample, the developed equations had high r2 values (≥85.6% in boys and ≥78.1% in girls) in all age groups, low standard errors (SE≤3.05% in boys and ≤3.52% in girls), and the intercepts were not different from the origin (p>0.050). Using the previously published equations, the coefficients of determination were lower, and/or the intercepts were different from the origin.
ConclusionsThe equations developed in this study can be used to assess the percentage of body fat of Mexican schoolchildren and adolescents, as they demonstrate greater validity and lower error compared with previously published equations.
Desenvolver e validar equações para estimar o percentual de gordura corporal (%GC) de crianças e adolescentes do México utilizando medidas antropométricas.
MétodosFoi realizado um estudo transversal com 601 crianças e adolescentes do México com idades entre 5 e 19 anos. Os participantes foram divididos aleatoriamente nos seguintes dois grupos: a amostra de desenvolvimento (n=398) e a amostra de validação (n=203). A validade das equações publicadas anteriormente (por exemplo, Slaughter) também foi avaliada. O %GC foi estimado por absorciometria de dupla energia de raios-X (raio-X de dupla energia (DXA)). As medidas antropométricas incluíram estatura, altura sentado, peso, circunferências da cintura e do braço, dobras cutâneas (tríceps, bíceps, subescapular, suprailíaca e panturrilha) e larguras do cotovelo e bitrocantérica. Os modelos de regressão linear foram estimados com o %GC sendo a variável dependente e as medidas antropométricas como as variáveis independentes.
ResultadosAs equações foram criadas com base nas combinações de seus a nove variáveis antropométricas e apresentaram coeficientes de determinação (r2) iguais ou superiores a 92,4% para meninos e 85,8% para meninas. Na amostra de validação, as equações desenvolvidas apresentaram altos valores de r2 (≥ 85,6% em meninos e≥78,1% em meninas) em todos os grupos, baixo nível de erros padrão (EP≤3,05% em meninos e≤3,52% em meninas) e os interceptos não foram diferentes da origem (p>0,050). Utilizando as equações publicadas anteriormente, os coeficientes de determinação foram menores e/ou os interceptos foram diferentes da origem.
ConclusõesAs equações desenvolvidas neste estudo podem ser utilizadas para avaliar o %GC das crianças em idade escolar e adolescentes mexicanos, pois elas possuem uma maior validade e menor erro em comparação às equações publicadas anteriormente.
Overweight and obesity are important public health problems because of their magnitude and impact on health. In 2012, prevalence of overweight and obesity in Mexican schoolchildren 5–11 years old was 34.4% (19.8% and 14.6%, respectively) and, in adolescents 12–19 years old, it was 34.9%.1 In schoolchildren, this value was slightly higher (34.8%) in 2006, whereas in adolescents, it was lower (33.2%).
Children with obesity tend to become adults with obesity, which increases their risk for the development of chronic diseases.2 Obesity represents an economic problem because the treatment of its co-morbidities carries high costs.3 Hence, it is necessary that obesity is accurately diagnosed.
Different methods for assessing body fat include hydrodensitometry, dual energy X-ray absorptiometry (DXA), and deuterium dilution. These measures are used mainly in research settings because the required equipment is costly and must be operated by specialized technicians. For these reasons, these methods are unsuitable for population studies, clinical practice, and screening activities. On the contrary, anthropometric measurements – although indirect indicators of adiposity – are economical, non-intrusive, and highly reproducible.4
Various equations based on anthropometry have been used to estimate body fat in children, and these methods have been developed in Euro- and Afro-descendent subjects. Slaughter equations5 are the most frequently used in the evaluation of body composition in children and adolescents.6–9 These equations were developed in 310 Afro-American and Euro-American people from 8 to 29 years of age.5 However, these equations tend to overestimate body fat.8,9 In recent years, Dezenberg equations have been used,7 which were developed in a sample of 202 Afro- and Euro-American children aged 4–10 years of age. In Latino children from the USA, these equations inaccurately estimate body fat.10 These results show that equations developed in an ethnic group can be used in other populations, but the obtained estimation could be inaccurate. In the case of the Latino population, it has been recognized that the present-day Mexican population is an admixture among Amerindian, European, and African ancestries.11
Few studies in Latin America have explored the validity of prediction equations to estimate body fat in children using anthropometric measurements.12,13 It is possible that equations developed in populations of European or African ancestry could not be applied to the Latin American population due to ethnic differences in amount and distribution of body fat. For example, in comparison with European- or African-descended children, those with Latino ancestry have higher waist circumference.14 In addition, pediatric Latin American populations have a high weight in relation to their height (an indirect indicator of adiposity), which is not always is due to excess body fat.15,16 Other reasons for high weight without excess adiposity could be that in comparison with the reference population, Latino populations have lower heights15,16 but higher values of muscle mass,16 fat-free mass hydration,17 trunk length,15 body frame (i.e., bone thickness),15 and thorax circumference.18 Therefore, the objectives of this study were (1) to evaluate the validity of previously published equations to estimate %BF in Latino children, and (2) to develop and validate new equations in Latino children to predict body fat using DXA as the gold standard.
MethodsA cross-sectional study was carried out with a convenience sample of schoolchildren and adolescents aged 5–19 years from Mexico City. The participants were recruited from elementary (n=7), junior high (n=8), and high schools (n=4) in Mexico City and a community center in the State of Mexico. The research team presented the project to the principal of each school, and all students were invited to participate. Additionally, children of employees from the Metropolitan Autonomous University at Xochimilco (UAM-X) participated in the study. Children with a plaster cast or motor disabilities were excluded from the study. The study was approved by the Division of Biological and Health Sciences from UAM-X. The participants and their parents or guardians were informed about the research procedures, and the latter provided informed consent.
Following the procedures used in other studies,7,10,19 the total sample (n=601) was randomly divided into two groups. Data from two-thirds of the participants were used to develop equations (n=398), and data from the remaining one-third of the children were used to validate new and previously published equations (n=203). The SPSS software package (IBM Corp. 2010. IBM SPSS Statistics for Windows, version 20.0. NY, USA) was used to generate these samples (option “Random sample of cases” in the command “Select cases”).
Most anthropometric measurements were performed following the techniques described by Lohman et al.20 Waist circumference was measured according to the technique described by Fernández et al.14 Observers were standardized following the Habicht protocol.21 Participants were measured with light clothes and without shoes. Stature was measured with a portable stadiometer, model 214 (SECA®, SP, Brazil) and body weight with a digital scale, model 813 (SECA®, SP, Brazil). Waist and arm circumferences were obtained with a metallic tape (Lufkin®, MD, USA). Skinfolds (triceps, bicipital, subscapular, suprailiac, and calf) were measured with a compass (Harpenden®, Mediflex Produtos Cirúrgicos, NY, USA). Each skinfold was measured three times, and the average value was analyzed. Bitrochanteric breadth and sitting stature were measured with an anthropometer (Harpenden®, Mediflex Produtos Cirúrgicos, NY, USA). Elbow breadth was measured with an anthropometer (Futrex®, MD, USA).
Body mass index (BMI: body weight/height2) was calculated as a Z-score for age and sex using the World Health Organization reference.22 Maturity was estimated using the equations of Mirwald et al.23
The percentage of body fat (%BF) was evaluated with DXA using equipment Model Discovery Wi (Hologic®, MA, USA) Calibration, scanning, and image analysis were completed following the manufacturer procedures and those described by the International Society for Clinical Densitometry (ISCD).24 The images were analyzed using the whole body option for Hispanic populations, model APEX version 3.3.0.1 (Hologic®, MA, USA). The coefficients of variation for the technician were 1.27% for total body fat (TBF) in kilograms, 0.66% for lean body mass, and 1.04% for %TBF, which are acceptable according to the ISCD.24
The distribution of anthropometric variables was assessed using the Kolmogorov–Smirnov test (Table 1). When the variable had a biased distribution, it was transformed using the base-10 logarithm to achieve a closer symmetric distribution. Linear regression models were estimated using DXA derived %BF as a dependent variable and anthropometric measurement as independent variables. Separate models were estimated for each sex. The equations were developed using the following two procedures:
- (a)
Different combinations of independent variables were manually tested. First, the capacity of each anthropometric variable to estimate %BF was evaluated (Supplementary Table S1). In addition, scatter plots were graphed to verify the linear relationship among the variables. A curvilinear relationship of %BF with age was evident in boys; meanwhile, among girls, this relationship was linear. For this reason, in models for boys, the quadratic term of age was incorporated. Because age and maturity are related, separate models with each variable were estimated, and no differences were observed. For simplicity, only models with age were reported. The coefficient of determination (r2) and standard error (SE) were used as criteria to identify the variables that better predicted %BF. A variable was considered an adequate predictor when the p-value was <0.050.
- (b)
The automatic backward and forward procedures of the linear regression command of SPSS software were used (Table 2). In the backward option, all variables were introduced in the models, and then those that had a low partial correlation with the dependent variable were excluded (elimination criteria: p>0.100). In the forward option, the variables were introduced one-by-one according to greater correlation with the dependent variable. These variables were introduced and kept if they significantly predicted the dependent variable (p<0.050).
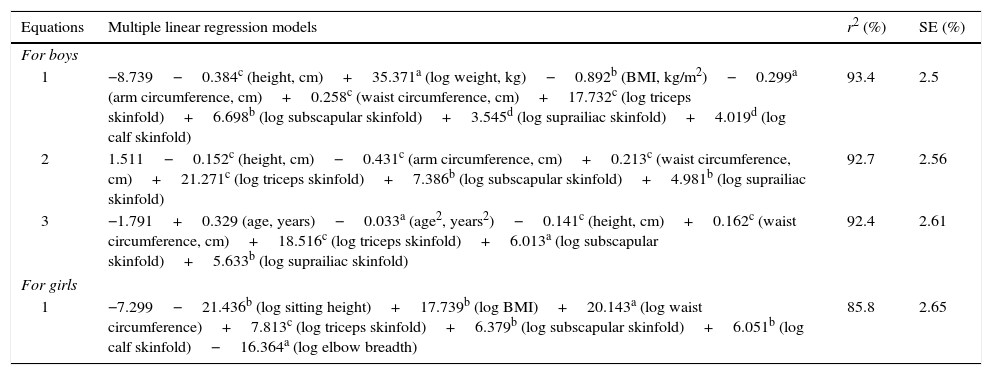
Table 2.Multiple linear regression models having %BF by DXA as outcome and anthropometric characteristics as predictors in the development sample of Mexican children and adolescents.
Equations Multiple linear regression models r2 (%) SE (%) For boys 1 −8.739−0.384c (height, cm)+35.371a (log weight, kg)−0.892b (BMI, kg/m2)−0.299a (arm circumference, cm)+0.258c (waist circumference, cm)+17.732c (log triceps skinfold)+6.698b (log subscapular skinfold)+3.545d (log suprailiac skinfold)+4.019d (log calf skinfold) 93.4 2.5 2 1.511−0.152c (height, cm)−0.431c (arm circumference, cm)+0.213c (waist circumference, cm)+21.271c (log triceps skinfold)+7.386b (log subscapular skinfold)+4.981b (log suprailiac skinfold) 92.7 2.56 3 −1.791+0.329 (age, years)−0.033a (age2, years2)−0.141c (height, cm)+0.162c (waist circumference, cm)+18.516c (log triceps skinfold)+6.013a (log subscapular skinfold)+5.633b (log suprailiac skinfold) 92.4 2.61 For girls 1 −7.299−21.436b (log sitting height)+17.739b (log BMI)+20.143a (log waist circumference)+7.813c (log triceps skinfold)+6.379b (log subscapular skinfold)+6.051b (log calf skinfold)−16.364a (log elbow breadth) 85.8 2.65 %BF by DXA, percentage of body fat estimated by dual-energy X-ray absorptiometry; BMI, body mass index; SE, standard error.
p-Values of regression coefficients were:
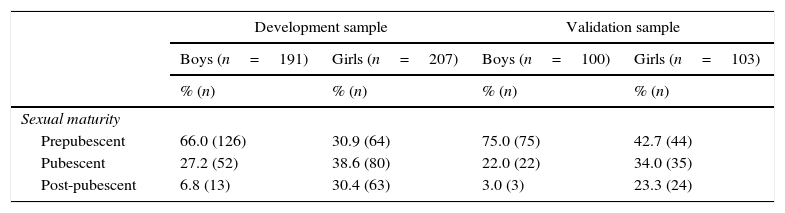
Descriptive statistics of the anthropometric measures in the development and validation samples of Mexican children and adolescents.
| Development sample | Validation sample | |||
|---|---|---|---|---|
| Boys (n=191) | Girls (n=207) | Boys (n=100) | Girls (n=103) | |
| % (n) | % (n) | % (n) | % (n) | |
| Sexual maturity | ||||
| Prepubescent | 66.0 (126) | 30.9 (64) | 75.0 (75) | 42.7 (44) |
| Pubescent | 27.2 (52) | 38.6 (80) | 22.0 (22) | 34.0 (35) |
| Post-pubescent | 6.8 (13) | 30.4 (63) | 3.0 (3) | 23.3 (24) |
| Mean±SD | Mean±SD | Mean±SD | Mean±SD | |
|---|---|---|---|---|
| Body fat (%) | 27.1±9.4 | 32.6±7.0 | 25.8±9.0 | 32.8±7.4 |
| Age (years) | 11.3±2.7 | 11.5±2.9 | 10.9±2.6 | 10.9±2.9 |
| Age2(years2) | 136.0±59.2a | 141.1±67.5a | 133.3±56.0 | 127.9±62.6 |
| Height (cm) | 149.2±16.9 | 146.2±13.1c | 144.2±15.3 | 145.2±13.7 |
| Sitting height (cm) | 76.9±8.1 | 76.5±7.2b | 74.3±7.5 | 75.5±7.9 |
| Sitting height ratio (%) | 51.7±1.8a | 52.3±1.9 | 51.6±2.6 | 52.0±2.7a |
| Weight (kg) | 47.4±15.9 | 45.0±14.2 | 42.0±14.3 | 43.7±14.0 |
| Body mass index (kg/m2) | 20.7±4.2 | 20.5±4.1 | 19.7±3.8 | 20.3±4.3 |
| Arm circumference (cm) | 24.2±4.1 | 23.9±3.8 | 23.2±3.8 | 23.9±3.7 |
| Waist circumference (cm) | 73.8±12.9 | 72.0±11.2 | 70.1±11.4 | 72.5±10.8 |
| Triceps skinfold (mm) | 14.9±6.6a | 16.7±5.5 | 14.2±6.3 | 17.2±5.8 |
| Biceps skinfold (mm) | 8.3±4.5c | 9.0±3.9a | 7.7±3.8a | 9.8±4.8a |
| Subscapular skinfold (mm) | 14.2±7.8a | 15.7±7.2 | 13.0±7.6b | 16.0±9.2 |
| Suprailiac skinfold (mm) | 18.9±12.7a | 22.0±12.0 | 16.0±11.3a | 21.9±11.9 |
| Calf skinfold (mm) | 14.1±6.7a | 15.8±6.5 | 12.4±5.9a | 16.0±6.6 |
| Bitrochanteric breadth (cm) | 29.7±4.9 | 29.5±4.2 | 27.9±4.4 | 29.3±4.5 |
| Elbow breadth (cm) | 5.6±0.6 | 5.1±0.4 | 5.4±0.6 | 5.1±0.4 |
Significance by the Kolmogorov–Smirnov test.
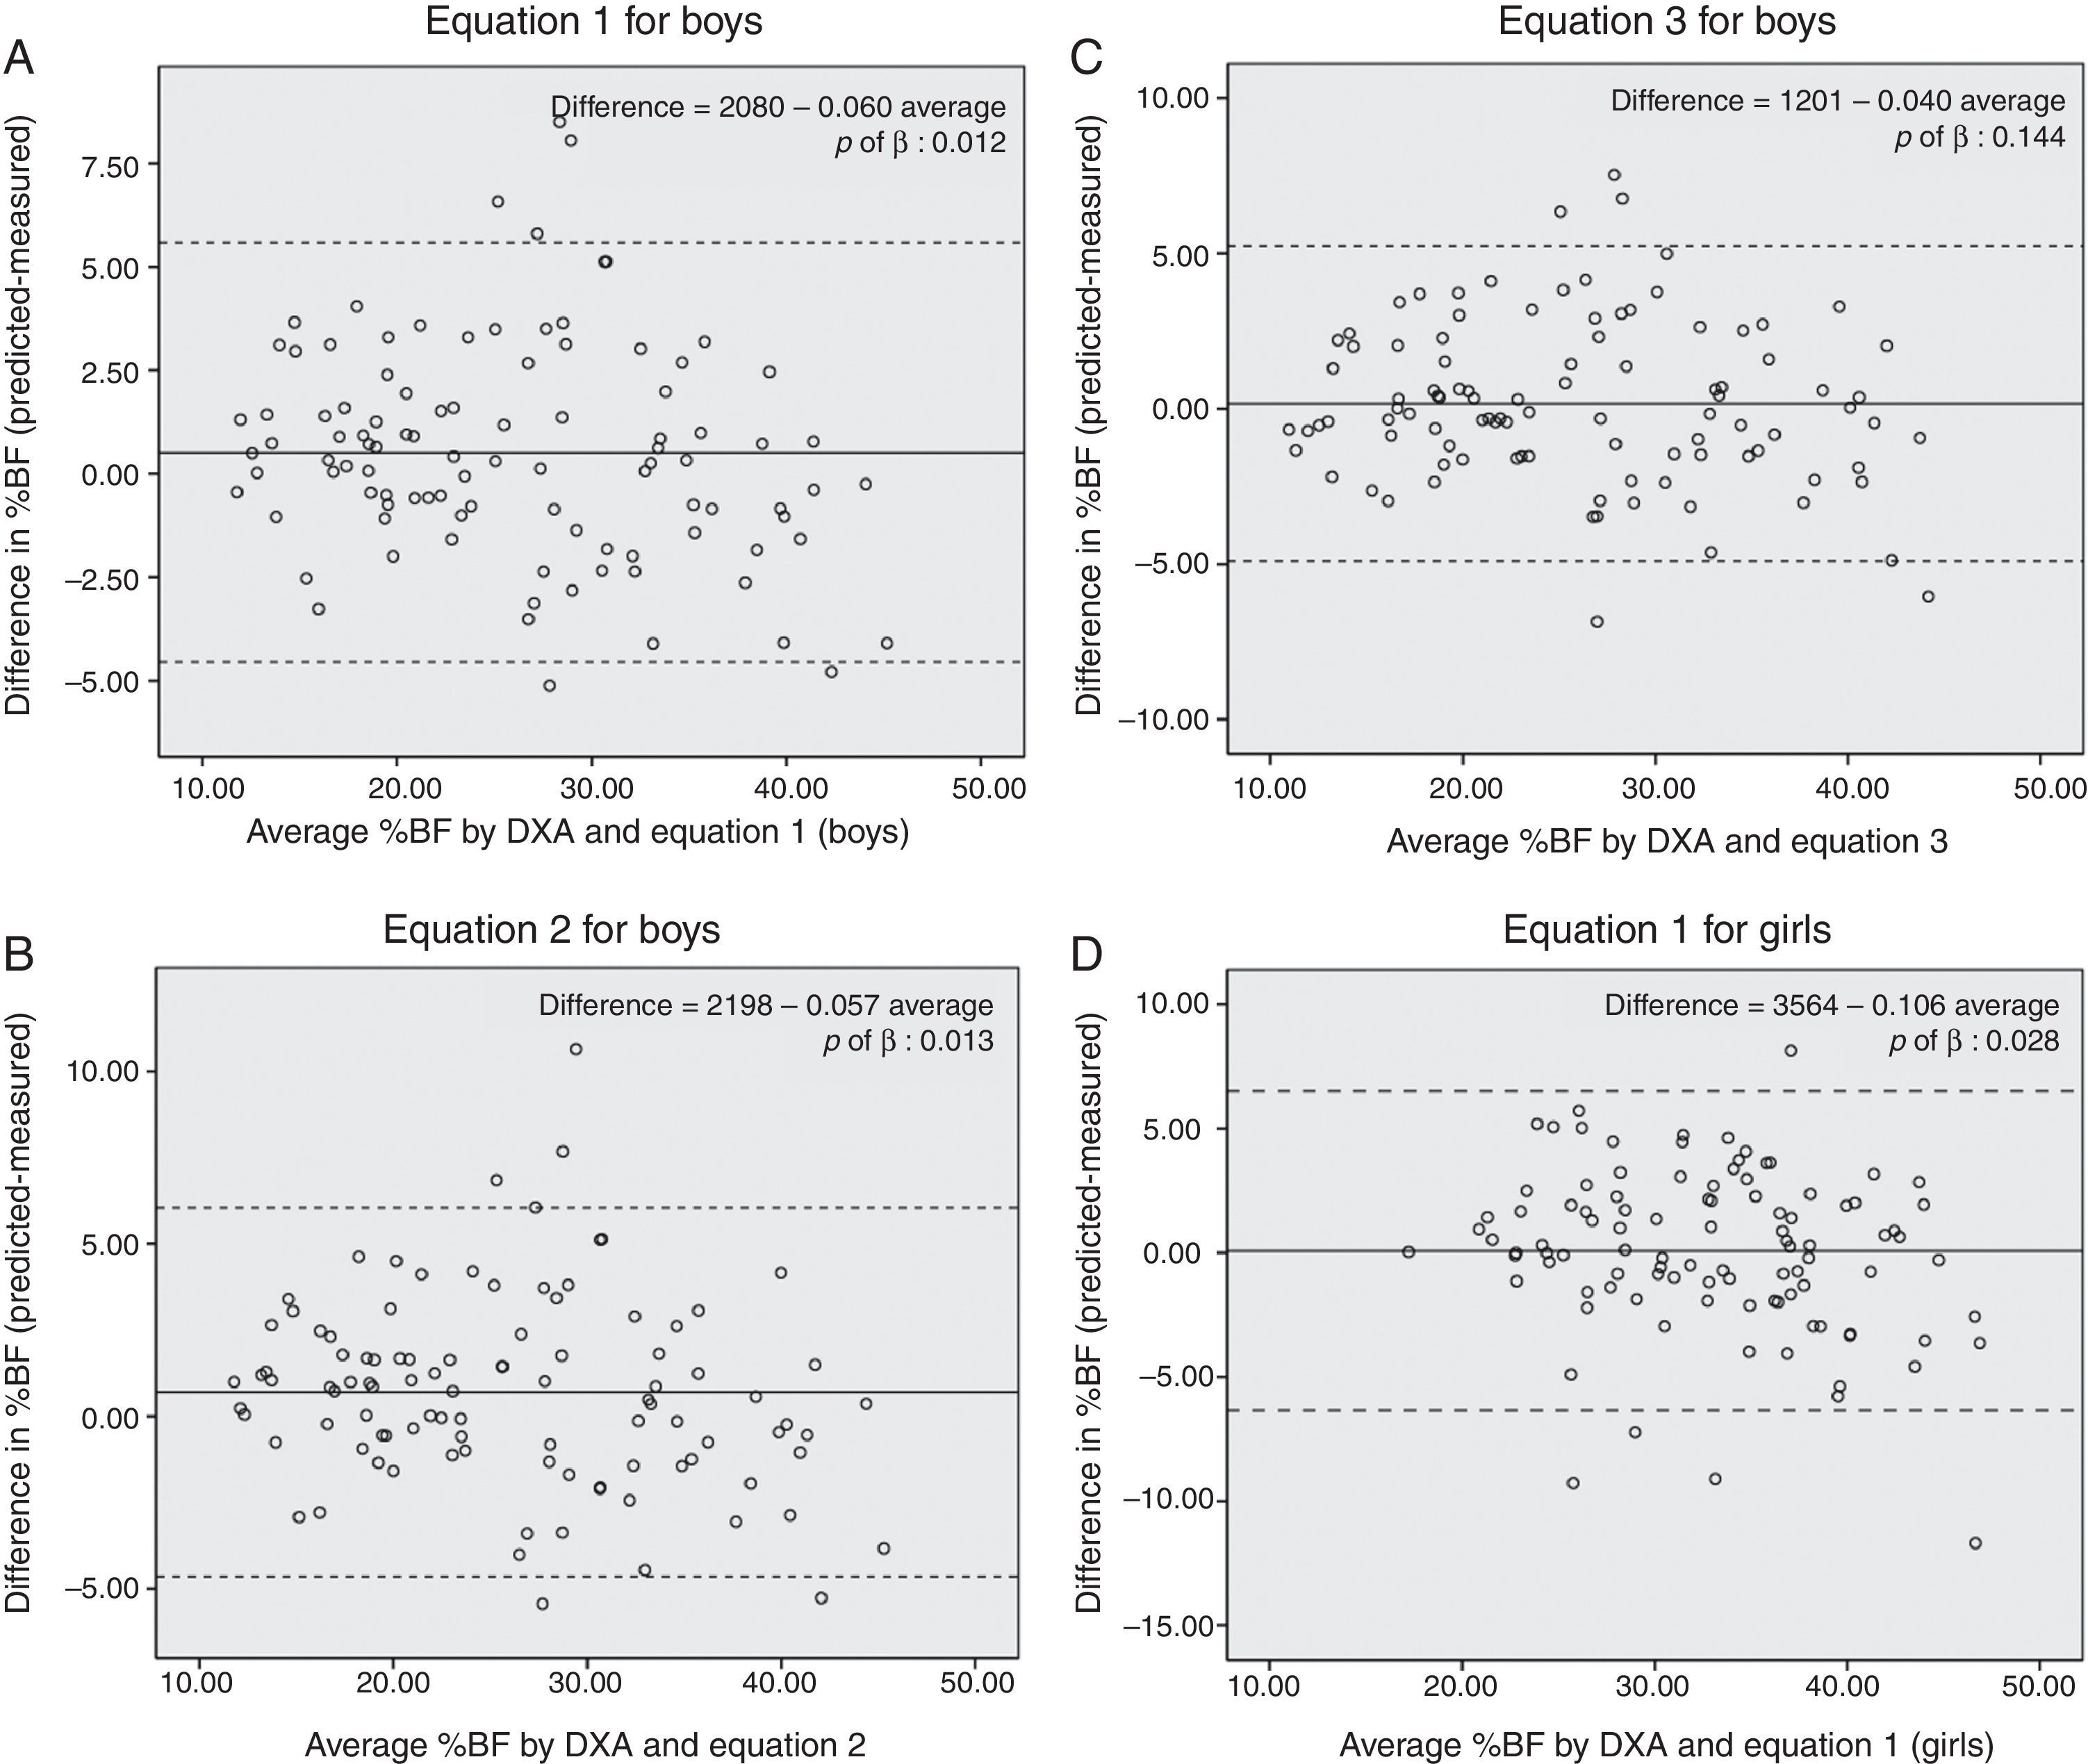
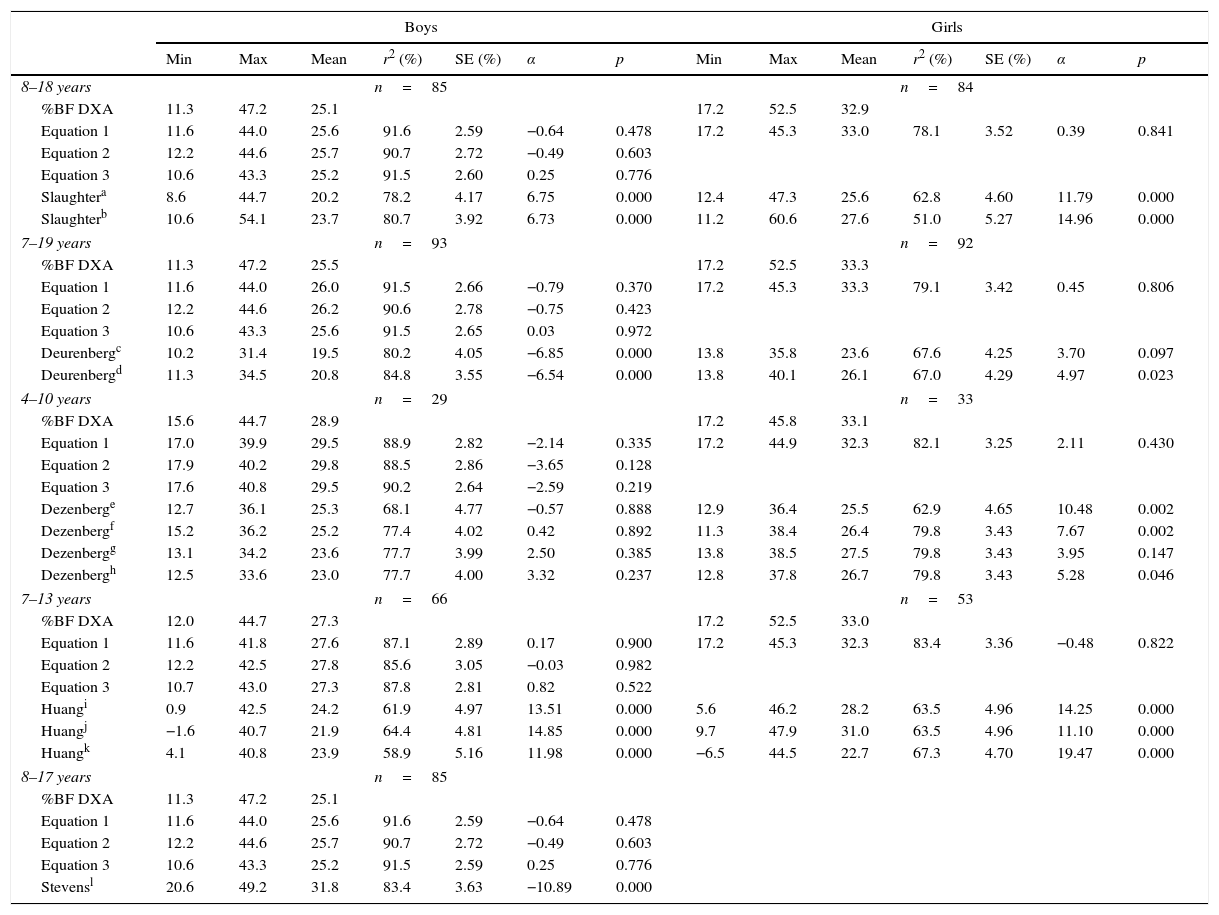
The assessment of the validity of the previously published equations was carried out using age-matched subjects from the population that was used to develop them (e.g., for the Slaughter equations,25 participants data from 8 to 18 years old were used and for the Deurenberg equations26 the range was 7–19 years). The validity of Stevens equations for girls could not be assessed because there was no data for children of menarche age. In these regression models, the dependent variable was DXA derived %BF, and the independent variable was %BF obtained by equations previously developed and those developed in this study (Table 3). One criterion for validity was whether there was a significant difference between the intercept and the origin (p>0.050) because, if there is difference, the equations would systematically over- or under-estimate %BF. Finally, the Bland Altman plots were graphed (Fig. 1 and Supplementary Fig. S1) to verify whether bias existed in the estimations according to adiposity levels. Differences between the measured and estimated %BF were plotted against the average of measured and estimated %BF. Only equations whose intercept was not different from the origin were plotted. The statistical analyses were performed using SPSS software (IBM Corp. 2010. IBM SPSS Statistics for Windows, version 20.0. NY, USA)
Cross-validation of new and previously published prediction equations in validation sample of Mexican children and adolescents.
| Boys | Girls | |||||||||||||
|---|---|---|---|---|---|---|---|---|---|---|---|---|---|---|
| Min | Max | Mean | r2 (%) | SE (%) | α | p | Min | Max | Mean | r2 (%) | SE (%) | α | p | |
| 8–18 years | n=85 | n=84 | ||||||||||||
| %BF DXA | 11.3 | 47.2 | 25.1 | 17.2 | 52.5 | 32.9 | ||||||||
| Equation 1 | 11.6 | 44.0 | 25.6 | 91.6 | 2.59 | −0.64 | 0.478 | 17.2 | 45.3 | 33.0 | 78.1 | 3.52 | 0.39 | 0.841 |
| Equation 2 | 12.2 | 44.6 | 25.7 | 90.7 | 2.72 | −0.49 | 0.603 | |||||||
| Equation 3 | 10.6 | 43.3 | 25.2 | 91.5 | 2.60 | 0.25 | 0.776 | |||||||
| Slaughtera | 8.6 | 44.7 | 20.2 | 78.2 | 4.17 | 6.75 | 0.000 | 12.4 | 47.3 | 25.6 | 62.8 | 4.60 | 11.79 | 0.000 |
| Slaughterb | 10.6 | 54.1 | 23.7 | 80.7 | 3.92 | 6.73 | 0.000 | 11.2 | 60.6 | 27.6 | 51.0 | 5.27 | 14.96 | 0.000 |
| 7–19 years | n=93 | n=92 | ||||||||||||
| %BF DXA | 11.3 | 47.2 | 25.5 | 17.2 | 52.5 | 33.3 | ||||||||
| Equation 1 | 11.6 | 44.0 | 26.0 | 91.5 | 2.66 | −0.79 | 0.370 | 17.2 | 45.3 | 33.3 | 79.1 | 3.42 | 0.45 | 0.806 |
| Equation 2 | 12.2 | 44.6 | 26.2 | 90.6 | 2.78 | −0.75 | 0.423 | |||||||
| Equation 3 | 10.6 | 43.3 | 25.6 | 91.5 | 2.65 | 0.03 | 0.972 | |||||||
| Deurenbergc | 10.2 | 31.4 | 19.5 | 80.2 | 4.05 | −6.85 | 0.000 | 13.8 | 35.8 | 23.6 | 67.6 | 4.25 | 3.70 | 0.097 |
| Deurenbergd | 11.3 | 34.5 | 20.8 | 84.8 | 3.55 | −6.54 | 0.000 | 13.8 | 40.1 | 26.1 | 67.0 | 4.29 | 4.97 | 0.023 |
| 4–10 years | n=29 | n=33 | ||||||||||||
| %BF DXA | 15.6 | 44.7 | 28.9 | 17.2 | 45.8 | 33.1 | ||||||||
| Equation 1 | 17.0 | 39.9 | 29.5 | 88.9 | 2.82 | −2.14 | 0.335 | 17.2 | 44.9 | 32.3 | 82.1 | 3.25 | 2.11 | 0.430 |
| Equation 2 | 17.9 | 40.2 | 29.8 | 88.5 | 2.86 | −3.65 | 0.128 | |||||||
| Equation 3 | 17.6 | 40.8 | 29.5 | 90.2 | 2.64 | −2.59 | 0.219 | |||||||
| Dezenberge | 12.7 | 36.1 | 25.3 | 68.1 | 4.77 | −0.57 | 0.888 | 12.9 | 36.4 | 25.5 | 62.9 | 4.65 | 10.48 | 0.002 |
| Dezenbergf | 15.2 | 36.2 | 25.2 | 77.4 | 4.02 | 0.42 | 0.892 | 11.3 | 38.4 | 26.4 | 79.8 | 3.43 | 7.67 | 0.002 |
| Dezenbergg | 13.1 | 34.2 | 23.6 | 77.7 | 3.99 | 2.50 | 0.385 | 13.8 | 38.5 | 27.5 | 79.8 | 3.43 | 3.95 | 0.147 |
| Dezenbergh | 12.5 | 33.6 | 23.0 | 77.7 | 4.00 | 3.32 | 0.237 | 12.8 | 37.8 | 26.7 | 79.8 | 3.43 | 5.28 | 0.046 |
| 7–13 years | n=66 | n=53 | ||||||||||||
| %BF DXA | 12.0 | 44.7 | 27.3 | 17.2 | 52.5 | 33.0 | ||||||||
| Equation 1 | 11.6 | 41.8 | 27.6 | 87.1 | 2.89 | 0.17 | 0.900 | 17.2 | 45.3 | 32.3 | 83.4 | 3.36 | −0.48 | 0.822 |
| Equation 2 | 12.2 | 42.5 | 27.8 | 85.6 | 3.05 | −0.03 | 0.982 | |||||||
| Equation 3 | 10.7 | 43.0 | 27.3 | 87.8 | 2.81 | 0.82 | 0.522 | |||||||
| Huangi | 0.9 | 42.5 | 24.2 | 61.9 | 4.97 | 13.51 | 0.000 | 5.6 | 46.2 | 28.2 | 63.5 | 4.96 | 14.25 | 0.000 |
| Huangj | −1.6 | 40.7 | 21.9 | 64.4 | 4.81 | 14.85 | 0.000 | 9.7 | 47.9 | 31.0 | 63.5 | 4.96 | 11.10 | 0.000 |
| Huangk | 4.1 | 40.8 | 23.9 | 58.9 | 5.16 | 11.98 | 0.000 | −6.5 | 44.5 | 22.7 | 67.3 | 4.70 | 19.47 | 0.000 |
| 8–17 years | n=85 | |||||||||||||
| %BF DXA | 11.3 | 47.2 | 25.1 | |||||||||||
| Equation 1 | 11.6 | 44.0 | 25.6 | 91.6 | 2.59 | −0.64 | 0.478 | |||||||
| Equation 2 | 12.2 | 44.6 | 25.7 | 90.7 | 2.72 | −0.49 | 0.603 | |||||||
| Equation 3 | 10.6 | 43.3 | 25.2 | 91.5 | 2.59 | 0.25 | 0.776 | |||||||
| Stevensl | 20.6 | 49.2 | 31.8 | 83.4 | 3.63 | −10.89 | 0.000 | |||||||
%BF DXA, percentage of body fat estimated by dual-energy X-ray absorptiometry; Min, minimum; Max, maximum; SE, standard error; r2, coefficient of determination; α, intercept; T-SF, triceps skinfold; B-SF, biceps skinfold; SS-SF, subscapular skinfold; SI-SF, supra-iliac skinfold; C-SF, calf skinfold.
The estimations were made based on:

Statistical power analysis for different scenarios was completed using the G*Power software.27 For the development of equations (Table 2) given a significance level (α) of 0.050, a sample size of 207, an effect of 85.8% (r2), and seven predictors (scenario for the girls’ equation), the statistical power was 1.00. The same result was obtained with the scenario for the three equations for boys. For the validation analysis (Table 3), the power obtained under the different scenarios with respect to the sample size (n from 29 to 93), the effect (r2 from 51.0 to 91.6%) and the number of predictors (1–7) was always satisfactory (i.e., ≥0.80).
ResultsA descriptive analysis of the anthropometric variables in the development and validation samples is shown in Table 1. The mean age of the development sample was 11.88 years, which is higher than that of the validation sample (11.32 years, p=0.019). In both samples, half of the participants were girls (development sample: 52%, validation sample: 50.7%). Although most participants were pre-pubescent, the proportion was higher in the validation sample than in the development sample (58.6% vs. 47.7%, p<0.050).
For each sex group, different anthropometric characteristics were related to %BF (Supplementary Table S1). In boys, the variables that better predicted %BF were age, stature, BMI, circumferences of arm and waist, bitrochanteric and elbow breadth, sitting stature, weight, sitting stature index, and five skinfolds. Among girls, the best predictors were age, stature, weight, sitting stature, sitting stature index, BMI, circumference of arm and waist, five skinfolds, and bitrochanteric and elbow breadth.
Using automated procedures, the two models satisfactorily predicted %BF in boys (Table 2). With the backward option, the following variables were included in the model (called Equation (1)): stature, BMI, arm and waist circumferences, body weight, and triceps, subscapular, suprailiac, and calf skinfolds (r2=93%, SE=2.5%). With the forward option, the model (called Equation (2)) included the following variables: stature, arm and waist circumferences, and triceps, subscapular, and suprailiac skinfolds (r2=92%, SE=2.5%). In boys, manual selection produced a model (Equation (3)) that included age, stature, waist circumference, and triceps, subscapular, and suprailiac skinfolds (r2=92%, SE=2.0%). In girls, both of the automated procedures produced the same solution (called Equation (1)) with the following variables: sitting stature, BMI, waist circumference, triceps, elbow breadth, and subscapular and calf skinfolds (r2=85%, SE=2.5%). Among girls, the manual selection model did not adequately predict %BF (r2≥80.0%).
Table 3 shows the different estimations of %BF obtained by equations in the validation sample. In all of the age groups, the newly developed equations in Mexican schoolchildren and adolescents had high coefficients of determination (r2≥85% in boys and ≥78% in girls) and the lowest SE (≤3.05% in boys and ≤3.52% in girls); in addition, their intercepts did not differ from the origin (p>0.050). Although with the Dezenberg equations the intercept did not differ from the origin (p>0.050), their predictive capacity (r2≥77.7 in boys and <79.8 in girls) was lower than that of the equations developed here (r2≥88 and 82%, respectively). The Stevens equations in boys explained a significant proportion of variance (r2=85%), but the intercept differed from the origin. In both sexes, the Slaughter equations overestimated %BF (positive intercept, p<0.050). The Deurenberg equations underestimated %BF in boys (negative intercept, p<0.050) and overestimated in girls. The Huang equations overestimated %BF in both sexes.
The Bland–Altman plots (Fig. 1A, B and D) revealed that developed equations through automatic procedures produce biased estimations of %BF. These equations overestimated values in children with low adiposity, while in those with high adiposity, values were underestimated. The equation developed by manual selection in boys yielded estimations without systematic bias (Fig. 1C).
DiscussionThe main aim of this study was to develop equations based on anthropometric measurements to predict %BF for Mexican schoolchildren and adolescents. The four developed equations require measures related to adiposity, linear growth, and body frame. For boys, three equations explained a high proportion of the %BF variance (r2≥92%). Although the equation for girls explained a high proportion of variance (85%), this was lower than that for boys. Another aim of the study was to analyze the validity of previously developed equations. With the exception of Dezenberg's equations, none of previously published equations were valid in the sample of Mexican schoolchildren and adolescents.
In its original population,5 the Slaughter equations had acceptable predictive capacity (r2 from 75% to 78% in the total sample). However, in the Mexican schoolchildren and adolescents, these equations overestimated the %BF. The same trend was observed Indian children,9 Chinese children with obesity,8 and British children.6 The Deurenberg equations26 were developed in 379 Dutch children and adolescents from 7 to 20 years of age and had low to moderate predictive capacity (r2=41% to 69% in the total sample). In the Mexican pediatric population, these equations underestimated %BF in boys and overestimated it in girls. However, the opposite effect occurred in British children.6 Physical differences of Mexican children and adolescents in comparison with those who participated in the Slaughter25 and Deurenberg26 studies could explain the results found in the present study. Participants in the Slaughter25 and Deurenberg26 samples were taller (155.2cm and 164.3cm vs. 144.2cm, respectively) and heavier (47.4kg and 53.9kg vs. 42kg, respectively) than children in the Mexican sample but had lower %BF (16.7% and 15.1% vs. 25.8%, respectively).
In Mexican schoolchildren and adolescents, the estimations obtained with the Dezenberg equations did not tend to systematically over- or underestimate %BF (i.e., the intercept did not differ from the origin). However, the predictive capacity of the Dezenberg equations (r2=68.1% to 77.4% in boys and 62.9% to 79.8% in girls) was lower than those of the equations developed in this study (88.5%–90.2% and 82.1%, respectively). Similar findings were obtained in Cuban schoolchildren.28 Nevertheless, in Latino10 and Indian schoolchildren,9 the Dezenberg equations underestimated %BF; whereas in British schoolchildren theses equations had a bias of 13% in the estimation of %BF measured by deuterium dilution.29
The Huang equations10 were developed in 96 Latino schoolchildren from 7 to 13 years of age from the USA and had an acceptable predictive capacity (r2=86%–97% in the total sample). In the Mexican sample these equations overestimated %BF. Although participants of the Huang study were Latino, they were heavier than the Mexican schoolchildren in the current sample. These differences could reflect the different environments where children from the USA and Mexico live.
The Stevens equations19 were developed with a multi-ethnic sample of 5374 subjects 8–17 years of age and had a predictive capacity up to 85% in boys using DXA as the gold standard. This equation tended to underestimate the %BF in Mexican schoolchildren and adolescents.
The Latin American population has certain physical characteristics such as lower height, short lower extremities, higher levels of body fat in the trunk and abdominal regions, and larger body frame.14–16 For this reason, in the present study, body characteristics related to linear growth (i.e., stature or sitting stature) and body frame (i.e., elbow or bitrochanteric breadth) were measured in addition to those related to adiposity (i.e., skinfolds and waist circumference). In the equations developed for boys, stature had a negative regression coefficient; whereas in girls, the coefficients for elbow breadth and sitting stature index were also negative. This shows that children or adolescents with higher stature or larger body frames tend to have less adiposity. In addition, in the new equation measurements of abdominal and trunk fat were predictors of %BF, including waist circumference and subscapular and suprailiac skinfolds.
One limitation of the study is that a convenient sample was used. Therefore, generalization of these findings should be done with caution. Another limitation is that although DXA is considered an adequate method to measure adiposity,30 its validity in a Mexican population has not been established. In the development of the equations for Mexican children and adolescents, less predictive capacity was observed in girls than boys. This difference by sex has been observed in other samples.19,26 In the future, measurements should be identified that increase the predictive capacity of equations in girls. A main limitation of this research is that a convenience sample of children and adolescents from Mexico City was used, and, therefore, the sample had a specific ethnic composition. In this way, although the developed equations provide an improved estimation of %BF in the sample under study, their use in other populations should be extended with caution. In other words, the validity of these equations should be evaluated in other samples of children from other regions of Mexico and other Latin American countries. This is necessary because the Latin American population is diverse in terms of ethnic ancestry. For example, in the southeast region of Mexico, there is a predominance of Amerindian ancestry over European, whereas in the Northern region the opposite trend is observed.11 Finally, the predictive capacity of the estimated %BF (with the equations published here) to identify clinically relevant outcomes (i.e., cardiovascular risk) should be determined.
In conclusion, the findings indicate that the equations developed based on anthropometric measurements appropriately predict %BF in a heterogeneous group of Mexican schoolchildren and adolescents. In contrast, equations developed in other populations (even with similar ethnic characteristics) have reduced predictive capacity to estimate %BF. Therefore, the equations developed in this study can be used to assess the %BF in Mexican schoolchildren and adolescents, as they demonstrate greater validity and lower error compared with the previously published equations.
Conflicts of interestThe authors declare no conflicts of interest.
The authors are grateful for the support of Magdalena Rodriguez-Magallanes – from the Nutrition, Body Composition, and Energy Expenditure Unit – who standardized the observers who carried out the anthropometric measurements.
The following are the supplementary data to this article:
Please cite this article as: Ortiz-Hernández L, Vega López AV, Ramos-Ibáñez N, Cázares Lara LJ, Medina Gómez RJ, Pérez-Salgado D. Equations based on anthropometry to predict body fat measured by absorptiometry in schoolchildren and adolescents. J Pediatr (Rio J). 2017;93:365–73.


