Thinness can have substantial consequences for child development and health. Adipokines, including leptin and adiponectin, play a significant role in the regulation of important metabolic functions. The aim of this study was to investigate associations between body composition and serum leptin and adiponectin levels in thin and normal-weight children.
MethodsThe authors examined 100 healthy prepubertal children, who were divided into two subgroups: thin (n=50) and normal-weight children (n=50). Body composition was assessed by dual-energy X-ray absorptiometry. Serum concentrations of adipokines were determined by immunoenzymatic assays.
ResultsThin children had a similar body height but significantly lower (p<0.0001) body weight, body mass index, fat mass, lean mass, and bone mineral content compared with normal-weight children. Serum concentrations of leptin were about 2-fold lower (p<0.0001) in thin vs. normal-weight subjects. Serum levels of total adiponectin, adiponectin multimers, and soluble leptin receptor (sOB-R) were similar in both groups. The leptin/soluble leptin receptor ratio and leptin/adiponectin ratios were lower (p<0.0001) in thin vs. normal-weight children. In both groups of children, it was found that body composition parameters were positively related with leptin but not with adiponectin levels. Additionally, bone mineral content was positively related with body mass index, fat mass, lean mass, and leptin level in thin and normal-weight children.
ConclusionsPrepubertal thin children have disturbances in body composition and adipokine profile. Early recognition of thinness and determination of body composition parameters and adipokine levels can be useful in medical and nutritional care of thin children for the optimization of bone mineral accrual.
A magreza pode ter consequências substanciais para o desenvolvimento e a saúde das crianças. As adipocinas, incluindo a leptina e a adiponectina, desempenham um papel significativo na regulação de importantes funções metabólicas. O objetivo do estudo foi investigar as associações entre a composição corporal e os níveis séricos de leptina e adiponectina em crianças magras e com peso normal.
MétodosExaminamos 100 crianças pré-púberes saudáveis, que foram divididas em dois subgrupos: crianças magras (n=50) e com peso normal (n=50). A composição corporal foi avaliada pelo método de absorciometria de dupla energia de raios-X. As concentrações séricas das adipocinas foram determinadas por ensaios imunoenzimáticos.
ResultadosAs crianças magras apresentaram altura semelhante, porém peso corporal (p<0.0001), índice de massa corporal (IMC), massa gorda, massa magra e conteúdo mineral ósseo (CMO) significativamente menores em comparação a crianças com peso normal. As concentrações séricas de leptina foram aproximadamente 2 vezes mais baixas (p<0.0001) em indivíduos magros que em crianças com peso normal. Os níveis séricos de adiponectina total, multímeros de adiponectina e receptor de leptina solúvel (sOB-R) foram semelhantes em ambos os grupos. Os índices de leptina/sOB-R e leptina/adiponectina foram inferiores (p<0.0001) em crianças magras que crianças com peso normal. Em ambos os grupos de crianças, descobrimos que os parâmetros de composição corporal estavam positivamente relacionados à leptina, porém não aos níveis de adiponectina. Além disso, observamos que o CMO estava positivamente relacionado ao IMC, massa gorda, massa magra e ao nível de leptina em crianças magras e com peso normal.
ConclusõesAs crianças pré-púberes magras possuem alterações na composição corporal e no perfil de adipocinas. O reconhecimento precoce da magreza e a determinação dos parâmetros de composição corporal e dos níveis de adipocina podem ser úteis no cuidado médico e nutricional de crianças magras para otimização do acúmulo mineral ósseo.
It is widely recognized that overweight and obesity in childhood should be closely monitored for public health policy reasons.1 However, there is scant research examining the prevalence of thinness in early childhood, despite potential negative consequences for health and development across the course of life. The most widely studied index of nutritional status in adults has been body mass index (BMI). However, the definition of thinness is dissimilar between adults and children. The World Health Organization (WHO) defines thinness as BMI less than the fifth percentile of the reference values for normal-weight children. Cole et al.2 proposed a new graded definition of thinness in childhood and adolescence, based on pooled international data for BMI and linked to the WHO-recommended adult cut-off points. These international BMI cut-offs allow distinctions between different grades of thinness: grade 1 (17 to <18.5 – mild thinness), grade 2 (16 to <17 – moderate thinness), and grade 3 (<16 – severe thinness).
In the literature there are many studies presenting the prevalence of childhood thinness, including severe thinness, in low-income countries.3,4 Thinness was also observed in about 7–11% of Japanese children and 5–6% of Australian children, with a higher proportion in girls than boys.5,6 In developed European countries, thinness has been reported to range from 4.8% to 11.9% in girls, and from 3.1% to 9% in boys, but this prevalence differs by age, sex, and region.7,8 In Poland, depending on the standard used, the prevalence of thinness was diagnosed in about 6–8% of boys and 9–11% of girls.9
It is important to note that not only optimal body weight but body composition, including bone mass, lean mass, and fat mass are relevant to child development and healthy life.10 Changes in body composition, especially in fat mass and its distribution, are associated with alterations in the secretion of adipokines by adipose tissue. Among adipokines, leptin and adiponectin are of particular interest due to their opposing biologic functions and association with body weight. Leptin is an adipocyte-derived hormone, which plays a role not only in regulating appetite, reproductive capacity, and energy consumption, but also in bone metabolism through its paracrine or autocrine action on several systems. Clinical studies have shown that serum leptin concentration is proportional to total body weight and fat mass. Authors have reported elevated serum leptin levels in obesity and reduced levels in conditions of low body weight.11 Leptin interacts directly with the leptin receptor (OB-R), which in humans exists in four known isoforms with different C-terminal cytoplasmatic domains. The soluble leptin receptor (sOB-R) represents the main leptin-binding activity in human blood and modulates leptin levels by binding free leptin in circulation and preventing hormone degradation and clearance.12 Adiponectin is another biologically active adipokine expressed by mature adipocytes. Structurally, adiponectin belongs to the collagen superfamily. Its monomeric subunits, composed of a C-terminal globular domain, oligomerize to trimers that further associate through disulphide bonds with the collagenous domain to form polymeric complexes of a higher structure (hexamers). In serum, adiponectin circulates as high molecular weight (HMW), mid-molecular weight (MMW), and low molecular weight (LMW) adiponectin. HMW adiponectin appears to be an active form and the HMW/total adiponectin ratio is a better indicator of metabolic disturbances than total adiponectin.13 Adiponectin plays a role in many physiological processes, including the metabolism of carbohydrates and fatty acids, insulin resistance, inflammation, and bone metabolism. Studies have shown that serum levels of adiponectin inversely correlate with BMI, fat mass, and bone mineral density in children and adults.14
Until now, studies regarding body composition and adipokine status have mainly focused on obese patients. Authors have reported hyperleptinemia and hypoadiponectinemia associated with increased insulin resistance, diabetes, and metabolic syndrome in these subjects.15–17 As yet, there have been limited reports regarding body composition and serum adipokine status in thin subjects, especially in prepubertal children. It is an important problem, because the prevalence of thinness among children, especially girls, has increased according to data from several countries.
The aim of the present study was (a) to examine the differences in body composition and adipokine levels among thin and normal-weight prepubertal children and (b) to investigate the possible association between the biochemical and anthropometric parameters in these groups of children.
MethodsThe study included 100 children aged 5–10 years recruited between January 2014 and November 2015 from a group of consecutive patients seeking dietary counseling in the Department of Nutrition at the Institute of Mother and Child in Warsaw. Children qualified for the study were generally healthy, well-nourished, without endocrine disorders or genetic syndromes, without diseases that could affect nutritional status, growth, and pubertal development, and not requiring constant intake of medications. All children lived in an urban area in families with good economic status and remained on a mixed diet. Pubertal stage was assessed according to the Tanner scale. Children classified as Tanner stage 1 were included in this study, but subjects who showed pubertal development were excluded. According to Cole's international BMI cut-off points, the subjects were divided into two groups: thin children (n=50) and normal-weight children (n=50).
The study was conducted according to the principles of the Declaration of Helsinki and was approved by the Ethics Committee of the Institute of Mother and Child. Written informed consent was obtained from all parents of the children before their participation in the study.
Anthropometric measurements such as body height and weight were performed. Body height was measured with a stadiometer and recorded with a precision of 0.1cm and body weight was assessed unclothed with a calibrated balance scale to the nearest 0.1kg. BMI was calculated as body weight (kg) divided by height squared (m2). Body composition (fat mass [FM], lean mass [LM], bone mineral content [BMC]) was measured by dual-energy X-ray absorptiometry (DXA) using the Lunar Prodigy with pediatric software version 9.30.044 (General Electric Healthcare, WI, USA). All children were measured by trained staff with the same equipment, using standard positioning techniques.
Venous blood samples were collected in the morning hours between 8:00 and 10:00 am after an overnight fast and centrifuged at 1000g for 10min at 4°C. Serum samples were stored at −20°C until biochemical assay, but no longer than two months. Concentrations of leptin and sOB-R were determined using enzyme-linked immunosorbent assay (ELISA) kits from DRG Diagnostics (Marburg, Germany). Intra-assay variations (coefficient of variation [CV%]) were 5.95% and 7.10% for leptin and sOB-R, respectively. Inter-assay CVs were 8.66% and 6.21% for leptin and sOB-R, respectively. Serum levels of total adiponectin and its multimers were determined using an ELISA kit from ALPCO (Salem, NH, USA). This assay is designed for quantitative determination of total adiponectin as well as HMW, MMW, and LMW adiponectin. Adiponectin multimers were selectively measured after sample pretreatment with two proteases that specifically digested the trimeric forms, or both the hexameric and trimeric forms. Using this method, both total and HMW adiponectin were determined directly, but MMW adiponectin was calculated by subtracting the concentration of HMW from the concentration of combined MMW+HMW adiponectin and LMW adiponectin by subtracting the concentration of combined MMW+HMW from total adiponectin. In this assay, the detection limit was 0.019ng/mL, intra-assay CVs were 5.4% for total adiponectin and 5.0% for HMW adiponectin, and inter-assay variations were 5.0% and 5.7% for total and HMW adiponectin, respectively.
The obtained results were statistically analyzed using SPSS version 23.0 software (IBM SPSS Statistics for Windows, NY, USA). All variables were tested for normality using the Kolmogorov–Smirnov test. Data are presented as means±standard deviation (SD) for normally distributed data or medians and interquartile ranges (25–75th percentiles) for skewed distribution. Group differences were assessed using Student's t-test or the Mann–Whitney U test, as appropriate. Differences in anthropometric and biochemical parameters between children with thinness grades 1–3 were assessed by exact Jonckheere–Tentra test (p-value for trend). Multivariate regression analyses were performed with BMC, leptin (expressed as natural logarithm [ln]), and adiponectin as dependent variables, and anthropometric and biochemical parameters were selected as independent variables (separate models adjusted for age and sex) in thin and normal-weight groups. A p-value less than 0.05 was considered significant for all analyses.
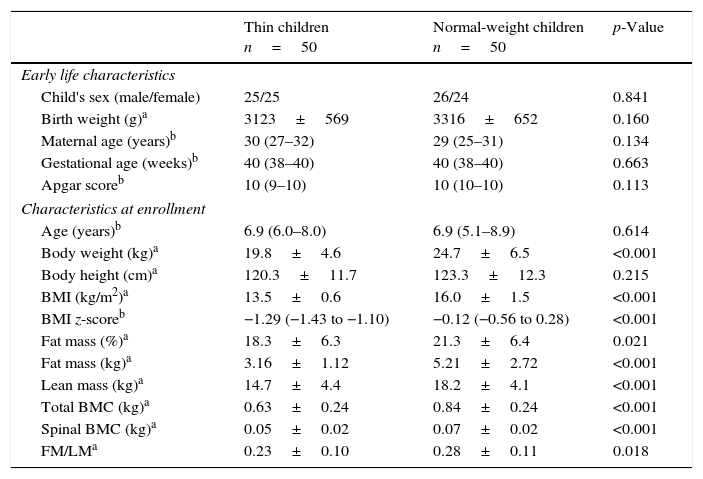
ResultsData on the children's characteristics and anthropometry are presented in Table 1. The studied children were generally healthy. There was no difference in early life characteristics, such as maternal age, gestational age, or Apgar score. Thin children had a slightly lower birth weight than normal-weight children, but this difference was not statistically significant. Thin children did not differ in age, sex, or height compared with normal-weight children. However, thin subjects had significantly lower (p<0.001) body weight, BMI, fat mass, and lean mass. The median values of total BMC and spine BMC were decreased (p<0.001) in the group of thin children compared with the normal-weight group. Additionally, the ratio of FM/LM was also lower (p<0.05) in thin subjects.
Children's characteristics and anthropometry.
| Thin children n=50 | Normal-weight children n=50 | p-Value | |
|---|---|---|---|
| Early life characteristics | |||
| Child's sex (male/female) | 25/25 | 26/24 | 0.841 |
| Birth weight (g)a | 3123±569 | 3316±652 | 0.160 |
| Maternal age (years)b | 30 (27–32) | 29 (25–31) | 0.134 |
| Gestational age (weeks)b | 40 (38–40) | 40 (38–40) | 0.663 |
| Apgar scoreb | 10 (9–10) | 10 (10–10) | 0.113 |
| Characteristics at enrollment | |||
| Age (years)b | 6.9 (6.0–8.0) | 6.9 (5.1–8.9) | 0.614 |
| Body weight (kg)a | 19.8±4.6 | 24.7±6.5 | <0.001 |
| Body height (cm)a | 120.3±11.7 | 123.3±12.3 | 0.215 |
| BMI (kg/m2)a | 13.5±0.6 | 16.0±1.5 | <0.001 |
| BMI z-scoreb | −1.29 (−1.43 to −1.10) | −0.12 (−0.56 to 0.28) | <0.001 |
| Fat mass (%)a | 18.3±6.3 | 21.3±6.4 | 0.021 |
| Fat mass (kg)a | 3.16±1.12 | 5.21±2.72 | <0.001 |
| Lean mass (kg)a | 14.7±4.4 | 18.2±4.1 | <0.001 |
| Total BMC (kg)a | 0.63±0.24 | 0.84±0.24 | <0.001 |
| Spinal BMC (kg)a | 0.05±0.02 | 0.07±0.02 | <0.001 |
| FM/LMa | 0.23±0.10 | 0.28±0.11 | 0.018 |
Data were analyzed using aStudent's t-test or the bMann–Whitney test and presented as amean values±SD, or bmedians and interquartile ranges (25–75th percentiles).
BMI, body mass index; BMC, bone mineral content; FM, fat mass; LM, lean mass.
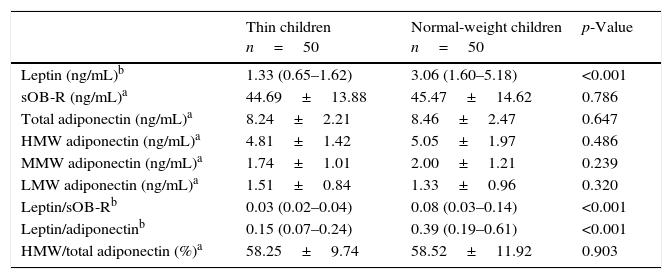
Regarding adipokine levels, a more than 2-fold lower serum leptin level was found in thin children vs. normal-weight peers (Table 2). In the two studied groups, there were no differences in total adiponectin concentrations and its multimers (HMW, MMW, and LMW) as well as sOB-R. Additionally, the percentage of HMW adiponectin to total adiponectin was comparable in thin and normal-weight children. Hence, the ratios of leptin to sOB-R and leptin to total adiponectin were significantly lower (p<0.0001) in thin children.
Serum concentrations of adipokines in groups of thin and normal-weight children.
| Thin children n=50 | Normal-weight children n=50 | p-Value | |
|---|---|---|---|
| Leptin (ng/mL)b | 1.33 (0.65–1.62) | 3.06 (1.60–5.18) | <0.001 |
| sOB-R (ng/mL)a | 44.69±13.88 | 45.47±14.62 | 0.786 |
| Total adiponectin (ng/mL)a | 8.24±2.21 | 8.46±2.47 | 0.647 |
| HMW adiponectin (ng/mL)a | 4.81±1.42 | 5.05±1.97 | 0.486 |
| MMW adiponectin (ng/mL)a | 1.74±1.01 | 2.00±1.21 | 0.239 |
| LMW adiponectin (ng/mL)a | 1.51±0.84 | 1.33±0.96 | 0.320 |
| Leptin/sOB-Rb | 0.03 (0.02–0.04) | 0.08 (0.03–0.14) | <0.001 |
| Leptin/adiponectinb | 0.15 (0.07–0.24) | 0.39 (0.19–0.61) | <0.001 |
| HMW/total adiponectin (%)a | 58.25±9.74 | 58.52±11.92 | 0.903 |
Data were analyzed using aStudent's t-test or the bMann–Whitney test and presented as amean values±SD, or bmedians and interquartile ranges (25–75th percentiles).
sOB-R, soluble leptin receptor; HMW, high molecular weight; MMW, mid-molecular weight; LMW, low molecular weight.
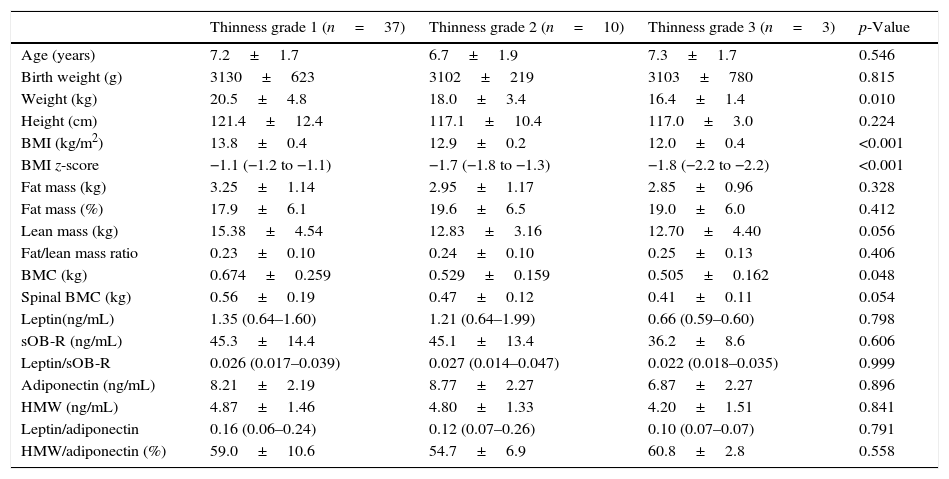
According to Cole's cut-off points, thin children were classified into three subgroups: grade 1 (74%), grade 2 (20%), and grade 3 (6%). Significant differences in weight (p<0.01), BMI (p<0.001), BMI z-score (p<0.001), BMC (p<0.05), lean mass (p=0.056), and spinal BMC (p=0.054) were observed among the subgroups (grades 1–3) of thin children (Table 3).
Comparison of anthropometric and biochemical parameters in the subgroups of thin children (grades 1–3).
| Thinness grade 1 (n=37) | Thinness grade 2 (n=10) | Thinness grade 3 (n=3) | p-Value | |
|---|---|---|---|---|
| Age (years) | 7.2±1.7 | 6.7±1.9 | 7.3±1.7 | 0.546 |
| Birth weight (g) | 3130±623 | 3102±219 | 3103±780 | 0.815 |
| Weight (kg) | 20.5±4.8 | 18.0±3.4 | 16.4±1.4 | 0.010 |
| Height (cm) | 121.4±12.4 | 117.1±10.4 | 117.0±3.0 | 0.224 |
| BMI (kg/m2) | 13.8±0.4 | 12.9±0.2 | 12.0±0.4 | <0.001 |
| BMI z-score | −1.1 (−1.2 to −1.1) | −1.7 (−1.8 to −1.3) | −1.8 (−2.2 to −2.2) | <0.001 |
| Fat mass (kg) | 3.25±1.14 | 2.95±1.17 | 2.85±0.96 | 0.328 |
| Fat mass (%) | 17.9±6.1 | 19.6±6.5 | 19.0±6.0 | 0.412 |
| Lean mass (kg) | 15.38±4.54 | 12.83±3.16 | 12.70±4.40 | 0.056 |
| Fat/lean mass ratio | 0.23±0.10 | 0.24±0.10 | 0.25±0.13 | 0.406 |
| BMC (kg) | 0.674±0.259 | 0.529±0.159 | 0.505±0.162 | 0.048 |
| Spinal BMC (kg) | 0.56±0.19 | 0.47±0.12 | 0.41±0.11 | 0.054 |
| Leptin(ng/mL) | 1.35 (0.64–1.60) | 1.21 (0.64–1.99) | 0.66 (0.59–0.60) | 0.798 |
| sOB-R (ng/mL) | 45.3±14.4 | 45.1±13.4 | 36.2±8.6 | 0.606 |
| Leptin/sOB-R | 0.026 (0.017–0.039) | 0.027 (0.014–0.047) | 0.022 (0.018–0.035) | 0.999 |
| Adiponectin (ng/mL) | 8.21±2.19 | 8.77±2.27 | 6.87±2.27 | 0.896 |
| HMW (ng/mL) | 4.87±1.46 | 4.80±1.33 | 4.20±1.51 | 0.841 |
| Leptin/adiponectin | 0.16 (0.06–0.24) | 0.12 (0.07–0.26) | 0.10 (0.07–0.07) | 0.791 |
| HMW/adiponectin (%) | 59.0±10.6 | 54.7±6.9 | 60.8±2.8 | 0.558 |
Data were analyzed using the Jonckheere–Terpstra exact test (p for trend) and presented as mean values±SD or as medians and interquartile ranges (25–75th percentiles), according to previous tables.
BMI, body mass index; BMC, bone mineral content; sOB-R, soluble leptin receptor; HMW, high molecular weight adiponectin.
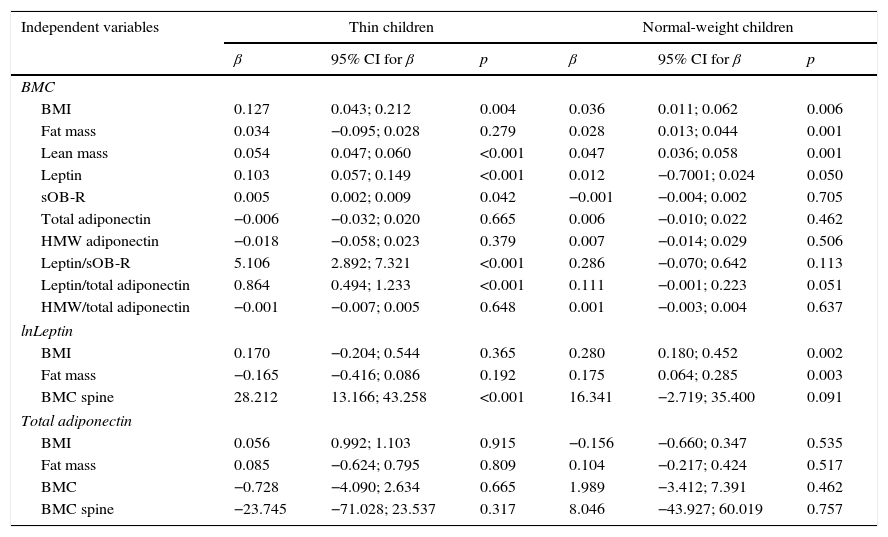
In multivariante regression analyses, BMC was significantly correlated with BMI (p<0.01), lean mass (p<0.001), leptin (<0.001), and OB-R (p<0.05) in thin children and with BMI (p<0.01), fat mass (p<0.001), lean mass (p<0.001), and leptin (p=0.05) in normal-weight subjects (Table 4). Serum leptin level was highly correlated with BMC (p<0.001) and spinal BMC (p<0.001) in thin subjects, whereas, in the normal-weight group, a relationship was found between leptin and BMI (p<0.01), fat mass (p<0.01), and BMC (p=0.05). No correlations were observed between serum levels of adiponectin and body composition parameters in both groups of children.
Multivariate regression with BMC, leptin, and total adiponectin as dependent variables and selected anthropometric and biochemical parameters as the independent variables (separate models adjusted for age and sex).
| Independent variables | Thin children | Normal-weight children | ||||
|---|---|---|---|---|---|---|
| β | 95% CI for β | p | β | 95% CI for β | p | |
| BMC | ||||||
| BMI | 0.127 | 0.043; 0.212 | 0.004 | 0.036 | 0.011; 0.062 | 0.006 |
| Fat mass | 0.034 | −0.095; 0.028 | 0.279 | 0.028 | 0.013; 0.044 | 0.001 |
| Lean mass | 0.054 | 0.047; 0.060 | <0.001 | 0.047 | 0.036; 0.058 | 0.001 |
| Leptin | 0.103 | 0.057; 0.149 | <0.001 | 0.012 | −0.7001; 0.024 | 0.050 |
| sOB-R | 0.005 | 0.002; 0.009 | 0.042 | −0.001 | −0.004; 0.002 | 0.705 |
| Total adiponectin | −0.006 | −0.032; 0.020 | 0.665 | 0.006 | −0.010; 0.022 | 0.462 |
| HMW adiponectin | −0.018 | −0.058; 0.023 | 0.379 | 0.007 | −0.014; 0.029 | 0.506 |
| Leptin/sOB-R | 5.106 | 2.892; 7.321 | <0.001 | 0.286 | −0.070; 0.642 | 0.113 |
| Leptin/total adiponectin | 0.864 | 0.494; 1.233 | <0.001 | 0.111 | −0.001; 0.223 | 0.051 |
| HMW/total adiponectin | −0.001 | −0.007; 0.005 | 0.648 | 0.001 | −0.003; 0.004 | 0.637 |
| lnLeptin | ||||||
| BMI | 0.170 | −0.204; 0.544 | 0.365 | 0.280 | 0.180; 0.452 | 0.002 |
| Fat mass | −0.165 | −0.416; 0.086 | 0.192 | 0.175 | 0.064; 0.285 | 0.003 |
| BMC spine | 28.212 | 13.166; 43.258 | <0.001 | 16.341 | −2.719; 35.400 | 0.091 |
| Total adiponectin | ||||||
| BMI | 0.056 | 0.992; 1.103 | 0.915 | −0.156 | −0.660; 0.347 | 0.535 |
| Fat mass | 0.085 | −0.624; 0.795 | 0.809 | 0.104 | −0.217; 0.424 | 0.517 |
| BMC | −0.728 | −4.090; 2.634 | 0.665 | 1.989 | −3.412; 7.391 | 0.462 |
| BMC spine | −23.745 | −71.028; 23.537 | 0.317 | 8.046 | −43.927; 60.019 | 0.757 |
BMI, body mass index; BMC, bone mineral content; sOB-R, soluble leptin receptor; HMW, high molecular weight adiponectin; CI, confidence interval; leptin is expressed as ln, natural logarithm.
Both extremes of the spectrum of weight, from obesity to underweight, may have serious health consequences for individuals. Studies in obese patients, and at the opposite end of the weight spectrum in patients with anorexia nervosa, have shown associations between body composition and bone status.18,19 In adults, low body weight is established as a predictor of low bone mineral content and a risk factor for fracture. There are only a few reports assessing body composition in thin healthy children.20–22
In the present study, differences in body composition were observed regarding lower fat mass, lean mass, and the ratio of fat mass to lean mass in thin children compared with normal-weight peers. Similar to these results, a clinical study conducted in Australia demonstrated that thin school children were less muscular, weaker, and less active than their normal-weight peers.20 These authors suggested that such children may have a range of significant health problems, including lower skeletal mass and increased risk of osteoporosis in later life. In the present study's thin subjects, lower median values of total BMC were found, as well as spinal BMC compared with normal-weight children. In this group of children, BMC was positively correlated with BMI, lean mass, serum leptin level, serum sOB-R level, ratio of leptin to sOB-R, and ratio of leptin to total adiponectin. Also, Pietrobelli et al.21 reported that fat mass and lean mass were independently associated with bone mineral content in children and adolescents. Vaitkeviciute et al.,22 in a group of underweight boys, observed significantly lower body mass, fat mass, lean mass, and BMC compared with normal-weight boys. These authors suggested that thinness in childhood indicated a greater chance of lower bone mineral density in the future. The present study's results as well as the observations from other studies support the hypothesis that in thin children there are alterations in body composition and that a close association exists between body composition and bone mineral density. Moreover, bone status during childhood might be a strong predictor of bone status in young adulthood, when peak bone mass is achieved.
Recent advances from basic and clinical studies confirm the important role of adipokines in many metabolic processes.23 Among them, leptin and adiponectin are unique hormones because their levels reflect the degree of fat accrual and they appear to be pleiotropic mediators. Changes in adipokine levels also modulate bone metabolism. Numerous studies have shown leptin and adiponectin secretory dynamics across the weight spectrum and the authors have concluded that the profile of adipokines in lean and obese subjects is different.11,24
There are scant reports about adipokine status in thin healthy subjects. Ebert et al.25 observed significantly higher serum levels of adiponectin and resistin and lower concentrations of leptin in lean healthy adults compared with overweight/obese subjects. However, Moscavitch et al.26 reported comparable adiponectin levels in lean and overweight subjects. These results support the notion that several adipokines might be regulated in a different manner in lean adults compared with overweight or obese subjects and patients with eating disorders. As yet, in thin prepubertal children, the assessment of serum adipokines and their interrelations with body composition have not been ascertained in detail. Studies on adiponectin multimers are especially scarce.
In the group of thin children, the present study observed significantly lower serum leptin levels than in normal-weight children, and similar concentrations of total adiponectin as well as adiponectin multimers in both groups of children. Hence, the ratios of leptin to OB-R and leptin to adiponectin were significantly lower in thin subjects. Similarly, Martos-Moreno et al.27 found significantly lower concentrations of leptin and comparable values of total adiponectin and HMW adiponectin in thin prepubertal Spanish children vs. controls. In addition, Murdolo et al.28 analyzed prepubertal Italian children and observed that leptin levels increased progressively from thin to overweight children. Additionally, the authors reported comparable concentrations of total adiponectin in lean and obese subjects, but also a tendency toward decreased levels of HMW adiponectin in obese subjects. They suggested that leptin and the leptin/HMW adiponectin ratio differed between lean and overweight individuals, and was significantly higher in those with adiposity. These studies as well as the present work showed that adipokine profiles were different in children with various BMIs. Notably, leptin, rather than adiponectin, emerges as a marker of the degree of adiposity in the young thin population. As expected, a significant positive association was demonstrated between serum leptin levels and anthropometric parameters in thin and normal-weight children. However, no correlations were observed between adiponectin levels and body composition parameters in both groups of children. Other researchers also found positive correlations between leptin levels and body composition parameters in adults and in children, and suggested a strong association of fat mass with leptin at every age, which is consistent with the notion that leptin acts as a signal of adiposity.29
Some studies reported that a number of early life characteristics – such as birth weight, gestational age, and maternal age at birth – might be associated with weight status and risk of thinness.8,30 In the present group of children there were no significant differences in birth weight, Apgar score, gestational age, or maternal age at birth. The thin children were healthy, without malnutrition or eating disorders, and almost 75% were classified as having mild thinness.
This study had a few potential limitations. First, the sample size was relatively small (especially after dividing the participants into subgroups according to grade of thinness), which lacks sufficient power to detect moderate associations with statistical significance. However, the studied group was homogeneous; all children were Caucasian, comparable in age and sex, living in an urban area. Second, there was lack of detailed nutritional and physical activity data for the studied children, but these children were healthy, without eating disorders, and remained on a traditional mixed diet. Third, only leptin and adiponectin concentrations were detected; other adipokines were not measured. However, the authors are planning to determine resistin, visfatin, and apelin in thin children. Additionally, not only total adiponectin concentrations were determined, but also HMW, MMW, and LMW multimers of adiponectin.
In conclusion, these findings demonstrate that as early as in prepubertal age, thin children exhibit a different body composition and pattern of adipokines, with major differences in leptin levels. Decreased BMC might be associated with lower serum leptin levels and the proportions of leptin to adiponectin in thin children. Early recognition of both underweight and overweight youth and the accompanying consequences on bone metabolism are important for the optimization of bone mineral accrual and prevention of bone loss. It is suggested that monitoring of body composition and adipokine status can be useful in medical and nutritional care of thin children to prevent health risks and reduce some diseases in later life.
Conflicts of interestThe authors declare no conflicts of interest.
The authors thank the staff of the Department of Internal Medicine, Endocrinology, and Diabetology at the Central Clinical Hospital of the Ministry of the Interior in Warsaw for their help in DXA measurements.
Please cite this article as: Ambroszkiewicz J, Gajewska J, Szamotulska K, Rowicka G, Klemarczyk W, Chełchowska M. Comparison of body composition and adipokine levels between thin and normal-weight prepubertal children. J Pediatr (Rio J). 2017;93:428–35.


