Given the importance of incorporating simple and low-cost tools into the pediatric clinical setting to provide screening for insulin resistance, the present study sought to investigate whether waist-to-height ratio is comparable to biochemical markers for the discrimination of insulin resistance in children and adolescents.
MethodsThis cross-sectional study involved students from nine public schools. In total, 296 children and adolescents of both sexes, aged 8–14 years, composed the sample. Waist-to-height ratio, triglycerides/glucose index, and triglycerides-to-HDL-C ratio were determined according to standard protocols. Insulin resistance was defined as homeostatic model assessment for insulin resistance with cut-off point ≥ 3.16.
ResultsAge, body mass index, frequency of overweight, waist circumference, waist-to-height ratio, insulin, glucose, homeostatic model assessment for insulin resistance, triglycerides, triglycerides/glucose index, and triglycerides-to-HDL-C were higher among insulin resistant boys and girls. Moderate correlation of all indicators (waist-to-height ratio, triglycerides/glucose index, and triglycerides-to-HDL-C ratio) with homeostatic model assessment for insulin resistance was observed for both sexes. The areas under the receiver operational characteristic curves ware similar between waist-to-height ratio and biochemical markers.
ConclusionThe indicators provided similar discriminatory power for insulin resistance. However, taking into account the cost-benefit ratio, we suggest that waist-to-height ratio may be a useful tool to provide screening for insulin resistance in pediatric populations.
Considerando a importância de incorporar ferramentas simples e de baixo custo no cenário clínico-pediátrico para a triagem de resistência à insulina, o presente estudo buscou investigar se a razão cintura/estatura é comparável a marcadores bioquímicos na discriminação de resistência à insulina em crianças e adolescentes.
MétodosEste estudo transversal envolveu estudantes de nove escolas públicas. No total, 296 crianças e adolescentes, de ambos os sexos, com idades entre 8 e 14 anos, compuseram a amostra. A razão cintura/estatura, o índice triglicerídeos/glicose e a razão triglicerídeos/HDL-C foram determinados de acordo com protocolos padrão. A resistência à insulina foi definida por meio do modelo de avaliação homeostática para resistência insulínica, com ponto de corte ≥ 3.16.
ResultadosIdade, índice de massa corporal, frequência de excesso de peso, circunferência da cintura, razão cintura/estatura, insulina, glicemia, modelo de avaliação homeostática para resistência insulínica, triglicerídeos, índice triglicerídeos/glicose e razão triglicerídeos/HDL-C foram maiores entre meninos e meninas com resistência à insulina. Também foram observadas, em ambos os sexos, correlações moderadas de todos os indicadores (razão cintura/estatura, índice triglicerídeos/glicose e razão triglicerídeos/HDL-C) com o modelo de avaliação homeostática para resistência à insulina. As áreas sob as curvas ROC foram semelhantes entre a razão cintura/estatura e os marcadores bioquímicos.
ConclusãoOs indicadores forneceram poder discriminatório similar para a resistência à insulina. No entanto, levando em conta o custo-benefício, sugerimos que a razão cintura/estatura pode ser uma ferramenta útil para a triagem de resistência à insulina em populações pediátricas.
Insulin resistance (IR) is defined as decreased tissue response to insulin-mediated cellular actions and is the inverse of insulin sensitivity.1 In adults, IR has been associated with obesity, metabolic syndrome, hypertension, and cardiovascular disease.2 In addition, it is recognized as a determining condition for the development of type 2 diabetes mellitus (T2D). The scenario is similar among children, since studies have shown that IR is significantly associated with obesity and cardiometabolic risk.3
The assessment of IR is clinically relevant and can be performed by several methods. Hyperinsulinemic-euglycemic clamp is the gold standard test to diagnose IR. However, it is expansive, invasive, and not easily available in clinical settings.4 An alternative and widely used method in clinical practice is the homeostasis model assessment for insulin resistance (HOMA-IR). However, HOMA-IR also depends on fasting blood collection and plasma insulin assay, which is expensive and not available in many clinics dedicated to primary care.5 Hence, cheaper biomarkers such as the triglycerides/glucose index (TyG index)6 and the triglycerides-to-HDL-C ratio (TG/HDL-C)7 have been proposed.
Cutoff values for HOMA-IR in pediatric populations are quite variable.8 According to the results of a systematic review, of all studies that established cutoffs using ROC curve, the lowest cutoffs for HOMA-IR reported in the literature were 1.65 and 1.95 for girls and boys, respectively, whereas the highest were 3.82 and 5.22.9 Moreover, a Korean study conducted with data from 3313 children and adolescents, aged 10–18 years, established optimum cutoff values for HOMA-IR and the TyG index to provide screening for insulin resistance according to three different criteria.10 Dependent on the criterion for metabolic syndrome, cutoffs for HOMA-IR varied from 2.96 to 3.69 for girls and from 2.86 to 3.54 for boys.
Although obtaining lipid fractions and glucose levels is relatively cheaper than obtaining insulin levels to calculate HOMA-IR, biochemical exams always require some cost, besides the need for fasting blood collection.
Studies on the effectiveness of biochemical markers compared to anthropometric indicators to provide screening for IR are scarce in the literature. Therefore, given the importance of incorporating simple and low cost tools into the pediatric clinical setting to provide screening for IR, the present study sought to investigate whether waist-to-height ratio (WHtR) is comparable to biochemical indicators for the discrimination of IR in Brazilian children and adolescents.
MethodsStudy design and populationThe sample of this study came from nine public schools of the municipality of Vitória, a city located in the southeast of Brazil. All students aged 8–14 years were invited directly by the researchers to take part in a study encompassing a survey on life style as well as clinical and laboratory exams.
The sample size calculated to detect a difference of 0.50 in the value of HOMA-IR with error of 5% and power of 90% was 269. From July 2016 to February 2017, the students attended to the Cardiovascular Investigation Clinic located at the University Hospital to undergo clinical and laboratory exams. All data were collected in a single visit by trained investigators previously certified by a senior investigator. All clinical procedures were performed by a single investigator to avoid inter-observer bias.
For the present investigation, all individuals who had valid data from biochemical and anthropometric exams were included in the final analysis, totaling 296 children and adolescents.
The project was approved by the Institutional Ethics Committee (protocol 1.471.441/1.565.490) and was carried out in accordance with to the provisions of the Declaration of Helsinki. Written informed consent was obtained from parents or legal guardians before enrollment.
Pubertal statusThe pubertal status was self-reported using Tanner scale. The categories (prepubescent, pubescent, and post-pubescent) were formed taking into account the criteria validated for both sexes.11,12 Briefly, sexual maturity rating was defined by a combination between the five stages for breast and pubic hair development among girls and genital and pubic hair development among boys. As an example, a 13-year-old girl who self-identified as stage 3 for their breast development and stage 3 for pubic hair, was classified as pubescent by the observer. Despite the limitations of Tanner stages, self-reported sexual maturation has been validated against serum hormone markers.13
AnthropometryWeight was obtained to the nearest 50g with a calibrated electronic scale, with barefoot individuals using only underwear. Height was obtained to the nearest 0.1cm with a wall-mounted scale. Body mass index (BMI) was calculated as the ratio between weight and height squared (kg/m2). Waist circumference (WC) was measured at the mid-point between the lower costal margin and the level of the anterior superior iliac crest. Waist-to-height ratio (WHtR) was calculated by dividing WC in centimeters by height in centimeters.
Overweight was defined by categorizing BMI-for-age Z-score >+1 in accordance with the standards of the World Health Organization (WHO).14
Blood pressure measurementBlood pressure (BP) was measured in the left arm by using an automatic validated device (Omrom 705CP; Intellisense – Japan) after a resting period of 5min in the sitting position.15 Three consecutive readings with a minimum interval of 1min between measurements were taken from each subject. In a case of variation more than 5mmHg between measurement two and three, a fourth measurement was performed and the two measurements with difference lower than 5mmHg were averaged. Systolic blood pressure (SBP) and diastolic blood pressure (DBP) were calculated as the arithmetic mean of two measurements with difference lower than 5mmHg.16
Biochemical examinationBlood collection was obtained by venipuncture after overnight fast (8–14h) and sent to a central laboratory (Laboratório Tommasi, Vitória, Brazil) to determine serum concentrations of total cholesterol (TC), high-density lipoprotein cholesterol (HDL-C), triglycerides (TG), glucose, and uric acid.
Low-density lipoprotein cholesterol (LDL-C) was calculated by the Friedwald's equation for those with triglycerides≤400mg/dL.17 Serum insulin levels were measured using an electrochemiluminescence immunoassay and all dosages were performed with commercially available kits. The triglycerides-to-HDL-C ratio (TG/HDL-C) was calculated by dividing TG (mg/dL) by HDL-C (mg/dL). The TyG index was calculated using the formula: (1) ln[TG(mg/dL)×fastingglucose(mg/dL)/2].7
IR was estimated using HOMA-IR index: (2) [fastinginsulin(U/mL)×fastingglucose (mmol/L)/22.5].18 In this study, the presence of IR was defined using the cutoff of 3.16 for HOMA-IR, as previously set for boys and girls.19
Statistical analysisContinuous variables were presented as means and standard deviations, and categorical variables were presented as percentages. The comparison between sexes for the continuous variables was conducted using the unpaired Student's t-test, and the comparison of proportions was performed with the Chi-squared test.
Anthropometric, hemodynamic, and biochemical variables were compared between insulin resistant and non-insulin resistant boys and girls using analysis of covariance (ANCOVA), with adjustment for age.
Partial correlation coefficients adjusted for age were used to estimate associations between HOMA-IR and anthropometric/biochemical indicators.
Receiver operational characteristic (ROC) curves were drawn for each one of the indicators and area under the curve (AUC) was used to analyze the discriminatory power for IR. The Epi package of the software R was used to provide adjustment for age.
Statistical analyses were carried out using SPSS software (version 19.0 – Chicago, IL, United States), with the level of significance set at 5%.
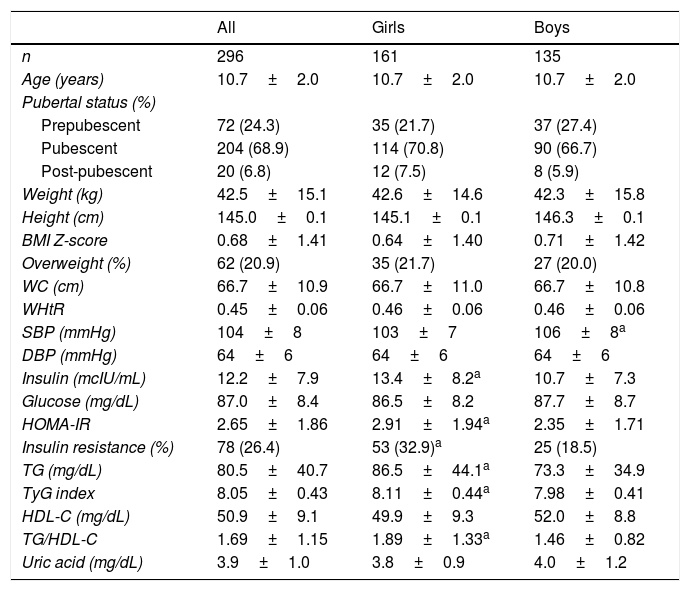
ResultsClinical, demographic, anthropometric, and biochemical data stratified by sex are summarized in Table 1. TG, TG/HDL-C ratio, TyG index, insulin, HOMA-IR, and IR percentage were higher in girls, while SBP was higher in boys. In addition, the proportion of IR observed was 32.9% among girls and 18.5% among boys (p<0.001).
General characteristics of the sample.
| All | Girls | Boys | |
|---|---|---|---|
| n | 296 | 161 | 135 |
| Age (years) | 10.7±2.0 | 10.7±2.0 | 10.7±2.0 |
| Pubertal status (%) | |||
| Prepubescent | 72 (24.3) | 35 (21.7) | 37 (27.4) |
| Pubescent | 204 (68.9) | 114 (70.8) | 90 (66.7) |
| Post-pubescent | 20 (6.8) | 12 (7.5) | 8 (5.9) |
| Weight (kg) | 42.5±15.1 | 42.6±14.6 | 42.3±15.8 |
| Height (cm) | 145.0±0.1 | 145.1±0.1 | 146.3±0.1 |
| BMI Z-score | 0.68±1.41 | 0.64±1.40 | 0.71±1.42 |
| Overweight (%) | 62 (20.9) | 35 (21.7) | 27 (20.0) |
| WC (cm) | 66.7±10.9 | 66.7±11.0 | 66.7±10.8 |
| WHtR | 0.45±0.06 | 0.46±0.06 | 0.46±0.06 |
| SBP (mmHg) | 104±8 | 103±7 | 106±8a |
| DBP (mmHg) | 64±6 | 64±6 | 64±6 |
| Insulin (mcIU/mL) | 12.2±7.9 | 13.4±8.2a | 10.7±7.3 |
| Glucose (mg/dL) | 87.0±8.4 | 86.5±8.2 | 87.7±8.7 |
| HOMA-IR | 2.65±1.86 | 2.91±1.94a | 2.35±1.71 |
| Insulin resistance (%) | 78 (26.4) | 53 (32.9)a | 25 (18.5) |
| TG (mg/dL) | 80.5±40.7 | 86.5±44.1a | 73.3±34.9 |
| TyG index | 8.05±0.43 | 8.11±0.44a | 7.98±0.41 |
| HDL-C (mg/dL) | 50.9±9.1 | 49.9±9.3 | 52.0±8.8 |
| TG/HDL-C | 1.69±1.15 | 1.89±1.33a | 1.46±0.82 |
| Uric acid (mg/dL) | 3.9±1.0 | 3.8±0.9 | 4.0±1.2 |
BMI Z, BMI-for-age Z-scores; SBP, systolic blood pressure; DBP, diastolic blood pressure; HDL-C, high-density lipoprotein cholesterol; HOMA-IR, homeostasis model assessment-insulin resistance; LDL-C, low-density lipoprotein cholesterol; TC, total cholesterol; TG, triglycerides; TG/HDL-C, triglycerides-to-HDL-C ratio; TyG index, triglycerides/glucose index; WC, waist circumference; WHtR, waist-to-height ratio.
Overweight: BMI-for-age Z-scores >+1.
Insulin resistance: HOMA-IR≥3.16.
Continuous data are expressed as mean±standard deviation and categorical variable is expressed as number (percentage).
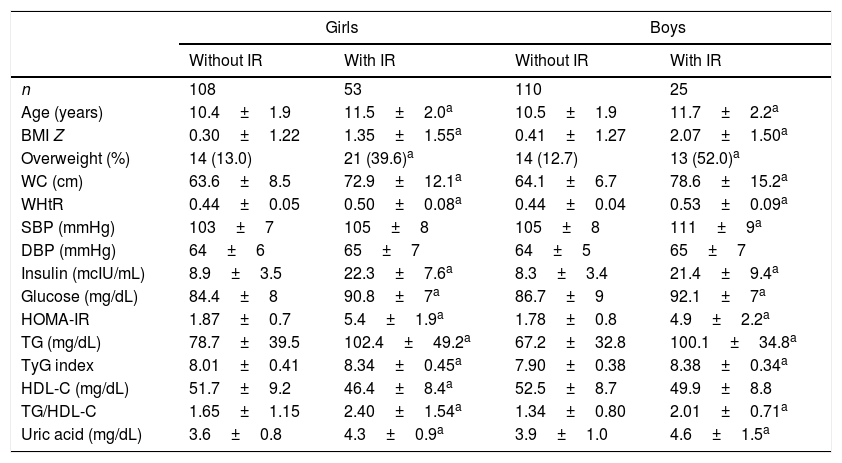
Table 2 shows the clinical, demographic, anthropometric, and biochemical data stratified by IR status for both sexes. The proportion of overweight, SBP, TG, TG/HDL-C ratio, TyG index, fasting insulin, glucose, HOMA-IR, and uric acid were higher in the insulin resistant of both sexes.
Clinical characteristics according the status of insulin resistance.
| Girls | Boys | |||
|---|---|---|---|---|
| Without IR | With IR | Without IR | With IR | |
| n | 108 | 53 | 110 | 25 |
| Age (years) | 10.4±1.9 | 11.5±2.0a | 10.5±1.9 | 11.7±2.2a |
| BMI Z | 0.30±1.22 | 1.35±1.55a | 0.41±1.27 | 2.07±1.50a |
| Overweight (%) | 14 (13.0) | 21 (39.6)a | 14 (12.7) | 13 (52.0)a |
| WC (cm) | 63.6±8.5 | 72.9±12.1a | 64.1±6.7 | 78.6±15.2a |
| WHtR | 0.44±0.05 | 0.50±0.08a | 0.44±0.04 | 0.53±0.09a |
| SBP (mmHg) | 103±7 | 105±8 | 105±8 | 111±9a |
| DBP (mmHg) | 64±6 | 65±7 | 64±5 | 65±7 |
| Insulin (mcIU/mL) | 8.9±3.5 | 22.3±7.6a | 8.3±3.4 | 21.4±9.4a |
| Glucose (mg/dL) | 84.4±8 | 90.8±7a | 86.7±9 | 92.1±7a |
| HOMA-IR | 1.87±0.7 | 5.4±1.9a | 1.78±0.8 | 4.9±2.2a |
| TG (mg/dL) | 78.7±39.5 | 102.4±49.2a | 67.2±32.8 | 100.1±34.8a |
| TyG index | 8.01±0.41 | 8.34±0.45a | 7.90±0.38 | 8.38±0.34a |
| HDL-C (mg/dL) | 51.7±9.2 | 46.4±8.4a | 52.5±8.7 | 49.9±8.8 |
| TG/HDL-C | 1.65±1.15 | 2.40±1.54a | 1.34±0.80 | 2.01±0.71a |
| Uric acid (mg/dL) | 3.6±0.8 | 4.3±0.9a | 3.9±1.0 | 4.6±1.5a |
BMI Z, BMI-for-age Z-score; overweight, BMI-for-age Z-score >+1; WC, waist circumference; SBP, systolic blood pressure; DBP, diastolic blood pressure; HOMA-IR, homeostasis model assessment-insulin resistance; TG, triglycerides; TyG index, triglycerides/glucose index; HDL-C, high-density lipoprotein cholesterol; TG/HDL-C, triglycerides-to-HDL-C ratio; WHtR, waist-to-height ratio.
Continuous data are expressed as mean±standard deviation and categorical variables are expressed as number (percentage).
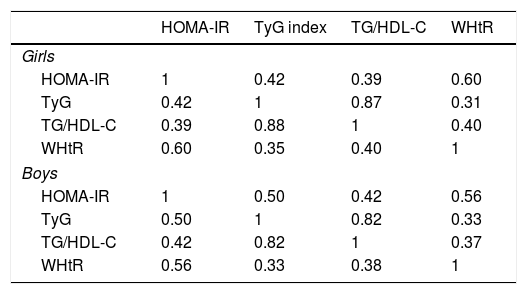
Partial correlation coefficients are summarized in Table 3. In girls, HOMA-IR was more strongly correlated with WHtR than with TyG index and TG/HDL-C (r=0.60 vs. r=0.42 and r=0.39, respectively). In boys, HOMA-IR was weakly correlated with TG/HDL-C and moderately correlated with both WHtR and TyG index (r=0.56 and r=0.50, respectively).
Correlation matrix among indicators of insulin resistance.
| HOMA-IR | TyG index | TG/HDL-C | WHtR | |
|---|---|---|---|---|
| Girls | ||||
| HOMA-IR | 1 | 0.42 | 0.39 | 0.60 |
| TyG | 0.42 | 1 | 0.87 | 0.31 |
| TG/HDL-C | 0.39 | 0.88 | 1 | 0.40 |
| WHtR | 0.60 | 0.35 | 0.40 | 1 |
| Boys | ||||
| HOMA-IR | 1 | 0.50 | 0.42 | 0.56 |
| TyG | 0.50 | 1 | 0.82 | 0.33 |
| TG/HDL-C | 0.42 | 0.82 | 1 | 0.37 |
| WHtR | 0.56 | 0.33 | 0.38 | 1 |
HOMA-IR, homeostatic model assessment for insulin resistance; TG/HDL-C, triglycerides-to-HDL-C ratio; TyG index, triglycerides/glucose index; WHtR, waist-to-height ratio.
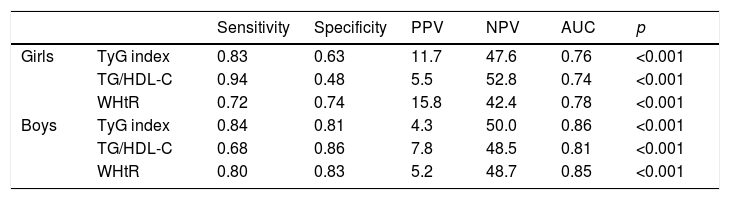
Sensitivity, specificity, positive predictive value (PPV), negative predictive value (NPV), and AUC are exhibited for both sexes in Table 4. In girls, the highest true positive rate (sensitivity) was obtained by TG/HDL-C. In turn, the true negative rate (specificity) of TG/HDL-C was the lowest among the indices. Differently in boys, WHtR and TyG index reached more balanced sensitivity and specificity compared to TG/HDL-C. For both boys and girls, the discriminatory power for IR was similar between the TyG index, TG/HDL-C ratio, and WHtR.
Performance of the diagnostic tests for insulin resistance.
| Sensitivity | Specificity | PPV | NPV | AUC | p | ||
|---|---|---|---|---|---|---|---|
| Girls | TyG index | 0.83 | 0.63 | 11.7 | 47.6 | 0.76 | <0.001 |
| TG/HDL-C | 0.94 | 0.48 | 5.5 | 52.8 | 0.74 | <0.001 | |
| WHtR | 0.72 | 0.74 | 15.8 | 42.4 | 0.78 | <0.001 | |
| Boys | TyG index | 0.84 | 0.81 | 4.3 | 50.0 | 0.86 | <0.001 |
| TG/HDL-C | 0.68 | 0.86 | 7.8 | 48.5 | 0.81 | <0.001 | |
| WHtR | 0.80 | 0.83 | 5.2 | 48.7 | 0.85 | <0.001 |
AUC, area under the ROC curve; CI, confidence interval; NPV, negative predictive value; PPV, positive predictive value; TG/HDL-C, triglycerides-to-HDL-C ratio; TyG index, triglycerides/glucose index; WHtR, waist-to-height ratio.
The main finding of this study was that the TyG index, TG/HDL-C, and WHtR provided similar discriminatory power for IR. In addition, the data show that overweight girls and boys have a greater probability of being insulin resistant and dyslipidemic than those with normal weight.
Studies have shown that IR is a risk factor for the development of T2D and cardiovascular disease in children and adolescents.1,3 In the present study, the frequency of overweight was greater in insulin resistant than in non-insulin resistant girls and boys. In addition, those with IR presented with higher values of BMI, WC, WHtR, TG, TG/HDL-C, TyG index, fasting insulin and glucose, serum uric acid, and HOMA-IR. Corroborating these findings, Kang et al.,20 studying 221 Korean adolescents, reported higher values of BMI, WC, TG, TG/HDL-C, TyG index, fasting insulin and glucose, and HOMA-IR, besides lower HDL-C levels, in those diagnosed with IR. Similarly, Iwani et al.21 reported higher values of TG, LDL-C, TG/HDL-C, BMI, and WC in overweight and obese insulin resistant children and adolescents.
In the last years, the WHO has recommended the use of anthropometric indicators to identify individuals with cardiometabolic risk. Looking in this direction, Behboudi-Gandevani et al., 2016 have recently shown that WHtR was a good predictor of insulin resistance and metabolic syndrome in women with polycystic ovary syndrome, which could advocate WHtR as a promising screening tool for this disease.22 Specifically in a pediatric population, Ibarra-Reynoso et al.23 studied the factors associated with whole body and hepatic IR as estimated by insulin-like growth factor binding protein-1 (IGFBP-1) in children aged 6–11 years. In that study, obesity was classified according to BMI, visceral adiposity, and WHtR. Interestingly, for those obese children, the predictors of HOMA-IR (whole body IR) were the same independently of the indicator used to provide obesity diagnosis. Moreover, a reduction of 2.15ng/mL in the values of IGFBP-1 was estimated for each 1cm of increase in WHtR, thus indicating that WHtR was a strong predictor of hepatic IR.
To the best of the authors’ knowledge, the present study was the first to compare the effectiveness of WHtR to provide screening for IR in a pediatric population. The results showed that all provided moderate correlation with HOMA-IR in both sexes (Table 3). Corroborating these findings, Guerrero-Romero et al.,7 studying the general population of Guadalajara, reported moderate correlation between the TyG index and HOMA-IR (r=0.39). In the study by Kang et al.,20 moderate correlation was also observed for both the TyG index and TG/HDL-C with HOMA-IR (r=0.41 and r=0.40, respectively). These results indicate that both the TyG index and TG/HDL-C are equally associated with HOMA-IR in pediatric populations of different ages. In the present study, WHtR had a stronger correlation with HOMA-IR than the other indicators, mainly among girls.
Regarding the analysis of the ROC curve, no indicator stood out from the others in the comparison of AUC, thus indicating similar discriminatory power for IR between WHtR and indices based on biochemical markers, even adjusting for age. Partially corroborating these findings, Kang et al.20 observed similar discriminatory power for IR when comparing the TyG index and TG/HDL-C. However, the present study was the first to show that the WHtR was similar to the TyG index and TG/HDL-C to discriminate IR in a pediatric population.
Consistent evidence has documented the role of abdominal fat deposits in the pathogenesis of metabolic disorders, including insulin resistance.24 In this sense, the biochemical predictors of IR, which are based on altered blood lipids, are probably collinear to abdominal adiposity. Corroborating this assumption, Silva et al.25 have shown that WHtR was more strongly correlated (r=0.78) with trunk fat as measured by DEXA than other anthropometric indicators, including waist circumference and waist-to-hip ratio. Moreover, Mazidi et al.26 recently approached the complex link between glucose/insulin homeostasis and serum uric acid. Using a regression analysis with a structural equation model, the authors found that adiposity factors such as visceral adipose tissue, BMI, and WC are mediators of the association between insulin resistance and serum uric acid. In the present study, the girls and boys in the highest quartile for WHtR presented with higher HOMA-IR compared to those in the lowest quartiles, as occurred with the TyG index and TGC/HDL-C as well (Supplementary Table 1). Indeed, this indirect evidence supports WHtR as a proxy of regional body fat, at least in the studied population. This information is very relevant to the public health system because WHtR is easy to determine in a clinical setting. Besides, unlike the biochemical markers, WHtR can be used in absence of invasive fasting laboratory exams, gives instant results, is free of costs, and is relatively easy to use.
This study has some limitations. First, all volunteers belong to nine public schools of the municipality of Vitória, so these results cannot be extrapolated to the general population of children and adolescents living in Brazil. Second, HOMA-IR is a validated method widely used in clinical practice for the diagnosis of IR; however, it would be helpful if we could evaluate the discriminatory power of the indicators, using hyperinsulinemic-euglycemic clamp as a reference (gold standard test). An appropriate sample size, which allowed for high statistical power, and the fact that anthropometric measures were obtained by a single investigator, were the main strengths of this study.
In conclusion, WHtR reached similar discriminatory power to biochemical markers for IR in children and adolescents. Thus, taking into account its cost–benefit ratio, it is plausible to suggest that WHtR may be a useful tool to provide screening for IR in pediatric populations.
FundingPro-Rectory of Research and Postgraduation of the Federal University of Espírito Santo (Institutional Program Fund for Research Support – 2015); FAPES/PPSUS (grant number 65854420/2014); Fundação VALE; Laboratory Thommasi of Vitória, which funded the accomplishment of part of the biochemical exams. The funders had no role in study design, data collection and analysis, decision to publish, or preparation of the manuscript.
Conflicts of interestThe authors declare no conflicts of interest.
The authors would like to thank the Andréa Roseli Vançan Russo Horimoto and Marcelo Perim Baldo for their support in the statistical analyses.
The following are the supplementary data to this article:
Please cite this article as: Alvim RO, Zaniqueli D, Neves FS, Pani VO, Martins CR, Peçanha MA, et al. Waist-to-height ratio is as reliable as biochemical markers to discriminate pediatric insulin resistance. J Pediatr (Rio J). 2019;95:428–34.


