To verify the thermoregulatory and perceptual responses of obese and lean girls, either fit or unfit, exercising in the heat at a similar rate of metabolic heat production per unit body mass.
MethodsA total of 34 pubescent girls were allocated in four groups: 12 obese fit, 9 obese unfit, 5 lean fit, and 8 lean unfit. The obese groups (13.2±1.4 years, 40.5%±5.8% fat by DXA) differed in their aerobic fitness (V˙O2peak 76.0±8.1 vs. 56.6±5.8mL.kgmusclemass−1.min−1), as well as the lean groups (13.1±1.6 years, 24.0%±4.8% fat) (V˙O2peak 74.5±2.9 vs. 56.2±5.0mL.kgmuscle mass−1min−1). Girls cycled two bouts of 25min with a 10min rest in between, at ∼5.4W.kg−1 in the heat (36°C and 40% relative humidity) and they were kept euhydrated. Rectal and skin temperatures and heart rate were measured every 5min. Perceptual responses were evaluated throughout the exercise.
ResultsInitial rectal temperature was higher in the obese subjects compared to the lean subjects (37.5±0.3 and 37.2±0.3°C). No difference was observed among the girls whom were obese (eight fit or unfit) and lean (also fit or unfit) throughout the exercise in rectal temperature (37.6±0.2, 37.5±0.3, 37.5±0.3, 37.4±0.3°C, respectively), skin temperature (34.8±0.8, 35.1±1.0, 34.4±0.9, 35.2±0.9°C), and heart rate (128±18; 118±12, 130±16, 119±16beatsmin−1). No differences were observed in perceptual responses among groups.
ConclusionRegardless of the adiposity or aerobic fitness, pubescent girls had similar thermoregulatory and perceptual responses while cycling in the heat at similar metabolic heat production.
Verificar as respostas termorregulatórias e perceptivas de meninas obesas e magras, com alta e baixa aptidão aeróbica, exercitando-se no calor com produção metabólica de calor similar por massa corporal.
MétodosUm total de 34 meninas púberes foram alocadas em quatro grupos: 12 obesas com alta aptidão aeróbica, 9 obesas com baixa aptidão aeróbica, 5 magras com alta aptidão aeróbica e 8 magras com baixa aptidão aeróbica. Os grupos obesos (13,2±1,4 anos, 40,5%±5,8% de gordura por DXA) diferiram em sua aptidão aeróbica (V˙O2peak 76,0±8,1 vs. 56,6±5,8 mL.kg de massa muscular-1.min-1), bem como os grupos magros (13,1±1,6 anos, 24,0%±4,8% de gordura) (V˙O2peak 74,5±2,9 vs. 56,2±5,0 mL.kg de massa muscular-1min-1). As meninas pedalaram duas sessões de 25 minutos com descanso de 10 minutos entre as sessões, a ∼5,4 W.kg-1 no calor (36°C e 40% de umidade relativa) e foram mantidas hidratadas. As temperaturas retal e cutânea e a frequência cardíaca foram medidas a cada 5 minutos. As respostas perceptivas foram avaliadas durante o exercício.
ResultadosA temperatura retal inicial foi maior nas meninas obesas em comparação com as magras (37,5±0,3 e 37,2±0,3°C). Não houve diferença entre as meninas obesas (com alta aptidão aeróbica ou não) e magras (também com alta aptidão aeróbica ou não) durante todo o exercício em relação à temperatura retal (37,6±0,2; 37,5±0,3; 37,5±0,3; 37,4±0,3°C; respectivamente), temperatura da pele (34,8±0,8; 35,1±1,0; 34,4±0,9; 35,2±0,9°C), e frequência cardíaca (128±18; 118±12, 130±16, 119±16 batimentos.min-1). Não foram observadas diferenças nas respostas perceptivas entre os grupos.
ConclusãoIndependentemente da adiposidade ou do condicionamento aeróbico, as meninas púberes tiveram respostas termorregulatórias e perceptivas semelhantes, enquanto pedalavam no calor com uma produção metabólica de calor similar.
Few studies have shown thermoregulatory1 and perceptual2 disadvantages of obese compared to lean children during exercise in the heat, although obesity has been pointed as a risk factor for exertional heat illnesses.3 Physical inactivity and poor aerobic fitness – generally associated with obesity – may also impair thermoregulatory responses, representing an aggravating condition when prescribing exercise in warm conditions.4
Depending on girls’ aerobic fitness, there may be thermoregulatory and perceptual differences within those who are lean and obese.5 Aerobic exercise is often recommended for weight management, but adherence may be impaired if girls experience discomfort. In addition to health and safety considerations, the recommended exercise should be enjoyable.6 Currently, no evidence exists about the impact of fitness associated with adiposity on physiological and perceptual responses during moderate prolonged exercise in the heat.
Furthermore, no confirmation exists that obese teens respond with greater increase in core temperature compared to their lean peers during exercise in the heat.5 Conflictingly, Leites et al.6 showed that girls who are obese had a smaller increase in rectal temperature (Tre) during exercise in hot conditions compared to the lean ones; however, in boys2 the responses were similar.
Core temperature can be different between males and females, which could be due to hormones, as estrogen plays a role in thermoregulation and sweating responses.7 Another explanation for conflicting results may be related to the traditional method of setting the exercise intensity protocol load by a certain % of the individual's peak oxygen consumption (V˙O2peak). As suggested,8,9 such an approach may induce greater metabolic heat production (H˙p) in the lean compared to the obese girls, explaining their greater Tre increase.
Previous studies compared heterogeneous body mass groups using a given % V˙O2peak2,6 or an absolute walking speed,10 which could result in different H˙p per body unit. A study11 that compared two groups of adults matched by body mass and body surface area (BSA), with distinct V˙O2peak (∼60 vs. 40.3mL.kg−1.min−1) and % body fat (∼12% vs. 22%), showed that exercise at a given absolute H˙p, but not necessarily at a similar % V˙O2peak, resulted in a similar core temperature increase. Setting the exercise intensity by H˙p per body unit12,13 has been considered a better method to compare groups of heterogeneous body size.8,14 In youths, there are no studies that have aimed to examine thermoregulatory responses to exercise that considered both aerobic fitness and adiposity.
Perceptual responses may also interfere with exercise tolerance and program adherence under heat conditions. Among active prepubescent girls, thermal comfort was similar between the lean and obese groups; however, the lean girls reported greater irritability during 30min of cycling in the heat.6 Obese pubertal boys who were active reported a higher heat sensation compared to their active lean peers while cycling for 30min at similar % V˙O2peak in the heat.3 Boys whom are obese (9–12 years old) showed greater perceived effort (2–3 points on Borg scale) compared to the lean boys at similar absolute exercise intensity in the heat.13 None of the above mentioned studies had considered aerobic fitness differences between groups.
Despite the consensus that increasing physical activity is a key aspect in the management of pediatric obesity, exercise appears to be a concern for unfit girls when performed in a warm climate. Such external conditions may serve as another excuse to limit even mild-to-moderate physical activities in sedentary obese girls. Clarification about the effect of obesity and fitness in youth during exercise in the heat will help clinicians and health professionals to recommend safe and enjoyable exercise to optimize body composition, aerobic fitness, and metabolic health. The purpose of this study was to verify thermoregulatory and perceptive responses of obese and lean girls, both fit and unfit, during exercise in the heat at a given H˙p.
MethodsSubjectsThirty-four girls were studied, divided into four groups according to adiposity (obese and lean) and aerobic fitness (fit and unfit), resulting in 21 obese (12 fit and nine unfit) and 13 lean (5 fit and 8 unfit). Body fat was obtained by dual energy X-Ray absorptiometry (DXA) to classify the girls as lean or obese (<32 or ≥32% body fat),14 and V˙O2peak was evaluated to classify them as fit or unfit (≥69 or <64mL.kgtotalmusclemass−1.min−1). For fitness, a V˙O2peak cut-off point was set from the Gaussian curve of the girls V˙O2peak measurements. A Standard Deviation (SD) of ±0.25 was adopted, ensuring a mean of 20mL.kgtotalmusclemass−1.min−1 difference between groups.
Girls and their parents/guardians were informed about procedures and provided written informed assent and consent to participate in the study, which was approved by the University Research Ethics Board.
Girls came to the laboratory for a preliminary and an experimental session, two to seven days apart, between March and May, which are predominantly warm months in Southern Brazil.
Preliminary sessionHealth condition was assessed by a questionnaire, which showed that the girls were healthy and not taking medications. Body mass and height were measured, and Body Mass Index (BMI) and BSA15 were calculated. Biological maturation was determined using self-assessed Tanner staging.16 Body composition was measured by using DXA (Lunar GE Pencil Bin, SmartScan pediatric program; GE Medical Systems Lunar – Diegem, Belgium).
To determine V˙O2peak, an incremental exercise test was performed in a thermoneutral room (∼24°C) on a cycle ergometer (Ergo Fit, model 167 – Toledo, Spain) using the McMaster All-Out Progressive Continuous Cycling protocol.5 Expired O2 and CO2 were continuously monitored using a calibrated metabolic cart (O2 and CO2 analyzer; Inbramed, model VO2000 – Porto Alegre, Brazil). The test was terminated if one of these four criteria was achieved: (1) Inability to maintain a cycling cadence >60rpm, despite strong verbal encouragement; (2) Heart Rate (HR) >95% of HRmax17; (3) RPE >19; or (4) Respiratory Exchange Ratio (RER) >1.0. V˙O2peak was considered as the highest V˙O2 value. V˙O2peak was corrected by total muscle mass to avoid a confounding effect of fat mass and total body mass.18
At the end of this session, girls were instructed to refrain from any strenuous exercise and not to change their eating habits 24h prior to the experimental trial, which happened 2–3h after a major meal.
Experimental trialUpon arrival to the laboratory, hydration status was verified from a sample of urine by examining the color.19 This was followed by body mass measurement and baseline Tre, skin temperatures (Tsk), and HR. Tre was measured using a flexible thermometer (Physitemp Instruments, Inc. Ret-1 model – Clifton, NJ, United States) inserted 10–12cm beyond the anal sphincter. Tsk at four sites were measured using skin thermometers (Physitemp Instruments, Inc., SST-1 model – Clifton, NJ, United States), placed on the arm (Ta), chest (Tc), upper back (Tb), and thigh (Tt). Mean Tsk was calculated according to the equation: 0.3*Tc+0.3*Tb+0.2*Ta+0.2*Tt.
The girls received standardized instructions on how to answer four perceptual scales: (1) RPE,20 (2) Thermal sensation (9 point scale from “very cold” to “very hot”),21 (3) Thermal comfort (6 point scale from “very comfortable” to “very uncomfortable”)21 and (4) Irritability (6 point scale from “nothing” to “very intense”).
Prior to exercise, the girls rested in a seated position for five min in the climatic chamber (Russel Technical Products – Netherlands, 13m2) set at 36°C and 40% relative humidity, resulting in a humidex factor of 44°C. The girls exercised wearing a top, athletic shorts, and shoes.
The exercise cycling protocol consisted of two 25min bouts at a fixed H˙p per unit body mass (∼5.4W.kg−1) with a 10min rest between bouts of cycling. V˙O2 and V˙CO2 were measured during the bouts for at least 10min. Tre, Tsk, HR, and perceptual scores were recorded every 5min during exercise. Total body temperature (Tbody) was calculated as the following equation22,23: Tbody=0.8*Tre+0.2*Tsk
To keep euhydrated, each girl ingested a water volume at rest (between bouts) equivalent to her individual loss that was calculated from the body mass difference relative to her initial value. After the whole session, the girls dried their skin and body mass was evaluated with bare feet to calculate the sweat volume: Δbody mass+volume of water intake.
Metabolic heat productionThe rate of metabolic energy expenditure (M; W.m−2) was estimated using the average V˙O2 (L.min−1) and RER measured during exercise, calculated as24:
M=V˙O2.RER−0.70.3ec+1.0−RER0.3ef60⋅BSA⋅1000; where ec is the caloric equivalent per liter of O2 for carbohydrate oxidation (21.13kJ), and ef for fat oxidation (19.62kJ). H˙p (W.m−2) was calculated as the difference between M and the external work rate (W).
Statistical analyses
The Shapiro–Wilk test was applied to verify data normality and Levene's test was used to determine the homogeneity of variance. Student t-test was used to compare groups (obese vs. lean) and characteristics (i.e., weight, height, BSA, % body fat, fat mass, total muscle mass, aerobic fitness, and HRmax). To analyze exercise intensity, urine color, sweat volume, and water balance by aerobic fitness and adiposity, one-way ANOVAs were conducted. Bonferroni post hoc analyses were used to examine significant interactions. The Generalized Estimating Equation (GEE) was used to compare groups (obese fit, obese unfit, lean fit, and lean unfit) over time (Tre, Tsk, HR, RPE, irritability, thermal sensation, and comfort). Pearson's correlation coefficient was used for the body fat and Tre. Data are expressed as mean±SD. Statistical significance was set at p≤0.05, and analysis were performed using SPSS v.18.0 (SPSS Inc – Chicago, IL, United States).
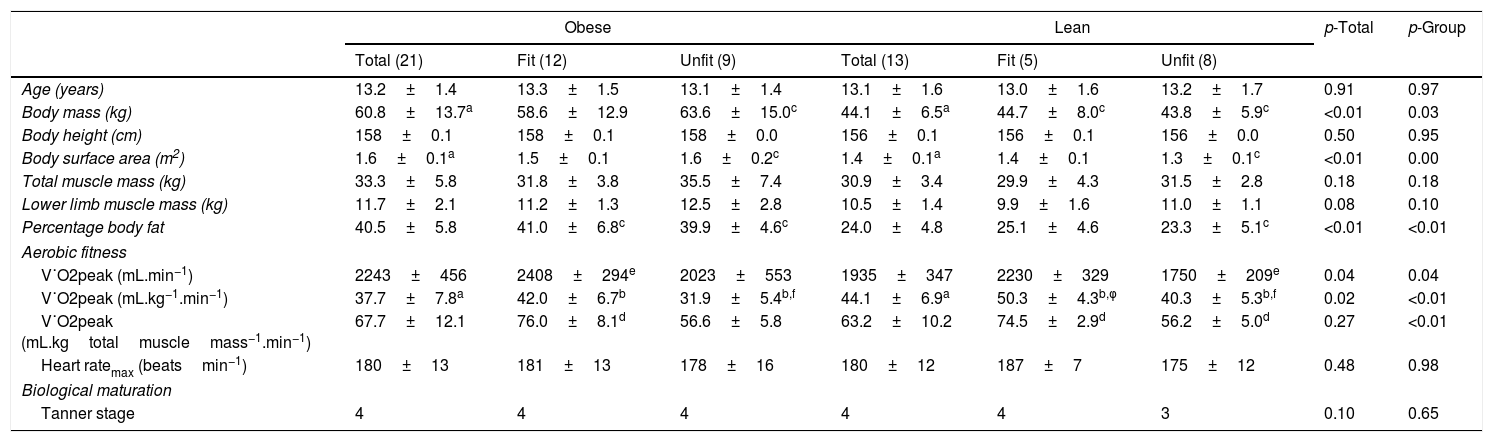
ResultsTable 1 shows the physical characteristics by group. Obese groups were heavier, with greater BSA, BMI, body fat, muscle mass, and V˙O2peak; however, they presented lower V˙O2peak by body mass. V˙O2peak by total muscle mass was lower in the unfit compared to the fit girls (p<0.001).
Physical and physiological characteristics of obese and lean girls.
| Obese | Lean | p-Total | p-Group | |||||
|---|---|---|---|---|---|---|---|---|
| Total (21) | Fit (12) | Unfit (9) | Total (13) | Fit (5) | Unfit (8) | |||
| Age (years) | 13.2±1.4 | 13.3±1.5 | 13.1±1.4 | 13.1±1.6 | 13.0±1.6 | 13.2±1.7 | 0.91 | 0.97 |
| Body mass (kg) | 60.8±13.7a | 58.6±12.9 | 63.6±15.0c | 44.1±6.5a | 44.7±8.0c | 43.8±5.9c | <0.01 | 0.03 |
| Body height (cm) | 158±0.1 | 158±0.1 | 158±0.0 | 156±0.1 | 156±0.1 | 156±0.0 | 0.50 | 0.95 |
| Body surface area (m2) | 1.6±0.1a | 1.5±0.1 | 1.6±0.2c | 1.4±0.1a | 1.4±0.1 | 1.3±0.1c | <0.01 | 0.00 |
| Total muscle mass (kg) | 33.3±5.8 | 31.8±3.8 | 35.5±7.4 | 30.9±3.4 | 29.9±4.3 | 31.5±2.8 | 0.18 | 0.18 |
| Lower limb muscle mass (kg) | 11.7±2.1 | 11.2±1.3 | 12.5±2.8 | 10.5±1.4 | 9.9±1.6 | 11.0±1.1 | 0.08 | 0.10 |
| Percentage body fat | 40.5±5.8 | 41.0±6.8c | 39.9±4.6c | 24.0±4.8 | 25.1±4.6 | 23.3±5.1c | <0.01 | <0.01 |
| Aerobic fitness | ||||||||
| V˙O2peak (mL.min−1) | 2243±456 | 2408±294e | 2023±553 | 1935±347 | 2230±329 | 1750±209e | 0.04 | 0.04 |
| V˙O2peak (mL.kg−1.min−1) | 37.7±7.8a | 42.0±6.7b | 31.9±5.4b,f | 44.1±6.9a | 50.3±4.3b,φ | 40.3±5.3b,f | 0.02 | <0.01 |
| V˙O2peak (mL.kgtotalmusclemass−1.min−1) | 67.7±12.1 | 76.0±8.1d | 56.6±5.8 | 63.2±10.2 | 74.5±2.9d | 56.2±5.0d | 0.27 | <0.01 |
| Heart ratemax (beatsmin−1) | 180±13 | 181±13 | 178±16 | 180±12 | 187±7 | 175±12 | 0.48 | 0.98 |
| Biological maturation | ||||||||
| Tanner stage | 4 | 4 | 4 | 4 | 4 | 3 | 0.10 | 0.65 |
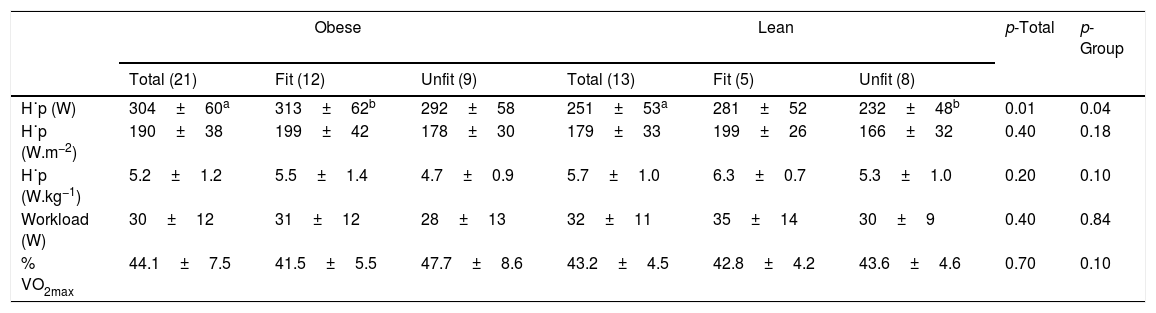
During exercise, obese fit girls had a higher absolute H˙p compared to lean unfit girls (313±62 vs. 232±48W; p=0.02). H˙p per unit body mass (W.kg−1) was similar among obese and lean subjects, both fit and unfit. Obese and lean girls cycled at similar H˙p (5.4W.kg−1, p=0.10) and mean workload during exercise was 30 and 32W, respectively (Table 2).
Average metabolic heat production (H˙p) and workload values during exercise in the heat in obese and lean girls.
| Obese | Lean | p-Total | p-Group | |||||
|---|---|---|---|---|---|---|---|---|
| Total (21) | Fit (12) | Unfit (9) | Total (13) | Fit (5) | Unfit (8) | |||
| H˙p (W) | 304±60a | 313±62b | 292±58 | 251±53a | 281±52 | 232±48b | 0.01 | 0.04 |
| H˙p (W.m−2) | 190±38 | 199±42 | 178±30 | 179±33 | 199±26 | 166±32 | 0.40 | 0.18 |
| H˙p (W.kg−1) | 5.2±1.2 | 5.5±1.4 | 4.7±0.9 | 5.7±1.0 | 6.3±0.7 | 5.3±1.0 | 0.20 | 0.10 |
| Workload (W) | 30±12 | 31±12 | 28±13 | 32±11 | 35±14 | 30±9 | 0.40 | 0.84 |
| % VO2max | 44.1±7.5 | 41.5±5.5 | 47.7±8.6 | 43.2±4.5 | 42.8±4.2 | 43.6±4.6 | 0.70 | 0.10 |
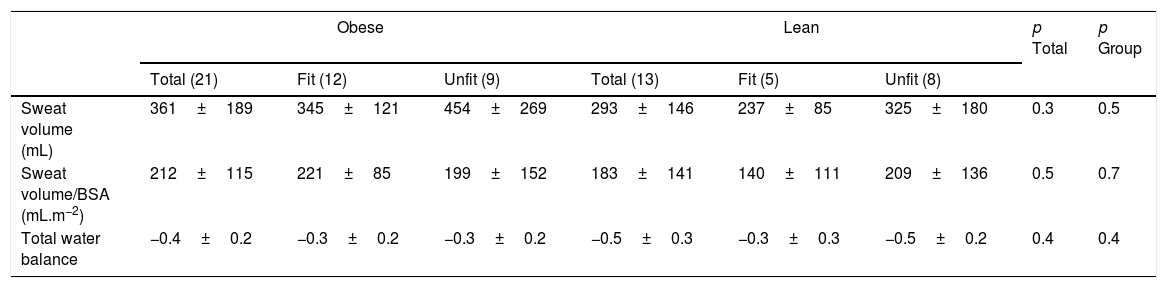
Participants arrived with similar hydration levels according to urine color (obese fit, obese unfit, lean fit, and lean unfit: 4±2, 4±2, 4±1, and 4±1, respectively). Table 3 shows the sweating response and body hydration status of the groups. Total sweat volume was similar among groups (p=0.30), even when corrected by BSA (p=0.5). Body water balance at the end of the experiment was similar among groups, resulting in a low deficit of 0.4±0.2 and 0.5±0.3L, in the obese and lean groups, respectively.
Sweating responses and total water balance during exercise in the heat in obese and lean girls.
| Obese | Lean | p Total | p Group | |||||
|---|---|---|---|---|---|---|---|---|
| Total (21) | Fit (12) | Unfit (9) | Total (13) | Fit (5) | Unfit (8) | |||
| Sweat volume (mL) | 361±189 | 345±121 | 454±269 | 293±146 | 237±85 | 325±180 | 0.3 | 0.5 |
| Sweat volume/BSA (mL.m−2) | 212±115 | 221±85 | 199±152 | 183±141 | 140±111 | 209±136 | 0.5 | 0.7 |
| Total water balance | −0.4±0.2 | −0.3±0.2 | −0.3±0.2 | −0.5±0.3 | −0.3±0.3 | −0.5±0.2 | 0.4 | 0.4 |
BSA, body surface area.
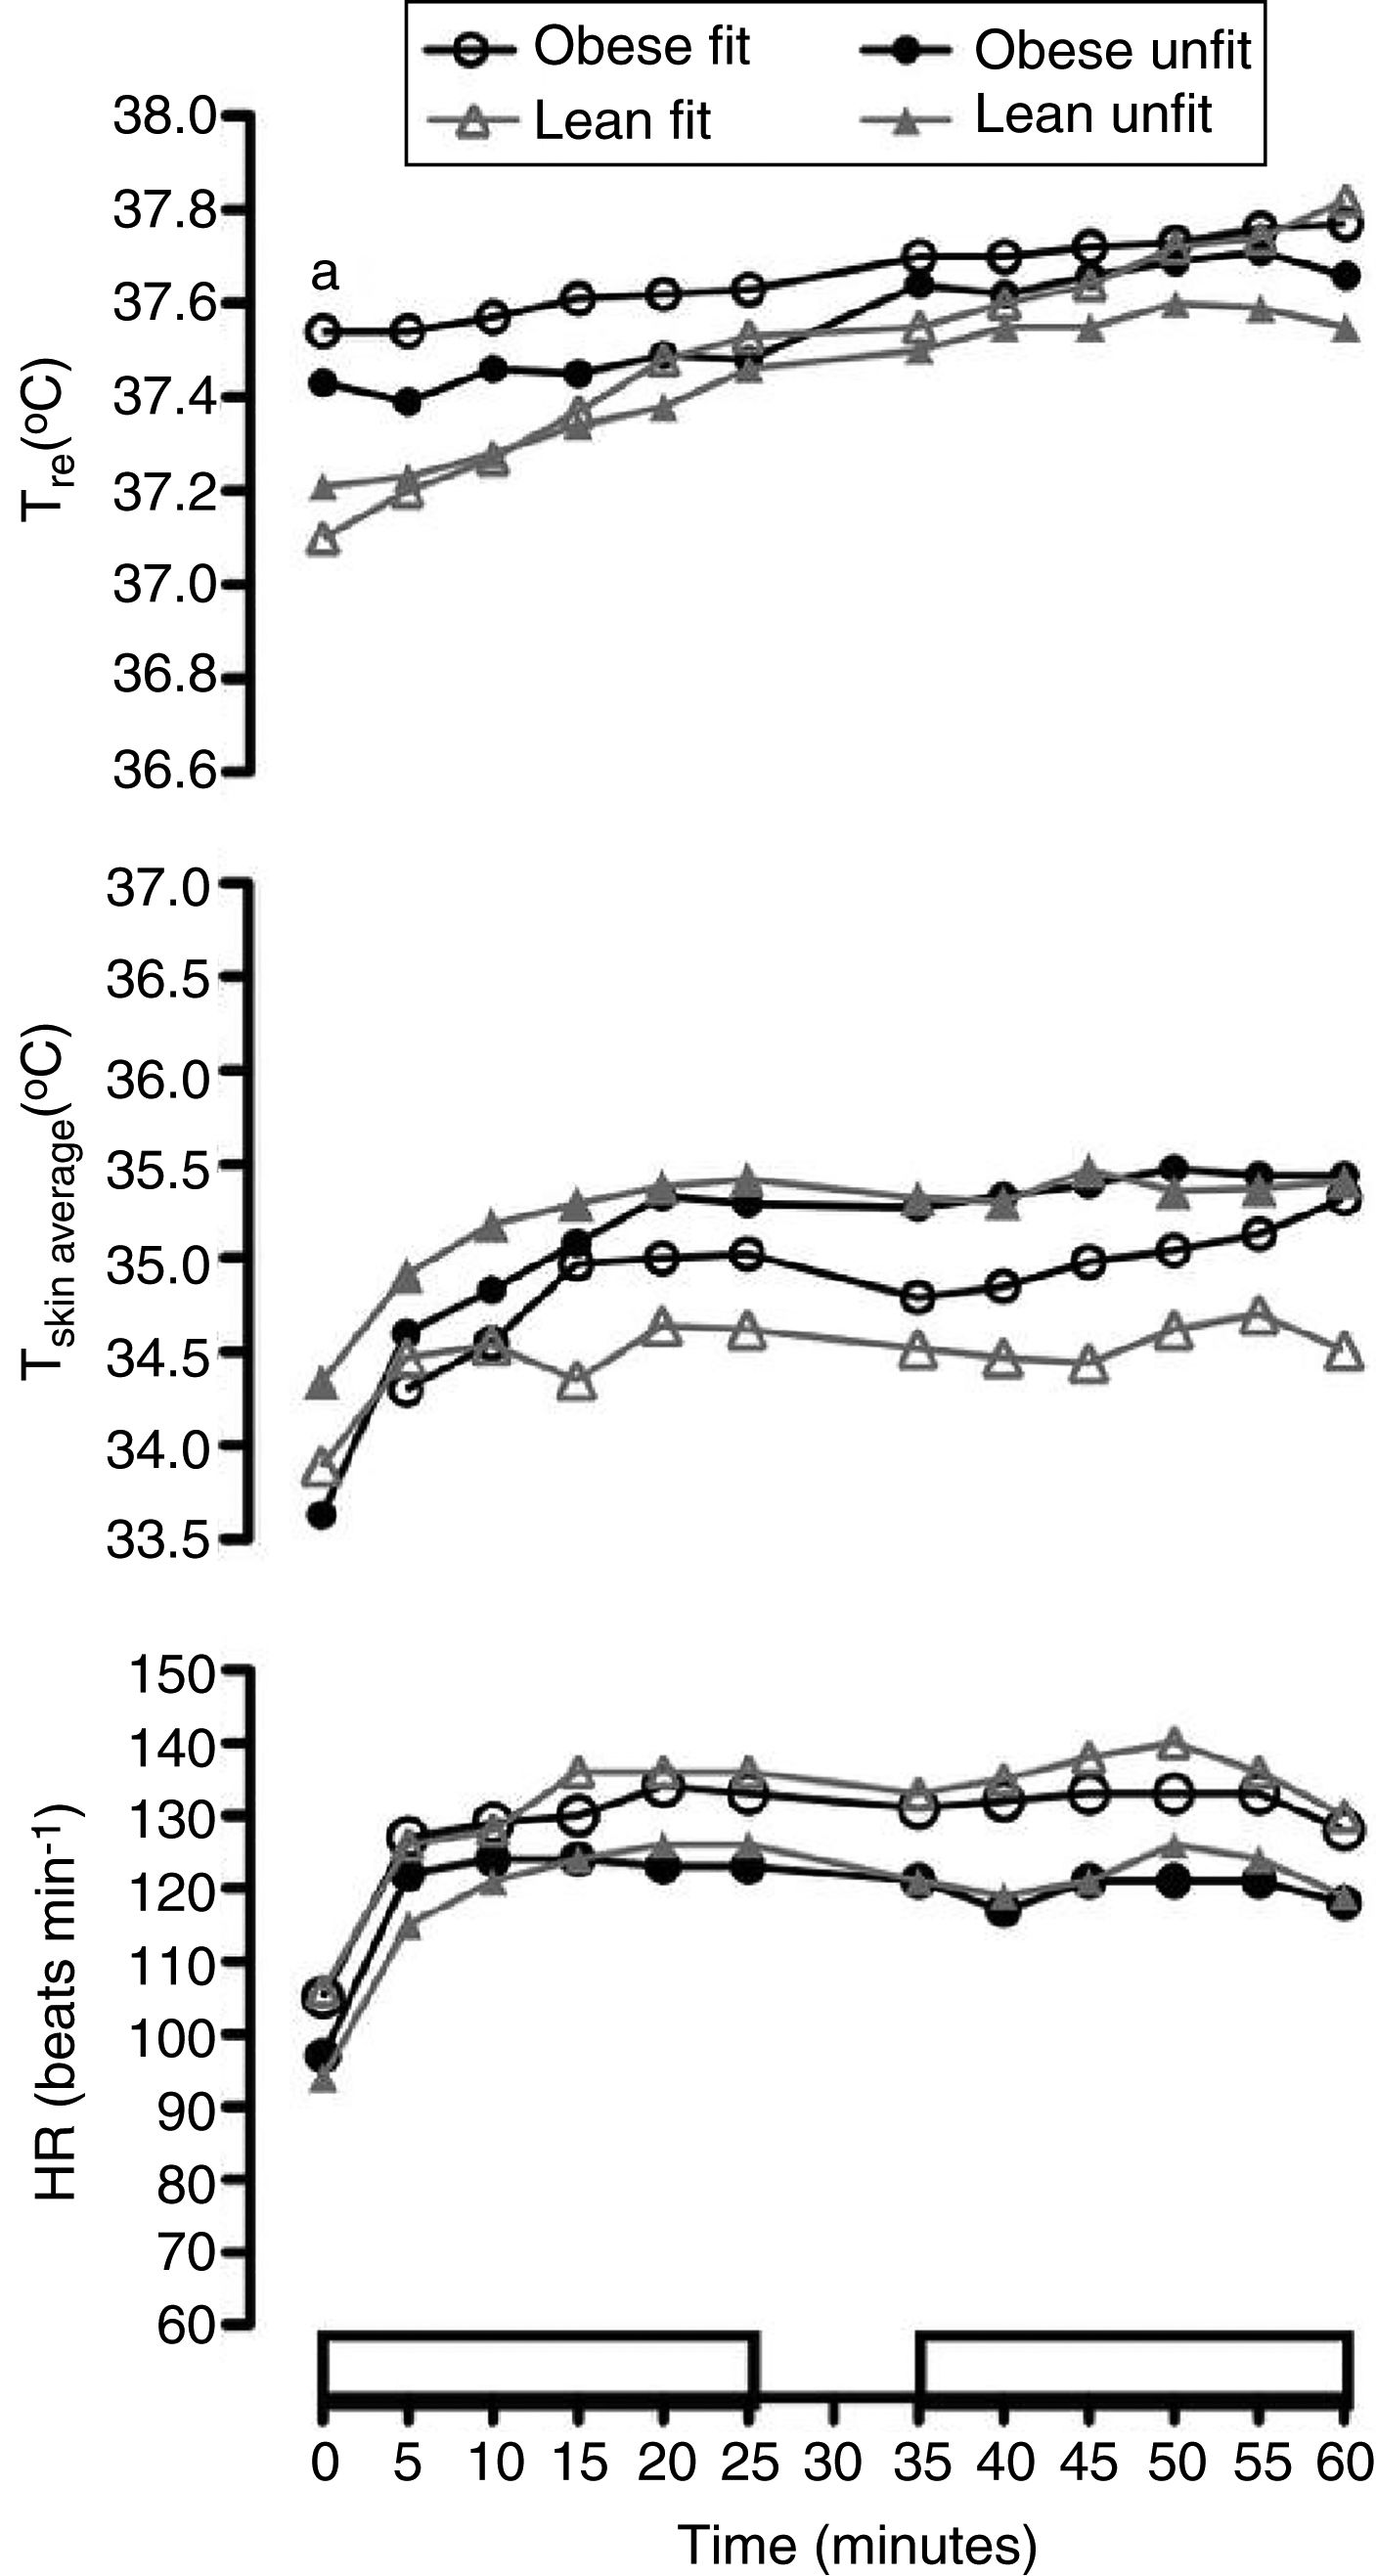
Fig. 1 depicts Tre, Tsk, Tbody, and HR over the two 25min bouts of exercise. Tre response was similar between lean and obese for both the fit and unfit groups during exercise. No difference was observed among the four groups throughout the exercise in regional Tsk for the back, chest, arm, and thigh: 34.8±0.8 obese fit; 35.1±1.0 obese unfit; 34.4±0.9 lean fit; and 35.2±0.9°C lean unfit, and Tbody: 37.0±0.2 obese fit, 37.0±0.4 obese unfit, 36.8±0.3 lean fit, and 36.9±0.3°C lean unfit. HR was similar between obese and lean girls at the beginning of exercise (101±14 and 99±12beatsmin−1) and it increased similarly among the four groups (obese fit, obese unfit, lean fit, and lean unfit) (128±18; 118±12, 130±16, and 119±16beatsmin−1, respectively).
.")
Body fat did not correlate with Tre (r=0.32). There was no relationship between adiposity and time for Tre (p=0.31), Tsk (p=0.54), Tbody (p=0.97), HR (p=0.98), throughout the exercise session. There were also no differences among groups for these variables over time according to the aerobic fitness: Tre (p=0.99), Tsk (p=0.99), Tbody (p=0.96) and HR (p=0.92).
The four groups (obese fit, obese unfit, lean fit, and lean unfit) presented similar perceptual responses during exercise for RPE (11±2, 12±2, 11±2, and 11±2, respectively) (p=0.98) (11 signifying “slight effort”), irritability (3±0.5, 2±0.3, 3±0.8, and 2±0.3) (p=0.96) (3 signifying “moderate” and 2 “low” irritability), thermal sensation (7±0.4, 7±0.5, 7±0.7, and 6±0.7) (p=0.98) (7 signifying “warm” and 6 “slightly warm”), and thermal comfort (3±0.4, 3±0.5, 3±0.7, and 3±0.5) (p=0.99) (3 signifying “just uncomfortable”).
DiscussionThe main finding of this study is that thermoregulatory and perceptual responses were similar independent of the group during the 25min cycling bouts at similar H˙p per unit body mass in the heat. This suggests that under such exercise/heat conditions, obese and unfit girls did not differ regarding body temperatures and sweating responses compared to their lean and fit peers. Their perceived exertional, thermal sensation, and comfort responses throughout exercise were also similar among groups.
Although fit obese girls started exercise at a higher Tre than fit lean girls, responses were similar among groups during exercise. Compared to the lean, obese children may present greater absolute resting metabolic rate and metabolic heat production due to differences in body composition.6,25 In addition, since fat mass has a specific heat that is approximately half of that of fat-free mass, it may result in greater heat storage in the obese. All girls were naturally heat acclimatized, and previous hydration and resting conditions were controlled to eliminate these factors as responsible for baseline value differences.
A few studies have verified thermoregulatory responses in obese children6,10 and adolescents1,2,13 during exercise in the heat; however, only two included females.6,26
There are inconsistent results about the influence of body fat on thermoregulation during exercise in the heat. Lean girls had a greater Tre increase toward the end of a 30min exercise session, and the authors6 suggested that it could be due to the greater muscle mass compared to that of the obese group. In the present study, the mean absolute fat free mass was similar between groups (33.3 vs. 30.9kg), although the % fat was almost twice that of the lean girls (40.5 vs. 24.0). Such similar absolute muscle mass of the obese and lean girls could explain their similar Tre responses. The present study's cycling protocol properly achieved the goal of having the girls exercising at similar H˙p. Leites et al.6 showed that lean girls completed the exercise-in-the heat protocol with a mean Tre 0.2°C higher than the obese ones. It is possible that this difference occurred due to differences in exercise intensity (%V˙O2 vs. H˙p). Recently, H˙p by body mass method has been suggested12 to achieve similar heat storage when comparing thermoregulatory responses. Previous studies11 may have been biased by setting an exercise intensity protocol as a % V˙O2peak and absolute workload to compare groups that vary in their physical fitness.
The present authors are unaware of any other study in adolescents that compared girls with distinct adiposity and aerobic fitness levels under an exercise protocol that is based on similar H˙p and heat stress. The current study suggests the use of H˙p by unit of body mass as an exercise protocol when comparing thermoregulatory responses between lean and obese girls, regardless of their aerobic fitness. Previous studies that compared groups (adults) with high and low adiposity,9 lean and obese,27 or with high and low aerobic fitness,28 found no Tsk difference between groups. Therefore, it appears that adiposity and aerobic fitness do not influence Tsk responses when a mild-to-moderate exercise intensity protocol is set by a given H˙p per unit body mass.
The sweat volume showed great individual variability among the girls, as previously described,29 resulting in similar mean values among the lean/obese and fit/unit groups, even when corrected by BSA. This agrees with what was found in prepubertal girls6 and in pubertal boys.2
Regardless of the adiposity levels, adolescents appear to produce similar volumes of sweat by BSA when exercising in the heat.
Few studies gave evaluated perceptual responses of obese children and adolescents during exercise in heat.2,6 In the present study, all groups perceived the exercise as mild. They reported a low-to-moderate irritability, despite feeling a warm and uncomfortable ambient temperature. Differently, Leites et al.6 found that lean girls presented greater irritability during the exercise. Previous studies showed differences in RPE between lean and obese boys exercising in the heat.15,30 Obese boys also felt worse thermal comfort (8 vs. 5) compared to lean boys during exercise in the heat.2 It is possible that perceived responses are related to exercise intensity as well as gender. It is important to emphasize that exercise intensity was set to be low-to-moderate so that girls who are obese and sedentary could complete the exercise in the heat.
Regardless of the adiposity or aerobic fitness level, pubescent girls had similar thermoregulatory (Tre, Tsk), sweating (sweat volume and water balance), and perceptual responses (RPE, irritability, thermal sensation, and comfort) while cycling under heat stress during 50min at a 5.4W.kg−1.
Conflicts of interestThe authors declare no conflicts of interest.
Please cite this article as: Rodrigues CÁ, Leites GT, Meyer F. Thermoregulatory and perceptual responses of lean and obese fit and unfit girls exercising in the heat. J Pediatr (Rio J). 2020;96:464–71.


