To investigate the relationship between serum thyrotropin (TSH), insulin resistance (IR), and cardiovascular risk factors (CRF) in a sample of overweight and obese Brazilian adolescents.
MethodsA retrospective, longitudinal analysis of 199 overweight and obese pubescent adolescents was performed. The TSH and free T4 (fT4) levels, anthropometric measurements, and laboratory test results of these patients were analyzed.
Results27 individuals (13.56%) presented with TSH levels above the normal level (subclinical hypothyroidism [SCH]). Their waist circumference (WC) was significantly higher than those of euthyroid individuals. Serum TSH was positively correlated with the homeostasis model assessment of insulin resistance (HOMA-IR) index, triglycerides (TG) and high-density lipoprotein cholesterol (HDL-C). Using TSH and BMI as independent variables, TSH levels were shown to be independently related to HOMA-IR (p=0.001) and TG (p=0.007). Among euthyroid subjects, individuals with TSH values <2.5mIU/mL exhibited statistically significant decreases in waist-to-hip ratio, HDL-C levels, and HOMA-IR scores and a tendency toward lower WC values.
ConclusionSCH in overweight and obese adolescents appears to be associated with excess weight, especially visceral weight. In euthyroid adolescents, there appears to be a direct relationship between TSH and some CRF. In conclusion, in the present sample of overweight and obese adolescents, TSH levels appear to be associated with IR and CRF.
Investigar a relação entre tireotrofina sérica (TSH), resistência à insulina (RI) e fatores de risco cardiovascular (FRC) em uma amostra de adolescentes brasileiros acima do peso e obesos.
MétodosFoi realizada uma análise longitudinal retrospectiva de 190 adolescentes púberes acima do peso e obesos. Foram analisados os níveis de TSH e T4 livre (T4l), as medidas antropométricas e os resultados de exames laboratoriais desses pacientes.
Resultados27 indivíduos (13,56%) apresentaram níveis de TSH acima do normal (hipotireoidismo subclínico (HSC)). Eles apresentaram circunferência da cintura (CC) significativamente maior que os indivíduos eutireoideos. A TSH sérica foi positivamente correlacionada ao índice do modelo de avaliação da homeostase de resistência à insulina (HOMA-IR), triglicerídeos (TG) e lipoproteína de alta densidade-colesterol (HDL-C). Usando TSH e IMC como variáveis independentes, os níveis de TSH estavam relacionados ao HOMA-IR (p=0.001) e a TG (p=0.007) de forma independente. Entre os pacientes eutireoideos, indivíduos com valores de TSH<2.5mIU/mL apresentaram reduções estatisticamente significativas na razão cintura/quadril, nos níveis de HDL-C e nos escores de HOMA-IR e tendência a menores valores de CC.
ConclusãoO HSC em adolescentes acima do peso e obesos parece estar associado ao excesso de peso, principalmente de peso visceral. Em adolescentes eutireoideos, parece haver uma relação direta entre TSH e alguns FRC. Concluindo, em nossa amostra de adolescentes acima do peso e obesos, os níveis de TSH parecem estar associados a RI e FRC.
The incidence of obesity in childhood and adolescence is increasing in developing and developed countries.1 In Brazil, a developing country, data from the Household Budget Survey (Pesquisa de Orçamentos Familiares [POF]) showed that the percentage of overweight individuals between the ages of 10 and 19 increased from 3.7% (1974–1975) to 21.7% (2008–2009) in males and from 7.6% to 19.4% in females in the same periods.2
The well-established association between obesity and glucose/lipid metabolism disorders, hypertension and increased cardiovascular risk (CVR) is frequently referred to as metabolic syndrome (MetS).3 Individuals in the pediatric age group may also show increased MetS-related morbidity.3–5
Thyroid hormones (TH) play a key role in regulating metabolism through the modulation of thermogenesis and energy expenditure. The putative relationships between TH, body weight, and adipose tissue homeostasis have been the focus of several studies in recent years, but the causal relationships between these parameters have not been well established.6–12 One review8 included several population-based studies that revealed a correlation between increased serum thyrotropin (TSH) levels and increased BMI.
Thyroid diseases have been associated with atherosclerotic cardiovascular disease.13–16 Although this association has been documented conclusively for overt hypothyroidism, it remains controversial whether it is also present in subclinical hypothyroidism (SCH).17,18 The association of thyroid diseases with atherosclerotic cardiovascular disease may be partially explained by the roles of TH in the regulation of lipid metabolism and blood pressure (BP). Indeed, several recent population-based studies have observed positive correlations between TSH and lipid parameters and between TSH and BP, even in euthyroid populations.6–18 This study aimed to investigate the relationship between thyroid function, obesity, lipids, insulin resistance, and MetS components in a sample of overweight adolescents. The study also aimed to assess the metabolic and anthropometric differences of euthyroid patients with TSH in the upper limit of normality (≥2.5μIU/mL) in comparison to patients in the lower levels.
Patients and methodsSubjectsThis study evaluated a total of 199 overweight and obese pubescent adolescents of both genders between 11 and 17 years of age (from Tanner stage II or post-pubertal stage) who sequentially sought treatment for obesity at the Metabolic Outpatient Clinic of the Luiz Capriglione State Institute of Diabetes and Endocrinology (Instituto Estadual de Diabetes e Endocrinologia Luiz Capriglione [IEDE], Rio de Janeiro, Brazil), from March of 2011 to February of 2013. The protocol was approved by the Ethics Committee of the Institution and a written informed consent was obtained from the participants and their parents/guardians.
This exclusion criteria included the following: pre-pubertal patients; previous diagnosis of either type 1 or type 2 diabetes (T2DM); patients who were receiving anti-diabetic and/or anti-obesity medications; those who had an endocrine disease diagnosis; diagnosed thyroid disease (the use of levothyroxine (LT4) or thionamides); creatinine and urea levels above normal values; aspartate aminotransaminase (AST) and/or aspartate alaninotransferase (ALT) three times above the upper limit of normality; alcohol or drug abuse; chronic and constant-dose concomitant use of beta-blockers, beta-agonists, diuretics, antidepressants, neuroleptics, bromocriptine, ergotamine, and derivatives, atropine, systemic steroids, appetite suppressants, or drugs that interfere with amine activity or are used to treat psychiatric disorders within the past three months; pregnant and lactating females; or a history of neoplasia in the past five years.
Anthropometric examinationAll participants underwent a complete medical history-taking and physical exam. Family members and/or guardians assisted in providing information after signing the informed consent form. The following parameters were evaluated: weight (kg), height (m), body mass index (BMI; kg/m2), waist circumference (WC), waist-to-hip ratio (WHR), BP (mmHg), and demographic factors (gender and age). Weight measurements were obtained using a digital scale Filizola® (Filizola®, SP, Brazil) while each patient was barefoot and wearing light clothing. The height of each patient was measured using a Harpenden® (Harpenden®, United Kingdom) stadiometer with the individual barefoot. WC was measured at the midpoint between the iliac crest and the costal margin. Hip circumference (HC) was obtained by measuring the largest diameter over the great trochanters. The WHR was calculated by determining the ratio between WC and HC. BMI was calculated by dividing the weight (kg) by the height squared (m2).
The American charts from the Centers for Disease Control and Prevention National Center for Health Statistics (CDC-NCHS) were used to assess BMI (http://apps.nccd.cdc.gov/dnpabmi/), according to gender and age. Individuals with a BMI-for-age between the 85th and the 95th percentile were classified as overweight and those with a BMI-for-age at or above the 95th percentile were classified as obese BP was obtained with the patient in a supine position after 5min of rest. All BP measurements were obtained by the same examiner using the same equipment. For BP measurements, a standardized and calibrated mercury-column sphygmomanometer was used with the cuffs adjusted to the body dimensions. All anthropometric measurements were evaluated by the same examiner, and the sexual maturation stage was determined using the Tanner classification of pubertal development.
Laboratory evaluationsBlood samples were collected after a 12-h fasting period, and the results from the following blood tests were evaluated: fasting glucose, 2-h glucose following glucose overload with 75g dextrosol, complete blood count, urea, creatinine, sodium, potassium, total cholesterol, high-density lipoprotein cholesterol (HDL-C), low-density lipoprotein cholesterol (LDL-C), triglycerides, ALT, AST, TSH, free T4 (fT4), and basal insulin. Using the results of fasting glucose and basal insulin, the homeostasis model assessment-insulin resistance (HOMA-IR) index for each patient was calculated using the following formula: HOMA-IR=[Glucose (mMol)×Insulin (μU/mL)]/22.5. The Brazilian Metabolic Syndrome Study (BRAMS) evaluated a population of approximately 2000 patients, including obese and type 2 diabetic adults, and defined insulin resistance (IR) as a HOMA-IR index value greater than 2.71 in individuals with normal BMI.19 This cutoff for HOMA-IR is likely to be representative of the Brazilian population, given the number of patients evaluated.
To evaluate TSH levels, an electrochemiluminescence method was employed. Electrochemiluminescence consists of an immunoassay that quantitatively determines TSH levels from human serum and plasma samples. The normal range of values that have been reported using this kit is 0.5–5.0μIU/mL. The fT4 levels of the patients were also evaluated by electrochemiluminescence, and the reference values ranged between 0.8 and 1.9ng/mL. The fT4 values were only used to exclude patients in the event that values outside of the normal range were obtained.
For the diagnosis of SCH in adolescents, it would be necessary to use specific values according to gender, age, and Tanner stage. However, these data are not available for the Brazilian population. Therefore, the diagnosis of SCH was based on the recommendation 14.1 of the Clinical Practice Guidelines for Hypothyroidism in Adults, cosponsored by the American Association of Clinical Endocrinologists and the American Thyroid Association20: the reference range of a given laboratory exam should determine the upper limit of normal for a third-generation TSH assay. Therefore, the diagnosis of SCH was defined as normal fT4 associated with TSH above 5.0μIU/mL.
Euthyroid patients were also divided into two groups according to TSH levels. There has been some discussion about lowering the upper value of TSH to 2.5μIU/mL. This discussion is based in some data that indicated that patients with TSH≥2.5 may have different profiles than those with TSH<2.5μIU/mL.21,22
Statistical analysisData were analyzed using the GraphPad® InStat 3.00 (GraphPad® Software, USA). The different groups were compared using Student's t-tests for parametric variables and Mann–Whitney tests for nonparametric variables. For parametric variables, the data are presented as means±standard deviations. For nonparametric variables, the data are presented as medians with maximum and minimum values. Correlational analyses were performed with Pearson's test for parametric variables and Spearman's test for nonparametric variables. All tests were two-tailed, and the level of significance was set at p=0.05 for all analyses.
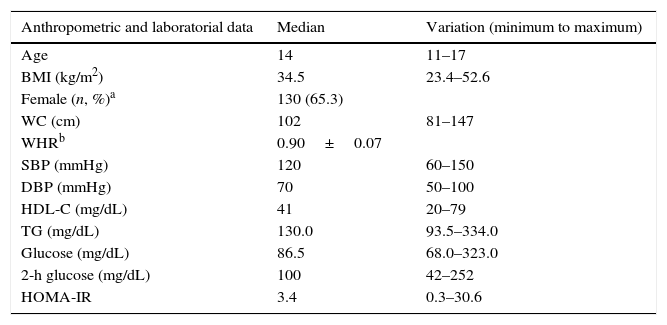
ResultsA total of 199 adolescents examined at the State Institute for Diabetes and Endocrinology were consecutively evaluated. All patients were above Tanner stage II for pubertal development. The frequency of overweight was 6.97% according to the CDC-NCHS chart, and obesity was present in 93.03% of patients. Table 1 shows the anthropometric and metabolic data of the studied population.
Anthropometric and metabolic data of the studied sample.
| Anthropometric and laboratorial data | Median | Variation (minimum to maximum) |
|---|---|---|
| Age | 14 | 11–17 |
| BMI (kg/m2) | 34.5 | 23.4–52.6 |
| Female (n, %)a | 130 (65.3) | |
| WC (cm) | 102 | 81–147 |
| WHRb | 0.90±0.07 | |
| SBP (mmHg) | 120 | 60–150 |
| DBP (mmHg) | 70 | 50–100 |
| HDL-C (mg/dL) | 41 | 20–79 |
| TG (mg/dL) | 130.0 | 93.5–334.0 |
| Glucose (mg/dL) | 86.5 | 68.0–323.0 |
| 2-h glucose (mg/dL) | 100 | 42–252 |
| HOMA-IR | 3.4 | 0.3–30.6 |
BMI, body mass index; WC, waist circumference; WHR, waist-to-hip ratio; SBP, systolic blood pressure; DBP, diastolic blood pressure; HDL-C, high-density lipoprotein cholesterol; TG, triglycerides; HOMA-IR, homeostasis model assessment-insulin resistance.
Regarding glucose metabolism, 13.56% of the sample (27 out of 199) had abnormal fasting glucose levels (i.e., between 100 and 125mg/dL). In addition, 6.03% (12 out of 199) had a 2-h glucose level following a challenge with 75g dextrosol between 140 and 200mg/dL and were thus classified as having impaired glucose tolerance. Finally, four patients (2.02%) received a diagnosis of T2DM. Using the cutoff point for IR that was obtained in the aforementioned Brazilian study (a HOMA-IR value above 2.7), 61.19% (122 out of 199) of the patients presented IR. No changes in fasting glucose or OGTT were observed in overweight patients.
Thyroid function was evaluated by measuring TSH levels (normal range: 0.5–5.0μIU/mL). Two (1.0%) individuals exhibited TSH levels below the normal range (subclinical hyperthyroidism), and 27 individuals (13.56%) presented with TSH levels above the normal level (SCH). All these patients had fT4 within normal limits. No patient was diagnosed with overt hypothyroidism (low fT4 and TSH above 5.0μIU/mL). Patients with subclinical hyperthyroidism (n=2) were not included in the analysis.
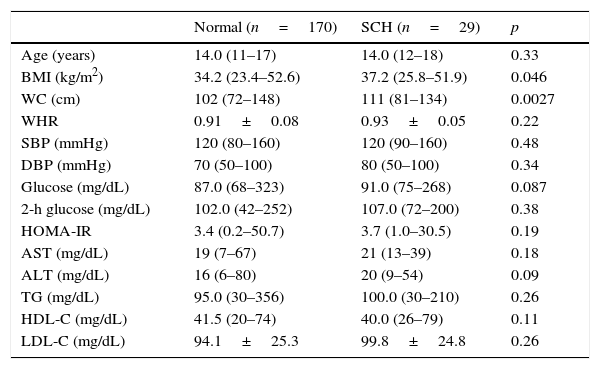
Table 2 shows a comparison of the anthropometric and metabolic parameters of adolescents diagnosed with SCH and euthyroid adolescents. Patients with SCH exhibited a significantly higher WC than those with normal thyroid function. No significant differences were observed between the groups in any of the metabolic parameters examined.
A comparison of metabolic and anthropometric parameters between adolescents with subclinical hypothyroidism (SCH) and those with normal thyroid function.
| Normal (n=170) | SCH (n=29) | p | |
|---|---|---|---|
| Age (years) | 14.0 (11–17) | 14.0 (12–18) | 0.33 |
| BMI (kg/m2) | 34.2 (23.4–52.6) | 37.2 (25.8–51.9) | 0.046 |
| WC (cm) | 102 (72–148) | 111 (81–134) | 0.0027 |
| WHR | 0.91±0.08 | 0.93±0.05 | 0.22 |
| SBP (mmHg) | 120 (80–160) | 120 (90–160) | 0.48 |
| DBP (mmHg) | 70 (50–100) | 80 (50–100) | 0.34 |
| Glucose (mg/dL) | 87.0 (68–323) | 91.0 (75–268) | 0.087 |
| 2-h glucose (mg/dL) | 102.0 (42–252) | 107.0 (72–200) | 0.38 |
| HOMA-IR | 3.4 (0.2–50.7) | 3.7 (1.0–30.5) | 0.19 |
| AST (mg/dL) | 19 (7–67) | 21 (13–39) | 0.18 |
| ALT (mg/dL) | 16 (6–80) | 20 (9–54) | 0.09 |
| TG (mg/dL) | 95.0 (30–356) | 100.0 (30–210) | 0.26 |
| HDL-C (mg/dL) | 41.5 (20–74) | 40.0 (26–79) | 0.11 |
| LDL-C (mg/dL) | 94.1±25.3 | 99.8±24.8 | 0.26 |
BMI, body mass index; WC, waist circumference; WHR, waist-to-hip ratio; SBP, systolic blood pressure; DBP, diastolic blood pressure; HOMA-IR, homeostasis model assessment-insulin resistance; TG, triglyceride; AST, aspartate aminotransferase; ALT, aspartate alanine transferase; HDL-C, high-density lipoprotein cholesterol; LDL-C, low-density lipoprotein cholesterol.
Data are presented as median (minimum−maximum).
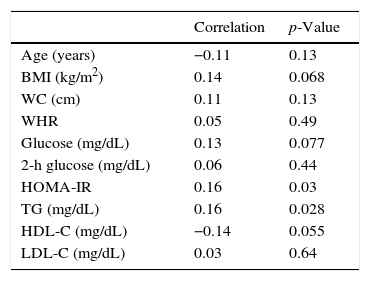
After excluding patients with SCH, the 170 remaining patients (TSH levels within the normal range) were analyzed separately. Table 3 shows the correlations between TSH levels and various anthropometric and metabolic parameters in individuals with normal thyroid function.
Correlations between serum thyrotropin (TSH) levels and various anthropometric and metabolic parameters in 170 adolescents with normal thyroid function.
| Correlation | p-Value | |
|---|---|---|
| Age (years) | −0.11 | 0.13 |
| BMI (kg/m2) | 0.14 | 0.068 |
| WC (cm) | 0.11 | 0.13 |
| WHR | 0.05 | 0.49 |
| Glucose (mg/dL) | 0.13 | 0.077 |
| 2-h glucose (mg/dL) | 0.06 | 0.44 |
| HOMA-IR | 0.16 | 0.03 |
| TG (mg/dL) | 0.16 | 0.028 |
| HDL-C (mg/dL) | −0.14 | 0.055 |
| LDL-C (mg/dL) | 0.03 | 0.64 |
BMI, body mass index; WC, waist circumference; WHR, waist-to-hip ratio; HOMA-IR, homeostasis model assessment-insulin resistance; TG, triglycerides; HDL-C, high-density lipoprotein cholesterol; LDL-C, low-density lipoprotein cholesterol.
Multiple linear regression analysis was used to assess the relationship between TSH and metabolic parameters. In this first model, TSH and BMI were used as independent variables and each metabolic parameter as the dependent variable. After regression, TSH levels remained independently associated with HOMA-IR (p=0.001), HDL (p=0.046), and TG levels (p=0.007). The same analysis was also used to assess whether the relationship between TSH and metabolic parameters would remain statistically significant independent of age and gender. In this second model, age, gender, and TSH levels were used as independent variables and each metabolic parameters as the dependent variable. After regression, TSH remained independently related to HOMA-IR (p=0.0015) and triglycerides (p=0.0092). A trend toward significance was still found for HDL cholesterol (p=0.0508) and fasting glucose (p=0.0706).
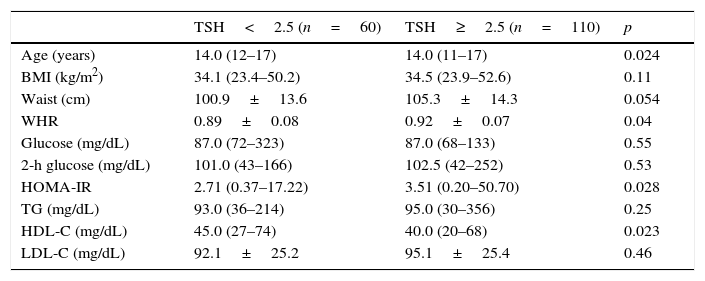
Table 4 shows a comparison of anthropometric and metabolic parameters of individuals with normal thyroid function based on a TSH cutoff value of 2.5μIU/mL. Individuals with TSH levels >2.5 had higher WHR and HOMA-IR and a trend toward higher WC.
Comparison of anthropometric and metabolic parameters in adolescents according to the serum thyrotropin (TSH) cutoff level.
| TSH<2.5 (n=60) | TSH≥2.5 (n=110) | p | |
|---|---|---|---|
| Age (years) | 14.0 (12–17) | 14.0 (11–17) | 0.024 |
| BMI (kg/m2) | 34.1 (23.4–50.2) | 34.5 (23.9–52.6) | 0.11 |
| Waist (cm) | 100.9±13.6 | 105.3±14.3 | 0.054 |
| WHR | 0.89±0.08 | 0.92±0.07 | 0.04 |
| Glucose (mg/dL) | 87.0 (72–323) | 87.0 (68–133) | 0.55 |
| 2-h glucose (mg/dL) | 101.0 (43–166) | 102.5 (42–252) | 0.53 |
| HOMA-IR | 2.71 (0.37–17.22) | 3.51 (0.20–50.70) | 0.028 |
| TG (mg/dL) | 93.0 (36–214) | 95.0 (30–356) | 0.25 |
| HDL-C (mg/dL) | 45.0 (27–74) | 40.0 (20–68) | 0.023 |
| LDL-C (mg/dL) | 92.1±25.2 | 95.1±25.4 | 0.46 |
Data are presented as median (minimum–maximum), except for waist, WHR, and LDL–C, which are presented as mean±SD.
BMI, body mass index; WHR, waist-to-hip ratio; HOMA-IR, homeostasis model assessment-insulin resistance; TG, triglycerides; HDL-C, high-density lipoprotein cholesterol; LDL-C, low-density lipoprotein cholesterol.
In this sample of obese and overweight adolescents, 85% of patients exhibited normal thyroid function and 13.63% exhibited SCH. The frequency of SCH observed in this sample was higher than that reported in the literature, even using a cutoff value of 5.0μIU/mL. In the pediatric population in general, the prevalence of SCH is less than 2%, but it is important to note that epidemiological studies in this age group are scarce.
Several studies have indicated a positive correlation between weight and TSH levels in children. These studies have also demonstrated that 10–23% of obese children have moderately high levels of TSH (4–10μIU/mL), which are associated with normal levels of fT4 or slightly elevated fT4 and/or fT3 levels. The levels of TSH in obese children and adults have been consistently reported to be elevated when compared with normal weight individuals.8,9,12,23,24 Prior research has revealed not only a positive correlation between BMI and TSH, but also between five-year weight gain and a gradual increase in serum TSH levels.8 This is the first study to evaluate TSH levels in a South American population of obese children. Considering that Rio de Janeiro is at an urban area in Brazil, with no iodine deficiency, no reasonable explanation for the elevated prevalence of SCH found in the present study could be identified. Further studies are necessary to investigate whether the prevalence of SCH is higher in Brazil and/or other South American countries.
When patients with SCH were compared with euthyroid individuals, it was observed that patients with SCH had higher WC. This finding is extremely important, as WC provides information regarding the fat distribution. The prevalence of a central distribution of fat correlates with increased CVR, and WC appears to be the best anthropometric method for evaluating this distribution in pubertal adolescents and children, although this remains open to debate.6,25 Central or abdominal obesity, which is characterized by increased WC, has been shown to be correlated with SBP, DBP, total cholesterol, TGs, LDL-C, and HDL-C.4–8 In an article published by Blüher et al., BMI and WC were reported to be the best anthropometric predictors of comorbidities in obese pubertal adolescents.25 Thus, the correlation of TSH with WC contributes to its possible relationship with IR and increased CVR. Several studies in children and adolescents have demonstrated the relationship between TSH and BMI, but few of these have reported a statistically significant relationship with WC.26–28 Interestingly, although several anthropometric parameters of adolescents with SCH were altered, no laboratory abnormalities were observed. Perhaps these data suggest that, at this early time of life, excess weight and visceral fat may not be sufficient to trigger metabolic changes. However, it is possible that these changes will be identified in the future. Prospective studies are needed to evaluate this hypothesis.
In the euthyroid individuals, a weak, but statistically significant, correlation was observed between TSH and HOMA-IR, HDL, and TG. Using TSH and BMI as independent variables, TSH was found to be independently related to HOMA-IR and TG. An Italian study that also made this comparison in overweight children showed that patients with high TSH levels had significantly higher levels of ALT, gamma-glutamyl transferase (GGT), total cholesterol, TG, insulin, and HOMA-IR.26 Likewise, in a Turkish study, TSH was positively correlated with total cholesterol, TG, and SBP.27 Another study of euthyroid obese adolescents and children who underwent rapid weight loss concluded that the decrease in TSH resulted in a reduction of over 50% in the levels of fasting insulin and HOMA-IR regardless of changes in weight or body composition. This improvement was not associated with weight loss, but with a reduction in serum TSH levels. These data suggest that alterations of thyroid function in obesity are not simply adaptive mechanisms.28
Even when examining only euthyroid patients, individuals with higher TSH levels (>2.5μIU/mL) had higher HOMA-IR and WHR, lower levels of HDL-C, and a tendency toward lower WC. There have been relatively few studies investigating euthyroid obese adolescents, but the correlation of HOMA-IR with TSH has been reported in several studies.26–28 Ruhla et al.13 found that euthyroid individuals with TSH in the upper normal range (2.5–4.5) have higher TG levels and an increased incidence of MetS. Roos et al. also reported an association between MetS components and thyroid function in individuals with SCH and in euthyroid individuals. In this study, euthyroid patients with TSH in the upper portion of the normal range displayed higher levels of total cholesterol, glucose, insulin, and HOMA-IR.29
The aforementioned evidence, in addition to the present results, reinforces the relationship between thyroid function, especially TSH levels, and IR. In patients with hypothyroidism, IR has been well documented in muscle and fat tissue, and it results in impaired glucose absorption and decreased gluconeogenesis in skeletal muscle.25 These metabolic changes have been shown to be reversed with LT4 replacement therapy. Several studies have also reported the presence of IR in SCH.6,15 When assessing the lipid profiles of patients with SCH, most studies have not found significant differences in the mean total cholesterol levels of SCH patients when compared with euthyroid individuals, although some studies have noted differences in the frequency of dyslipidemia between these groups.30
The present study has several limitations. First, the fact that it was a cross-sectional study prevented the establishment of temporal relationships between the variables under investigation. In addition, because this study was performed retrospectively, the authors were unable to analyze other parameters, including the levels of fT3, tT3, and leptin. More importantly, thyroid antibodies were also not evaluated. Therefore, it was not possible to determine whether this increased frequency of SCH was related to Hashimoto's thyroiditis or another etiology. A longitudinal study that follows each group over a given period and makes repeated evaluations and observations may lead to different conclusions; future studies are therefore needed. Finally, the diagnosis of SCH should have been based on specific values of TSH according to gender, age, and Tanner stage. Unfortunately, these data are not available for the Brazilian population. Therefore, the diagnosis was based solely in the cutoff value of the kit.
In summary, the frequency of SCH is approximately 15% in a sample of overweight and obese Brazilian adolescents. These individuals, despite exhibiting a metabolic condition similar to that of patients with normal thyroid function, have a higher WC, suggesting that SCH may be associated with excess body weight, especially visceral weight. In adolescents with normal thyroid function, there also appears to be a direct relationship between TSH and some of the primary markers of IR and MetS. These correlations, although statistically significant, were weak and should be carefully interpreted. In particular, patients with TSH in the upper normal limit appear to have a worse metabolic profile, suggesting that thyroid function may be one of the determinants of IR and MetS in this sample. However, the clinical significance of these findings needs to be determined in prospective studies. It will be especially important to perform large studies examining the potential advantages of treating obese children and adolescents, targeting a TSH of approximately 2.5 to attenuate metabolic repercussions.
Conflicts of interestThe authors declare no conflicts of interest.
Please cite this article as: Souza LL, Guedes EP, Teixeira PF, Moreira RO, Godoy-Matos AF, Vaisman M. Serum TSH levels are associated with cardiovascular risk factors in overweight and obese adolescents. J Pediatr (Rio J). 2016;92:532–8.


