To assess fetal visceral adiposity and associated factors during pregnancy.
MethodsSecondary analysis of prospective cohort data with 172 pairs (pregnant woman/fetus) treated at public health units. Anthropometric data, metabolic (glucose, glycated hemoglobin, insulin, insulin resistance, total cholesterol and fractions, triglycerides) measures, fetal biometry, and visceral and subcutaneous adiposity in the binomial (pregnant woman/fetus) were evaluated at the 16th, 28th and 36th gestational weeks by ultrasonography. Pearson's correlation coefficient and multiple linear regression were used, with a significance level of 5%.
ResultsAt the 16th week, the mean age of the pregnant women was 26.6±5.8 years and mean weight was 62.7±11.5kg; 47.0% had normal weight, 28.3% were overweight, 13.3% were underweight, and 11.2% were obese. At 36 weeks, 44.1% had inadequate gestational weight gain, 32.5% had adequate gestational weight gain, and 23.3% had excessive gestational weight gain. Fetal visceral adiposity at week 36 showed a positive correlation with maternal variables: weight (r=0.15) and body mass index (r=0.21) at the 16th; with weight (r=0.19), body mass index (r=0.24), and gestational weight gain (r=0.21) at the 28th; and with weight (r=0.22), body mass index (r=0.26), and gestational weight gain (r=0.21) at the 36th week. After multiple linear regression, adiposity at the 28th week remained associated with fetal variables: abdominal circumference (p<0.0001), head circumference (p=0.01), area (p<0.0001), and thigh circumference (p<0.001). At the 36th week, adiposity remained associated with the abdominal circumference of the 28th (p=0.02) and 36th weeks (p<0.001).
ConclusionAdiposity was positively correlated with the measurements of the pregnant woman. After the multivariate analysis, the persistence of the association occurred with the abdominal circumference, a central adiposity measurement with a higher metabolic risk.
Avaliar a adiposidade visceral fetal e fatores associados na gestação.
MétodosAnálise secundária de dados de coorte prospectiva com 172 pares (gestantes/fetos) atendidas em unidades públicas de saúde. Foram avaliadas nas gestantes na 16ª, 28ª e 36ª semana gestacional: medidas antropométricas, metabólicas (glicose, hemoglobina glicada, insulina, resistência à insulina, colesterol total e frações, triglicerídeos), biometria fetal e adiposidade visceral e subcutânea no binômio (gestantes/feto) por ultrassonografia. Utilizamos o coeficiente de correlação de Pearson e regressão linear múltipla, com nível de significância de 5%.
ResultadosNa 16ª semana a média de idade das gestantes foi de 26,6±5,8 anos e peso 62,7±11,5 quilogramas, 47,0% eram eutróficas, 28,3% sobrepeso, 13,3% baixo peso e 11,2% obesas. Na 36ª semana, 44,1% tiveram ganho ponderal gestacional insuficiente, 32,5% adequado e 23,3% excessivo. A adiposidade visceral fetal na 36ª semana apresentou correlação positiva com variáveis maternas: peso (r=0,15) e índice de massa corpórea (r=0,21) na 16ª; com peso (r=0,19), índice de massa corpórea (r=0,24) e ganho ponderal gestacional (r=0,21) na 28ª; com peso (r=0,22), índice de massa corpórea (r=0,26) e ganho ponderal gestacional (r=0,21) na 36ª semana. Após regressão linear múltipla a adiposidade na 28ª semana permaneceu associada com variáveis fetais: circunferência abdominal (p<0,0001), circunferência cefálica (p=0,01), área (p<0,0001) e circunferência da coxa (p<0,001). Na 36ª semana com circunferência abdominal da 28ª (p=0,02) e 36ª semana (p<0,001).
ConclusãoA adiposidade foi positivamente correlacionada com medidas da gestante, após análise multivariada a persistência da associação deu-se com a circunferência abdominal, medida de adiposidade central, de maior risco metabólico.
Excess weight during the gestational period, considered a public health problem, has been further studied aiming to elucidate the metabolic change mechanisms in the offspring, both in early life and in the long term.1,2 The association of the maternal nutritional status with cardiometabolic markers at birth suggests that adiposity in children can be prevented in the intrauterine period.3
In response to the adverse intrauterine environment, the fetus adapts its development to maximize its chances of survival, with a redefinition of metabolic, endocrine, and growth homeostasis.4 The phenotype, altered at birth, confirms the theory that chronic diseases have even earlier roots, during the fetal phase.4
The adipose tissue development occurs essentially in the intrauterine period, with epigenetic mechanisms being crucial factors for this prenatal programming; thus, modifications reprogram the metabolism of this tissue, altering its body distribution, defining adipogenesis.5 Adipose tissue, mainly the visceral type, is associated with changes in glucose metabolism, as well as insulin sensitivity.6 In this homeostasis, the subcutaneous tissue is considered a storage mechanism, but the biological mechanisms of these associations are not clear.7
Visceral (intra-abdominal) adiposity has a greater impact on metabolic changes due to the deterioration of insulin sensitivity.8 Neonates with a greater deposition of visceral fat showed a greater chance of developing insulin resistance (IR), an independent predictor of increased adiposity in the first week of life.9
An adverse maternal metabolic profile, as well as the significant interaction of this profile in the second half of pregnancy with the pre-gestational nutritional status, constitute factors that can be associated with fetal and neonatal adiposity.10 However, it is not clear which maternal metabolic factors have a significant impact on growth, body composition, and fetal adiposity, as well as at which stage of pregnancy they are more relevant.
Studies suggest that neonate adiposity is associated with the maternal nutritional status in early pregnancy, gestational weight gain (GWG), and that the maternal visceral adiposity positively correlates with fetal biometry evaluated by ultrasonography.11,12
The aim of the present study was to identify maternal factors and fetal biometrics associated with fetal visceral adiposity.
MethodsStudy designThis is a secondary analysis of cohort data involving 172 pairs (pregnant woman/fetus). The study was carried out at Instituto Paraibano de Pesquisa Professor Joaquim Amorim Neto (IPESQ), Campina Grande, state of Paraíba, Brazil, from September 2014 to December 2015, after approval by the Research Ethics Committee of Hospital Universitário Alcides Carneiro of Universidade Federal da Paraíba (HUAC/UFPB) (CAAE: 79559817.2.0000.5182).
SampleSample size calculation was performed using the public domain statistical program Open Epi, version 2.3 (Atlanta, GA, United States), assuming a 22.8% increase of maternal abdominal circumference (AC) in the immediate postpartum period.13 For a power of 85% and a confidence level of 95%, it would be necessary to have 148 pregnant women. The sample was increased by 30%, to account for possible loss to follow-up, totaling 200 pregnant women.
Eligibility criteriaThis study included pregnant women with a living fetus, gestational age (GA) ≤16 weeks, undergoing prenatal care in the city of Campina Grande, PB, Brazil. Pregnant women with psychiatric diseases, chronic diseases (diabetes mellitus, systemic arterial hypertension, heart disease, nephropathies, epilepsy, and renal failure), multiple gestation, adolescents in the absence of legal representatives, and cases of congenital malformations were excluded.
The pregnant women were invited to participate at public health units, referred to IPESQ, and obstetric ultrasonography (USG) was performed to confirm the GA (up to the 16th week) and to eliminate fetal malformations. The study objectives were explained and the women were included only if they agreed to participate, by signing the free and informed consent form.
The following maternal variables were studied: age (years); pre-gestational weight and current weight (kg); height (meters); body mass index (BMI) (kg/m2); number of pregnancies and consultations; interpregnancy interval; schooling (full years); parity; life habits (alcohol consumption, smoking, and illicit drug use); nutritional status (obesity, overweight, normal weight, and low weight); GWG (28th and 36th weeks); GWG classification (inadequate, adequate, and excessive); visceral and subcutaneous adiposity; thigh circumference; arm circumference; skin folds (suprailiac and tricipital); fasting blood glucose; oral glucose tolerance test (OGTT); fasting insulin; total cholesterol; high-density lipoprotein cholesterol (HDL-c); low-density lipoprotein cholesterol (LDL-c); triglycerides; IR index (HOMA-IR), and glycated hemoglobin (HbA1c).
The assessed fetal variables were: estimated fetal weight (EFW); AC and head circumference; femur length; fetal thigh circumference (FTC), thigh area, and thickness; and visceral and subcutaneous adiposity.
Data collectionPatients were evaluated at the 16th (first visit), 28th, and 36th weeks (plus or minus one week), and the precise GA was not calculated on the day of the data collection. The USG was performed by a single observer, who was a specialist in fetal medicine. Maternal visceral and subcutaneous adiposity were measured only at the 16th week, according to the technique described by Armellini et al.,14 using a Voluson 730 expert (GE) device, with a linear transducer of 2–7MHz placed 1cm from the umbilicus, with the visceral fat thickness being measured, in centimeters, from the inner border of the rectus abdominis muscle, at the level of the linea alba, to the abdominal aorta anterior wall. The subcutaneous fat was measured from the minimum distance of the subcutaneous fat to the linea alba, considering the lowest value at this point.
To assess the fetal measurements, the same device was used with a convex probe, of 2–5MHz, generally used as a standard for obstetric USG. Measurement of the visceral tissue was performed at the 28th and 36th weeks of pregnancy, obtaining a cross-sectional ultrasonographic view of the fetal AC at one centimeter from the umbilical cord insertion. The image was enlarged and fixed, and the abdominal visceral tissue measurement was obtained in millimeters.14 The calipers were carefully placed on the outer edge of the skin and on the inner margin of the anterior abdominal wall for the measurement of abdominal subcutaneous tissue, measured only at the 36th week.
The accumulation of adipose tissue was also measured in the fetal thigh, through a cross-sectional mid-thigh ultrasonographic view. The image was fixed, enlarged, and measured in millimeters, corresponding to the distance from the outer surface of the femur to the inner border of the skin.14 The EFW calculation was assessed by the Hadlock equation.15
At the 16th, 28th, and 36th weeks, the pregnant women were submitted to anthropometric weight and height evaluations, and the BMI was calculated. The pre-gestational BMI was determined according to the weight and height before pregnancy, reported by the pregnant woman at the 16th week, classified as: low weight (BMI≤18.5kg/m2), normal weight (18.5<BMI<25kg/m2), overweight (25≤BMI<30kg/m2), or obesity (BMI≥30kg/m2).16 The pregnant women were classified regarding the nutritional status according to GA.17 GWG was obtained by the difference between the weight at the assessed week and the pre-gestational weight.
The following were measured in the pregnant woman: arm circumference, at the midpoint between the acromion and the olecranon; thigh circumference, at mid-distance between the inguinal line and the upper edge of the patella; and the skin folds in the tricipital and suprailiac region, using a Lange plicometer.18 Visceral and subcutaneous adiposities in the pregnant women were only measured at the 16th week, as there was a technical difficulty to measure them in the other trimesters, when the adipose tissue is compressed by the gravid uterus.19
The biochemical analysis performed at the 16th and 36th gestational weeks included total cholesterol, HDL-c, LDL-c, triglycerides, HbA1c, insulin, fasting glycemia, and IR. A fasting glucose level ≥92mg/dL or HbA1c ≥6.5% at the 16th week was considered a diagnosis of gestational diabetes mellitus (GDM), in addition to the OGTT with an overload of 75g of anhydrous glucose showing one or more altered values, performed between the 24th and 28th week. Fasting glycemia values, as well as values one hour and two hours after the glucose overload, were considered to be altered if they were ≥92mg/dL, 180mg/dL, and 153mg/dL, respectively.20
Data analysisFor statistical analysis, the software Medcalc v.18.6 (Medical Software – United States), R Core Team (2017), and the public domain software Epi-Info v.7.2.2.6 (Atlanta, GA, United States) were used. Frequency distribution tables were constructed for the categorical variables, and measures of central tendency (mean or median) and dispersion (standard deviation or interquartile range) were calculated for the quantitative variables. Normally distributed residuals were observed at 36 weeks; however, the residuals were not normally distributed in the adjusted model for 28 weeks and, therefore, generalized linear models were adjusted; the most adequate distribution was the inverse normal function with identity link.
The following pre-gestational maternal factors were evaluated: weight (continuous variable, in kilograms); BMI (continuous, in kg/m2); habits, and gestational history. As for the gestational variables (at the 16th, 28th, and 36th week) the following were included: age (numerical variable, in full years); weight (continuous, in kilograms or grams); BMI; GWG (continuous, in kilograms, from the pre-gestational weight informed or collected from the health card and weight at the 28th and 36th week); visceral and subcutaneous fat (continuous variables, in centimeters); arm and thigh circumference (continuous, in centimeters, using an inelastic tape); suprailiac and tricipital skin folds (continuous, in millimeters, using a plicometer).
As for the laboratory variables, the following levels were included: total cholesterol, HDL-c, LDL-c, triglycerides, and fasting glycemia (continuous variables, in milligrams per deciliter [mg/dL]); insulinemia (continuous, in micromoles per milliliter – μUI/mL) and IR ([HOMA-IR=¼ ½ fasting glucose (nmol/L)×fasting insulin (IU/mL)/22.5], normal if below 2.15).
The following variables were evaluated in the fetus: EFW (continuous, in grams); visceral and subcutaneous adiposity, head circumference, AC, femur length, thigh area, FTC, and thigh thickness (continuous variables, in millimeters).
Pearson's correlation coefficient was used to determine the correlation between the dependent variables (fetal visceral adiposity at the 28th and 36th gestational week) and the other variables, considering a significance level of 5%.
To identify the factors associated with fetal visceral adiposity, a multiple stepwise linear regression analysis was performed, including variables that had a significance level of 20% in the bivariate analysis. For the final model, the selected variables were the ones that remained associated with the outcome at the significance level of 5%.
ResultsA total of 255 women were referred to the IPESQ, of whom 200 were included and agreed to participate. There were 28 losses: two due to loss of contact, one due to fetal death, and 25 who refused to return or missed two collection steps, thus 172 pairs (mother/fetus) remained.
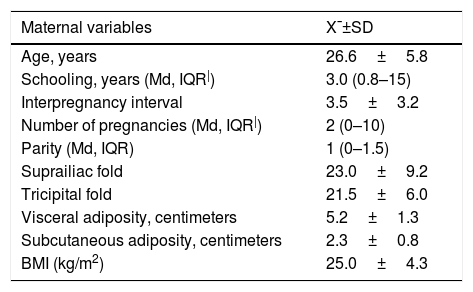
The mean age of pregnant women was 26.6±5.8 years, the mean weight at the 16th week was 62.7±11.5kg, the mean visceral adiposity was 5.2±1.3cm, and the subcutaneous, 2.3±0.8cm. According to the pre-gestational BMI, 47.0% had normal weight and according to the GWG classification at the 36th week, 44.1% had inadequate gain, 32.5% had adequate and 23.3% had excessive weight gain. The frequency of GDM was 2.8%. The mean fetal visceral adiposity at the 28th week was 4.4±0.5cm, and 6.1±0.6cm at the 36th week (Table 1).
Biological, sociodemographic, anthropometric, metabolic and biochemical characteristics of mothers at the 16th gestational week.
| Maternal variables | X¯±SD |
|---|---|
| Age, years | 26.6±5.8 |
| Schooling, years (Md, IQR|) | 3.0 (0.8–15) |
| Interpregnancy interval | 3.5±3.2 |
| Number of pregnancies (Md, IQR|) | 2 (0–10) |
| Parity (Md, IQR) | 1 (0–1.5) |
| Suprailiac fold | 23.0±9.2 |
| Tricipital fold | 21.5±6.0 |
| Visceral adiposity, centimeters | 5.2±1.3 |
| Subcutaneous adiposity, centimeters | 2.3±0.8 |
| BMI (kg/m2) | 25.0±4.3 |
| Classification according to BMI | n (%) |
|---|---|
| Low weight | 24 (13.0) |
| Normal weight | 92 (48.7) |
| Overweight/Obesity | 71 (38.7) |
| Total | 187 (100.0) |
| Weight gain, kg | 1.1±2.9 |
| Classification of weight gain (36th week) | n (%) |
|---|---|
| Inadequate | 72 (44.1) |
| Adequate | 53 (32.5) |
| Excessive | 38 (23.3) |
| Total | 163 (100.0) |
| Gestational diabetes | 5 (2.8%) |
| Alcohol consumption | 19 (9.5%) |
| Smokers | 11 (6%) |
| Users of illicit drugs | 01 (0.5%) |
| Laboratory tests | X¯±SD |
|---|---|
| Total cholesterol, mg/dL | 169.6±30.8 |
| HDL cholesterol, mg/dL | 50.3±11.1 |
| LDL cholesterol, mg/dL | 97.2±24.0 |
| Triglycerides, mg/dL | 112.4±56.7 |
| Fasting glycemia, mg/dL | 70.1±15.2 |
| Fasting insulin | 5.8±4.1 |
| HOMA-IR | 18.5±14.2 |
| Fetal variables | X¯±SD |
|---|---|
| Fetal visceral adiposity, millimeters (28th week) | 4.4±0.5 |
| Fetal visceral adiposity, millimeters (36th week) | 6.1±0.6 |
| Fetal subcutaneous adiposity, millimeters (36th week) | 4.4±1.6 |
X¯, mean; SD, standard deviation; HDL-c, high density lipoprotein cholesterol; HOMA-IR, homeostatic model assessment insulin resistance; BMI, body mass index; IQR, interquartile range; LDL-c, low-density lipoprotein cholesterol; Md, median.
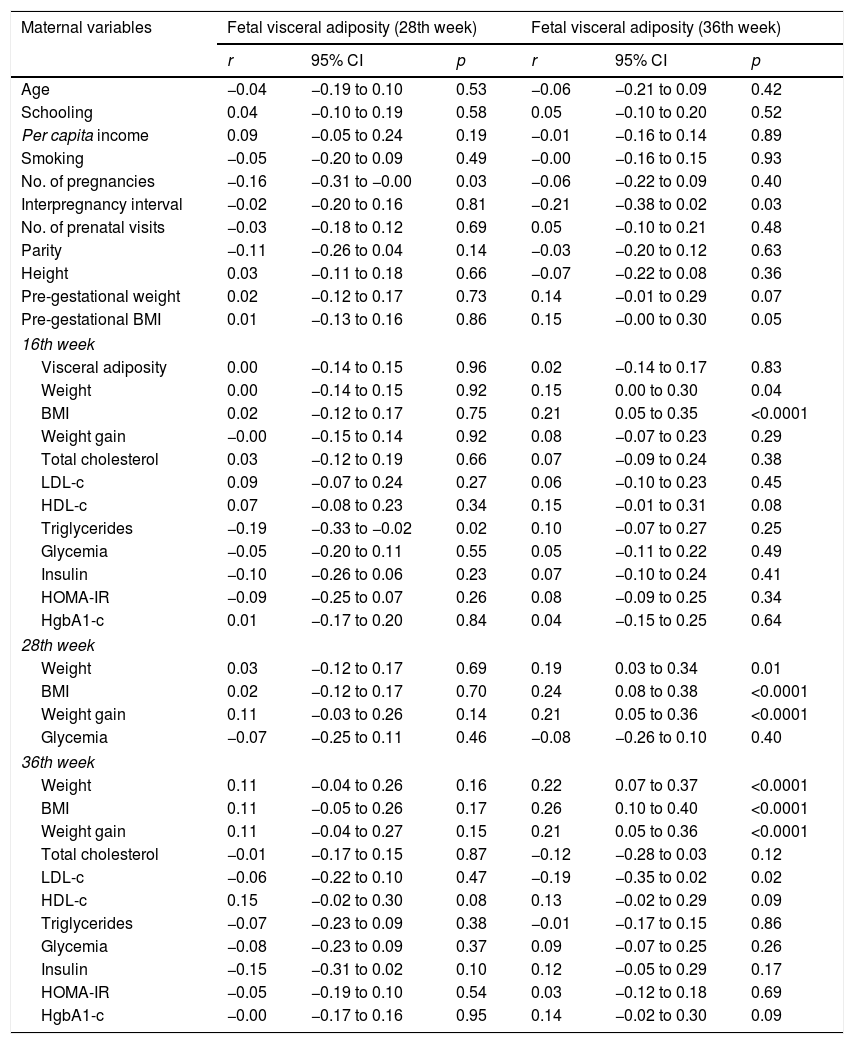
There was a positive correlation between fetal visceral adiposity at the 28th week with the number of pregnancies (r=−0.16, 95% CI: −0.31 to −0.00, p=0.03) and triglyceride levels at the16th week (r=−0.19, 95% CI: −0.33 to −0.02, p=0.02). Fetal visceral adiposity at the 36th week showed a correlation with maternal variables: interpregnancy interval (r=−0.21, 95% CI: −0.38 to 0.02, p=0.03), pre-gestational BMI (r=0.15, 95% CI: −0.00 to 0.30, p=0.05), weight (r=0.15, 95% CI: 0.00 to 0.30, p=0.04) and BMI (r=0.21, 95% CI: 0.05 to 0.35, p<0.0001) at the 16th week; with weight (r=0.19, 95% CI: 0.03 to 0.34, p=0.01), BMI (r=0.24, 95% CI: 0.08 to 0.38, p<0.001), and GWG (r=0.21, 95% CI: 0.05 to 0.36, p<0.0001) at the 28th week; with weight (r=0.22; 95% CI: 0.07 to 0.37; p<0.0001), BMI (r=0.26; 95% CI: 0.10 to 0.40; p<0.0001), and GWG (r=0.21; 95% CI: 0.05 to 0.36; p<0.0001) and LDL-c (r=−0.19; 95% CI: −0.35 to 0.02; p=0.02) at the 36th week (Table 2).
Correlation of biological, anthropometric, sociodemographic, metabolic, and hemodynamic maternal characteristics with fetal visceral adiposity at the 28th and 36th weeks.
| Maternal variables | Fetal visceral adiposity (28th week) | Fetal visceral adiposity (36th week) | ||||
|---|---|---|---|---|---|---|
| r | 95% CI | p | r | 95% CI | p | |
| Age | −0.04 | −0.19 to 0.10 | 0.53 | −0.06 | −0.21 to 0.09 | 0.42 |
| Schooling | 0.04 | −0.10 to 0.19 | 0.58 | 0.05 | −0.10 to 0.20 | 0.52 |
| Per capita income | 0.09 | −0.05 to 0.24 | 0.19 | −0.01 | −0.16 to 0.14 | 0.89 |
| Smoking | −0.05 | −0.20 to 0.09 | 0.49 | −0.00 | −0.16 to 0.15 | 0.93 |
| No. of pregnancies | −0.16 | −0.31 to −0.00 | 0.03 | −0.06 | −0.22 to 0.09 | 0.40 |
| Interpregnancy interval | −0.02 | −0.20 to 0.16 | 0.81 | −0.21 | −0.38 to 0.02 | 0.03 |
| No. of prenatal visits | −0.03 | −0.18 to 0.12 | 0.69 | 0.05 | −0.10 to 0.21 | 0.48 |
| Parity | −0.11 | −0.26 to 0.04 | 0.14 | −0.03 | −0.20 to 0.12 | 0.63 |
| Height | 0.03 | −0.11 to 0.18 | 0.66 | −0.07 | −0.22 to 0.08 | 0.36 |
| Pre-gestational weight | 0.02 | −0.12 to 0.17 | 0.73 | 0.14 | −0.01 to 0.29 | 0.07 |
| Pre-gestational BMI | 0.01 | −0.13 to 0.16 | 0.86 | 0.15 | −0.00 to 0.30 | 0.05 |
| 16th week | ||||||
| Visceral adiposity | 0.00 | −0.14 to 0.15 | 0.96 | 0.02 | −0.14 to 0.17 | 0.83 |
| Weight | 0.00 | −0.14 to 0.15 | 0.92 | 0.15 | 0.00 to 0.30 | 0.04 |
| BMI | 0.02 | −0.12 to 0.17 | 0.75 | 0.21 | 0.05 to 0.35 | <0.0001 |
| Weight gain | −0.00 | −0.15 to 0.14 | 0.92 | 0.08 | −0.07 to 0.23 | 0.29 |
| Total cholesterol | 0.03 | −0.12 to 0.19 | 0.66 | 0.07 | −0.09 to 0.24 | 0.38 |
| LDL-c | 0.09 | −0.07 to 0.24 | 0.27 | 0.06 | −0.10 to 0.23 | 0.45 |
| HDL-c | 0.07 | −0.08 to 0.23 | 0.34 | 0.15 | −0.01 to 0.31 | 0.08 |
| Triglycerides | −0.19 | −0.33 to −0.02 | 0.02 | 0.10 | −0.07 to 0.27 | 0.25 |
| Glycemia | −0.05 | −0.20 to 0.11 | 0.55 | 0.05 | −0.11 to 0.22 | 0.49 |
| Insulin | −0.10 | −0.26 to 0.06 | 0.23 | 0.07 | −0.10 to 0.24 | 0.41 |
| HOMA-IR | −0.09 | −0.25 to 0.07 | 0.26 | 0.08 | −0.09 to 0.25 | 0.34 |
| HgbA1-c | 0.01 | −0.17 to 0.20 | 0.84 | 0.04 | −0.15 to 0.25 | 0.64 |
| 28th week | ||||||
| Weight | 0.03 | −0.12 to 0.17 | 0.69 | 0.19 | 0.03 to 0.34 | 0.01 |
| BMI | 0.02 | −0.12 to 0.17 | 0.70 | 0.24 | 0.08 to 0.38 | <0.0001 |
| Weight gain | 0.11 | −0.03 to 0.26 | 0.14 | 0.21 | 0.05 to 0.36 | <0.0001 |
| Glycemia | −0.07 | −0.25 to 0.11 | 0.46 | −0.08 | −0.26 to 0.10 | 0.40 |
| 36th week | ||||||
| Weight | 0.11 | −0.04 to 0.26 | 0.16 | 0.22 | 0.07 to 0.37 | <0.0001 |
| BMI | 0.11 | −0.05 to 0.26 | 0.17 | 0.26 | 0.10 to 0.40 | <0.0001 |
| Weight gain | 0.11 | −0.04 to 0.27 | 0.15 | 0.21 | 0.05 to 0.36 | <0.0001 |
| Total cholesterol | −0.01 | −0.17 to 0.15 | 0.87 | −0.12 | −0.28 to 0.03 | 0.12 |
| LDL-c | −0.06 | −0.22 to 0.10 | 0.47 | −0.19 | −0.35 to 0.02 | 0.02 |
| HDL-c | 0.15 | −0.02 to 0.30 | 0.08 | 0.13 | −0.02 to 0.29 | 0.09 |
| Triglycerides | −0.07 | −0.23 to 0.09 | 0.38 | −0.01 | −0.17 to 0.15 | 0.86 |
| Glycemia | −0.08 | −0.23 to 0.09 | 0.37 | 0.09 | −0.07 to 0.25 | 0.26 |
| Insulin | −0.15 | −0.31 to 0.02 | 0.10 | 0.12 | −0.05 to 0.29 | 0.17 |
| HOMA-IR | −0.05 | −0.19 to 0.10 | 0.54 | 0.03 | −0.12 to 0.18 | 0.69 |
| HgbA1-c | −0.00 | −0.17 to 0.16 | 0.95 | 0.14 | −0.02 to 0.30 | 0.09 |
r, Pearson's correlation coefficient; p, level of significance; CI, confidence interval; No., number; BMI, body mass index; LDL-c, low-density lipoprotein cholesterol; HDL-c, high density lipoprotein cholesterol; HOMA-IR, homeostatic model assessment insulin resistance; HgbA1-c, glycated hemoglobin.
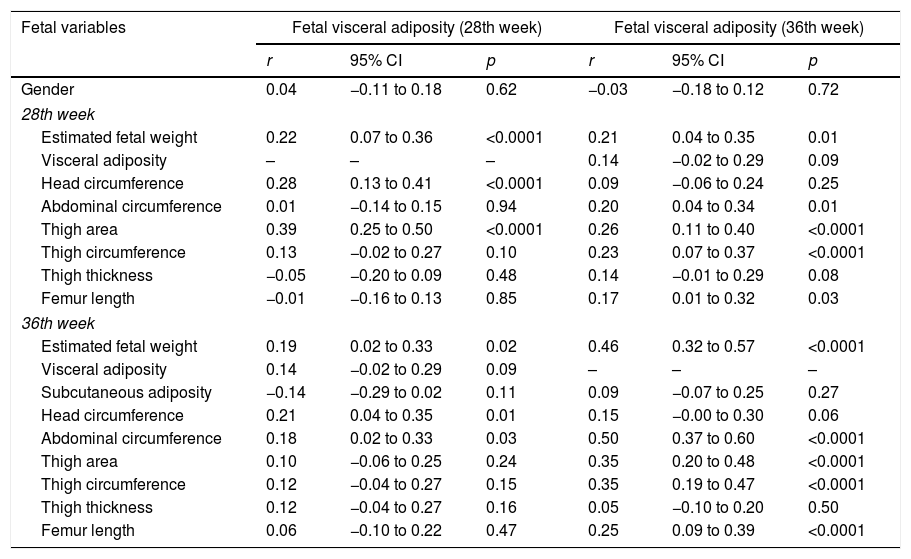
Fetal visceral adiposity at the 28th week showed a correlation with fetal variables in this week: EFW (r=0.22, 95% CI: 0.07 to 0.36, p<0.0001), head circumference (r=0.28; 95% CI: 0.13 to 0.41, p<0.0001) and thigh area (r=0.39, 95% CI: 0.25 to 0.50, p<0.0001); at the 36th week with EFW (r=0.19, 95% CI: 0.02 to 0.33, p=0.02), head circumference (r=0.21, 95% CI: 0.04 to 0.35, p=0.01), and AC (r=0.18, 95% CI: 0.02 to 0.33, p=0.03).
Fetal visceral adiposity at the 36th week showed a correlation with EFW (r=0.21, r=0.46), fetal AC (r=0.20, r=0.50), femur length (r=0.17, r=0.25), thigh area (r=0.26, r=0.35), and FTC (r=0.23, r=0.35) at the 28th and 36th week, respectively (Table 3).
Correlation of fetal measurements with fetal visceral adiposity at the 28th and 36th week.
| Fetal variables | Fetal visceral adiposity (28th week) | Fetal visceral adiposity (36th week) | ||||
|---|---|---|---|---|---|---|
| r | 95% CI | p | r | 95% CI | p | |
| Gender | 0.04 | −0.11 to 0.18 | 0.62 | −0.03 | −0.18 to 0.12 | 0.72 |
| 28th week | ||||||
| Estimated fetal weight | 0.22 | 0.07 to 0.36 | <0.0001 | 0.21 | 0.04 to 0.35 | 0.01 |
| Visceral adiposity | – | – | – | 0.14 | −0.02 to 0.29 | 0.09 |
| Head circumference | 0.28 | 0.13 to 0.41 | <0.0001 | 0.09 | −0.06 to 0.24 | 0.25 |
| Abdominal circumference | 0.01 | −0.14 to 0.15 | 0.94 | 0.20 | 0.04 to 0.34 | 0.01 |
| Thigh area | 0.39 | 0.25 to 0.50 | <0.0001 | 0.26 | 0.11 to 0.40 | <0.0001 |
| Thigh circumference | 0.13 | −0.02 to 0.27 | 0.10 | 0.23 | 0.07 to 0.37 | <0.0001 |
| Thigh thickness | −0.05 | −0.20 to 0.09 | 0.48 | 0.14 | −0.01 to 0.29 | 0.08 |
| Femur length | −0.01 | −0.16 to 0.13 | 0.85 | 0.17 | 0.01 to 0.32 | 0.03 |
| 36th week | ||||||
| Estimated fetal weight | 0.19 | 0.02 to 0.33 | 0.02 | 0.46 | 0.32 to 0.57 | <0.0001 |
| Visceral adiposity | 0.14 | −0.02 to 0.29 | 0.09 | – | – | – |
| Subcutaneous adiposity | −0.14 | −0.29 to 0.02 | 0.11 | 0.09 | −0.07 to 0.25 | 0.27 |
| Head circumference | 0.21 | 0.04 to 0.35 | 0.01 | 0.15 | −0.00 to 0.30 | 0.06 |
| Abdominal circumference | 0.18 | 0.02 to 0.33 | 0.03 | 0.50 | 0.37 to 0.60 | <0.0001 |
| Thigh area | 0.10 | −0.06 to 0.25 | 0.24 | 0.35 | 0.20 to 0.48 | <0.0001 |
| Thigh circumference | 0.12 | −0.04 to 0.27 | 0.15 | 0.35 | 0.19 to 0.47 | <0.0001 |
| Thigh thickness | 0.12 | −0.04 to 0.27 | 0.16 | 0.05 | −0.10 to 0.20 | 0.50 |
| Femur length | 0.06 | −0.10 to 0.22 | 0.47 | 0.25 | 0.09 to 0.39 | <0.0001 |
r, Pearson's correlation coefficient; CI, confidence interval; p, level of significance.
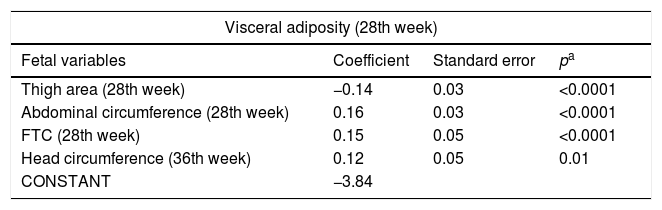
After the multiple regression analysis, the following variables remained associated with fetal visceral adiposity at the 28th week: thigh area (p<0.0001), fetal AC (p<0.0001), and FTC (p<0.0001) in this week and with head circumference (p=0.01) at the 36th week. The following remained associated with fetal visceral adiposity at the 36th week: fetal CA at the 28th (p=0.02) and the 36th week (p<0.0001) (Table 4).
Final model of the factors associated with visceral adiposity at the 28th and 36th week of gestational age.
| Visceral adiposity (28th week) | |||
|---|---|---|---|
| Fetal variables | Coefficient | Standard error | pa |
| Thigh area (28th week) | −0.14 | 0.03 | <0.0001 |
| Abdominal circumference (28th week) | 0.16 | 0.03 | <0.0001 |
| FTC (28th week) | 0.15 | 0.05 | <0.0001 |
| Head circumference (36th week) | 0.12 | 0.05 | 0.01 |
| CONSTANT | −3.84 | ||
| Visceral adiposity (36th week) | |||
|---|---|---|---|
| Fetal variables | Coefficient | Standard error | pa |
| Abdominal circumference (28th week) | 0.11 | 0.05 | 0.02 |
| Abdominal circumference (36th week) | 0.18 | 0.05 | <0.0001 |
| CONSTANT | −3.54 | ||
FTC, fetal thigh circumference.
Stepwise multiple linear regression.
(Equation=visceral adiposity at 28 weeks=−3.84+thigh area at 28th week −0.14+0.03).
(Equation=visceral adiposity at 28 weeks=−3.84+abdominal circumference at the 28th week 0.16+0.03).
(Equation=visceral adiposity at 28 weeks=−3.84+thigh circumference at the 36th week 0.12+0.05).
(Equation=visceral adiposity at 28 weeks=−3.84+head circumference at the 36th week 0.15+0.05).
(Equation=visceral adiposity at 36 weeks=−3.54+abdominal circumference at the 28th week 0.11+abdominal circumference at 36th week 0.18+0.05).
The fetal measurements in this study were within the expected means for the population and according to the GA, with the mean AC at the 28th and 36th week remaining below the 90th percentile, according to the classification proposed by Hadlock.18 During fetal growth, adiposity can change due to maternal habits, and there is little evidence of associated factors in the intrauterine environment.21
In the present study, only fetal visceral adiposity at the 36th week showed a positive correlation with maternal factors: weight, BMI at the 16th, 28th, and 36th week, and GWG at the 28th and 36th week. This significant correlation between nutritional status and GWG with visceral adiposity in neonates is consistent with the results from other studies.3,22 However, in addition to not having found a study that correlated fetal visceral adiposity with these maternal factors, contradictory results of the maternal obesity effect on the offspring's adiposity have been observed.23,24
In a study that evaluated visceral adiposity in neonates and obese and non-obese mothers with GDM, no difference was found between them.23 However, a positive association between maternal BMI and abdominal adiposity in neonates was observed, although it was not discriminated whether it was subcutaneous or visceral.24
Maternal weight and glucose homeostasis have been suggested as the most important determinants of fetal growth, with hyperglycemia being capable of influencing the transfer of lipids to the fetus or these lipids being able to alter glucose transfer pathways in the placenta.25 Although more than one-third of this sample had excess weight, there was a reduced frequency of GDM, which may justify the non-permanence of the association of maternal factors with fetal visceral adiposity, with the final model including only fetal variables. Two other studies also did not observe fetal exposure to hyperinsulinemia in pregnant women without GDM, although these were obese.26,27
There was a correlation of fetal visceral adiposity at the 28th and 36th week with the following fetal measures: estimated fetal weight, thigh, and AC measurements. In that sense, in a prospective cohort assessed by USG at the 28th and 36th week, fetal thigh volume at the 28th week resulted in a more accurate model for predicting the percentage of neonatal body fat, surpassing the models that used AC and EFW.28
It should be noted that in this study, in the multiple linear regression analysis for the control of confounding factors, the AC, head circumference, FTC, and area remained associated with fetal visceral adiposity at the 28th week. This association is justified because the measurement of visceral adiposity includes adipose tissue deposits in the retroperitoneum, which particularly influences fetal AC. This measurement was shown in a previous study to be positively related to the percentage of fat in the midthigh (r=0.22, p=0.029) and with abdominal subcutaneous adiposity (r=0.27, p=0.004), after adjustment to the area of fat deposition.29
A cohort study followed 109 low-risk pregnant women through USG assessment and evaluated fetal adiposity at the 12th, 20th, and 30th week, observing that at the 30th week it may constitute a better adiposity predictor than the EFW by conventional biometrics.28 The authors reiterate that the technique (USG) used in this study is validated to assess fetal visceral adiposity, increasing the reliability of the results, although it is more difficult due to fetal size, a study limitation.
Fetal visceral adiposity at the 36th week remained associated, after the multiple linear regression analysis, with fetal AC at the 28th and 36th week. An increased risk for abdominal adiposity was observed, and the AC, evaluated by USG, showed greater growth in the last trimester, being capable of estimating the growth increase of the insulin-dependent fetal tissues more accurately than the biparietal diameter.22,30
There was no association between fetal visceral adiposity and the metabolic profile of the pregnant women in this study, a result attributed to the good metabolic profile of these women, justified by the low prevalence of GDM.
The central distribution of adiposity in the abdominal region, a zone of visceral tissue deposition, is associated with cardiometabolic risk factors, IR, dyslipidemia, metabolic syndrome, and other diseases in the long term.30 Therefore, fetal visceral adiposity can be an early indicator of metabolic risk, and its evaluation allows better understanding of the fat deposition ontogenesis, justifying the action on the determinants and the development of potential interventions in this period.
This prospective cohort encompasses three gestational trimesters, being one of its advantages, as in addition to assessing longitudinal measures of fetal biometry and adiposity in the binomial (mother/fetus) by USG, it evaluates the association of these measures with metabolic and anthropometric biomarkers, a topic scarcely explored in Brazil.
USG is a useful technique in the evaluation of intra-abdominal fat deposits, showing a statistically significant correlation with computed tomography. As a limitation, there is a technical difficulty in obtaining measurements in the third trimester, caused by the compression of the adipose tissue by the gravid uterus, which may result in underestimated or overestimated measurements.
The sample homogeneity, pregnancy follow-up, and inclusion of healthy women constituted strengths of the study. Ultrasonographic estimates of fetal biometrics are predictors of metabolic health, and although they are more reliable at the end of pregnancy, during this period the intervention may be less effective, justifying the need to identify predictors earlier.
Fetal visceral adiposity was shown to be positively associated with fetal AC, a measurement of central adiposity distribution with a higher metabolic risk. This study is one of the few to have assessed this adiposity, and longitudinal studies are necessary to establish the pathways acting on maternal factors. The actual role of maternal BMI and GWG, considering they are modifiable risk factors and thus, potentially preventable, remains to be elucidated in future studies.
FundingConselho Nacional de Desenvolvimento Científico e Tecnológico (CNPq), Notice no. 14/2012 – approved in November 2012. The funding source had no other participation in the study phases.
Conflicts of interestThe authors declare no conflicts of interest.
To Instituto de Pesquisa Professor Joaquim Amorim Neto (IPESq), the site of data collection.
articles


