To determine the prevalence of low back pain and to analyze the association with the individual, sociodemographic variables, electronic devices, habitual practice of physical activity, and mental health problems.
MethodsCross-sectional study with 1,628 students in public schools in the city of Bauru, SP, Brazil. The following data were collected: 1. demographic and socioeconomic aspects; 2. Use of electronic devices; 3. habitual physical activity level (Baecke); 3. mental health (SDQ). 4. low back pain (Nordic Questionnaire). Descriptive analyzes and bivariate and multivariate logistic regression were used.
ResultsThe overall prevalence of low back pain was 46.7% (95% CI: 44.27 to 49.11); men showed a prevalence of 42.0% (95% CI: 36.63 to 43.41) and women 58.0% (95% CI: 49.73 to 56.51), a statistically significant difference. The variables associated with pain in the low back region were: female gender (PR=1.70), daily TV use for more than 3hours (PR=1.17), use of laptop computer (PR=1.40), use of the cell phone in the supine position (PR=1.23), use of the cell phone in semi-supine position (PR=1.49), daily cell phone use for more than 3hours (PR=1.36), use of tablet (PR=1.67), daily tablet use for more than above 3hours (PR=1.46), and clinically important mental health problems (PR=2.62).
ConclusionThere is a high prevalence of low back pain in high school students and striking association with female sex, electronic devices, and mental health problems.
Determinar a prevalência de lombalgia e analisar a associação com variáveis individuais e sociodemográficas, dispositivos eletrônicos, prática habitual de atividade física e problemas de saúde mental.
MétodosEstudo transversal com 1.628 alunos matriculados em escolas públicas na cidade de Bauru/SP. Para a coleta de dados: 1. aspectos demográficos e socioeconômicos; 2. dispositivos eletrônicos; 3. nível habitual de atividade física (Baecke); 3. saúde mental (SDQ); 4. Lombalgia (Questionário Nórdico). Foram usadas análises descritivas e de regressão logística bivariada e multivariada.
ResultadosA prevalência geral de lombalgia foi 46,7% (IC de 95%: 44,27 a 49,11), os homens mostraram uma prevalência de 42,0% (IC de 95%: 36,63 a 43,41) e as mulheres mostraram uma prevalência de 58,0% (IC de 95%: 49,73 a 56,51), com diferença significativa. As variáveis associadas a dor na região lombar inferior foram: sexo feminino (RP=1,70), tempo de uso de TV acima de 3 horas por dia (RP=1,17), uso de notebook (RP=1,40), uso de celular na posição supina (RP=1,23), uso de celular na posição semissupina (RP=1,49), tempo de uso de celular acima de 3 horas por dia (RP=1,36), uso de tablet (RP=1,67), tempo de uso de tablet acima de 3 horas por dia (RP=1,46) e problemas de saúde mental clinicamente importantes (RP=2,62).
ConclusãoHá alta prevalência de lombalgia em alunos do ensino médio e forte associação ao sexo feminino, dispositivos eletrônicos e problemas de saúde mental.
Low back pain (LBP) is the leading cause of disability among adolescents and adults of all ages. According to the World Health Organization (WHO), the musculoskeletal comorbidities are the most incapacitating conditions; of the 209 health conditions, LBP has contributed more to the overall incapacity, occupying the sixth position in the global burden of diseases defined by disability-adjusted life years.1,2
In both developed and developing countries, the prevalence of LBP in high school adolescents has been reported. In Shanghai (China),3 the prevalence was 33.1%; in Brazil, this rate was reported as 13.7% in Pelotas,4 13.4% in Porto Alegre,5 42.1% in Petrolina,6 and 46.9% in Recife.7
The Brazilian and international literature relate the nonspecific LBP in adolescents to sociodemographic factors, practice of physical exercise, smoking, nutritional status, conditions associated to school (support type and mode of transport of the material, weight of the school bag, school furniture), use of devices electronics (TV, computer, tablet, and cell phone),8–11 and mental health problems.5,9 Regarding the use of tablet and cell phone, there are no Brazilian data on this association.
Studies on the prevalence of LBP in the population are important due to generating social and economic consequences, both for the state as for individuals. For the individual it means the loss of quality of life, and for the state, the expenses with treatment and rehabilitation. Due to factors related to the growth process, adolescents have higher chances of developing postural changes and pain in the lumbar spine, interfering directly in their academic performance. Furthermore, adolescents with LBP will probably develop pain in the economically active age, contributing to the increase of indirect costs (absenteeism, falling productivity, early retirement, and sickness),7 which represent approximately 85% of the total costs.11
The present study contributes to other epidemiological investigations and collaborate for the knowledge of the national estimates of the prevalence and its risk factors, for systematic reviews and meta-analysis, since the availability of the sources of data from surveys on the association of LBP with the use of electronic devices (tablet and cell phone) in Brazilian adolescents are scarce. This study may also assist in the understanding of its global cause and contribute to public policies aimed to control this problem, based on preventive and/or therapeutic interventions.12
Considering these points, this study aimed to determine the prevalence of LBP and to analyze the association with the individual and sociodemographic variables, use of electronic devices, practice of physical activity, and mental health problems.
MethodsStudy designThis was a cross-sectional study, approved by the Ethics in Research Committee of Universidade Sagrado Coração, (number 1.972.579), with 1628 students of the first and second grades of secondary education in public schools of Bauru, SP, Brazil.
ParticipantsThe study included adolescent enrolled in the first and second grades of secondary education in public schools in the city of Bauru, SP, Brazil. According to data provided by the State Department of Education—Teaching Board of Bauru, in 2017 there were approximately 9000 students.
Age groups and sex were defined through sampling areas, for which minimum numbers in the sample were calculated to allow subsequent analyzes. The sampling areas were the 1st and 2nd year of secondary education of both sexes.
To determine the size of the sample, the formula for the calculation of samples for finite populations was used, with the following parameters: confidence level of 95%, prevalence of 50%, unknown percentage complement (100-p), size of the population (9000 high school students from state schools), and maximum permissible error of 3%. Thus, the sample size for the group was calculated at least 990 individuals, plus 20% of expected losses and 15% for association studies, for a total of 1366 adolescents.
The sample size calculation considered a plan with cluster sampling in two stages, where the primary sampling units (PSU) were the schools and secondary sampling units (SSU) were the classes of the three years of high school of the selected schools. The sample of schoolchildren was formed, therefore, by all the students of SSU classes selected in the sample of schools PSU.
The PSU schools were stratified, initially, considering their geographical location in accordance with the division of the city into eight sectors. In each of these, schools with classes of 1st and 2nd years of high school were counted, reaching the quantities in each sector. It was observed that in three consecutive sectors, between the west and the east of the city (counterclockwise), state high schools were not located; therefore these three sectors were rejected and considered only the remaining five, which concentrate the 30 schools, between the east and west of the city (counterclockwise).
In each geographic stratum, the sample was obtained in two stages. First, schools were selected through a method of selection with probabilities proportional to size. The measure of size considered in the selection of the schools was the total number of students in the 2 years of high school in each school, and that the percentage of each year in relation to the total number of students (9000): 36.9% and 33.6%, respectively. These percentages were applied to the sample (1366 students), obtaining the total number of students to be interviewed per sector and per year of high school (second approach). To reach the total determined for each sector, the schools were randomly selected, as well as the classes of the respective schools.
The criteria adopted for the exclusion of some schools randomly selected for the study were: individuals younger than 14 years or older than 18 years; non submission of informed consent form (ICF) signed by parents/guardians; and refusal to participate.
InstrumentsThe socio-demographic aspects were: sex (male and female), age, marital status (married or common law union, single, separated, and widowed), ethnicity (white, black, brown/mixed-race), and socioeconomic classification (class E=up to one Brazilian minimum wage, class D=one to five Brazilian minimum wages, class C=five to ten Brazilian minimum wages, class B=10–20 Brazilian minimum wages, class A=more than 20 Brazilian minimum wages).
Regarding electronic devices (use of TV, computer, tablet, or cell phone) the following questions were asked: “In a normal week class, do you watch TV?” (yes/no); “How many times a week do you watch TV?” (once or twice, three or four times, five times, more than five times); “How many hours a day do you watch TV?” (less than one hour, two hours, three hours, four hours, five hours, more than five hours a day); “Do you use a computer?” (yes/no); “What type of computer do you use?” (Desktop, laptop); “What is the height of your computer screen?” (eyes above the midpoint of the screen, eyes approximately in the middle point of the screen, eyes below the mid-point of the screen); “How many times a week do you use a computer?” (once or twice, three or four times, five times, more than five times); “How many hours a day do you use a computer?” (less than one hour, two hours, three hours, four hours, five hours, more than five hours a day); What is the eye-to-screen distance while using your computer? (<20cm, 20cm to 25cm, 25cm to 30cm, and >30cm); “Do you use a cell phone?” (yes/no); “What posture are you when you use a mobile phone?” (standing, sitting, lying, or semi-lying); “Average daily time using cell phone?” (<1h, 2h to 3h, 3h to 4h, and 4h); “What is the eye-to-screen distance during the use of the cell phone?” (<10cm, 10cm to 15cm, 15cm to 20cm, and >20cm); “Do you use a tablet?” (yes/no); “What posture are you when you use a tablet?” (standing, sitting, lying, or semi-lying); “Average daily time using tablet?” (<1h, 2h to 3h, 3h to 4h and <4h); and “What is the eye-to-screen distance while using the tablet? (<10cm, 10cm to 15cm, 15cm to 20cm, and >20cm).
The habitual physical activity level was verified using the Baecke Questionnaire of Habitual Physical Activity (BQHPA), validated in Brazil.13
Mental health was evaluated through the Strengths and Difficulties Questionnaire (SDQ), validated in Brazil by Fleitlich-Bilyk. The possibilities of results indicated by the instrument for all five subscales and the total number of difficulties are three: “Normal” (healthy): indicates that there are no difficulties regarding what is being assessed; “Borderline”: indicates that the child or adolescent already presents some difficulty that, if not properly cared for, can deteriorate and jeopardize their development; “abnormal” (clinical): indicates that there are major difficulties relating to what is being assessed, requiring specialized intervention.14,15
The variable “LBP” was observed using the Nordic questionnaire, which was validated and adapted to the Brazilian culture.16,17 LBP (LBP) is characterized by pain or discomfort in the lumbar region, below the costal margin and above the gluteal fold, that may or may not irradiate to the thigh. In the interview, individuals were asked the following question: “Did you have any pain or discomfort in your lower back in the past year?” In addition to the verbal questionnaire, an image of the spinal regions in different colors was also presented, so the interviewees could better specify the lower back region where the pain was located.16–18
Data collection procedureThe State Department of Education authorized the research and, after consent of the parents/guardians, data collection took place between the months of March to June 2017. Data was collected by undergraduates and post-graduates, trained based on a protocol of standardization procedures data collection (theoretical and practical), previously established with the intention of minimizing possible intra- and inter-rater errors.
At the time of collection, the study participants received the questionnaire with instructions and recommendations for its fulfillment; no time limit was established for its completion and any doubts expressed by the adolescents were promptly answered by the professional who would monitor the data collection process. When completing the questionnaire, the adolescents did not communicate among themselves, in order to minimize possible undesirable interference in their answers.
Data analysisData analysis was performed in the program SPSS (IBM SPSS Statistics 18.0—SPSS. Inc., Chicago, IL, United States). In the descriptive analysis, the prevalence of all the variables included in the study was calculated, with the respective confidence intervals. The demographic and socioeconomic variables, use of electronic devices, habitual physical activity level, and mental health were considered independent variables. Independent variables with a significance level of p<0.20 in the bivariate analysis were included in a Poisson regression model with robust variance, and the assumptions required for Poisson regression to yield a valid result were respected. The effect measure was presented as prevalence ratio (PR) with 95% confidence interval (CI). The threshold α=0.05 was used to indicate statistical significance.19
ResultsA total of 1628 students were assessed, already deducted from the final percentage of 2.05% of refusals. Regarding the sociodemographic characteristics of the sample, 51.5% of the males and 53.7% of the females were in the first year of high school; 87.0% of the males and 82.5% of the females were in the age group of 15 to 18 years; 47.4% of males and 51.9% of females were white; and 85.9% of males and 97.2% of females were single. Regarding the level of physical activity, the majority of males (46.5%) and females (50.7%) were classified as sufficiently active and 16.4% of the males and 35.7% of the females, as insufficiently active. For the mental health variable, 68.7% of males and 42.3% of females were considered healthy, while 11.3% of men and 30.0% of women were classified as unhealthy.
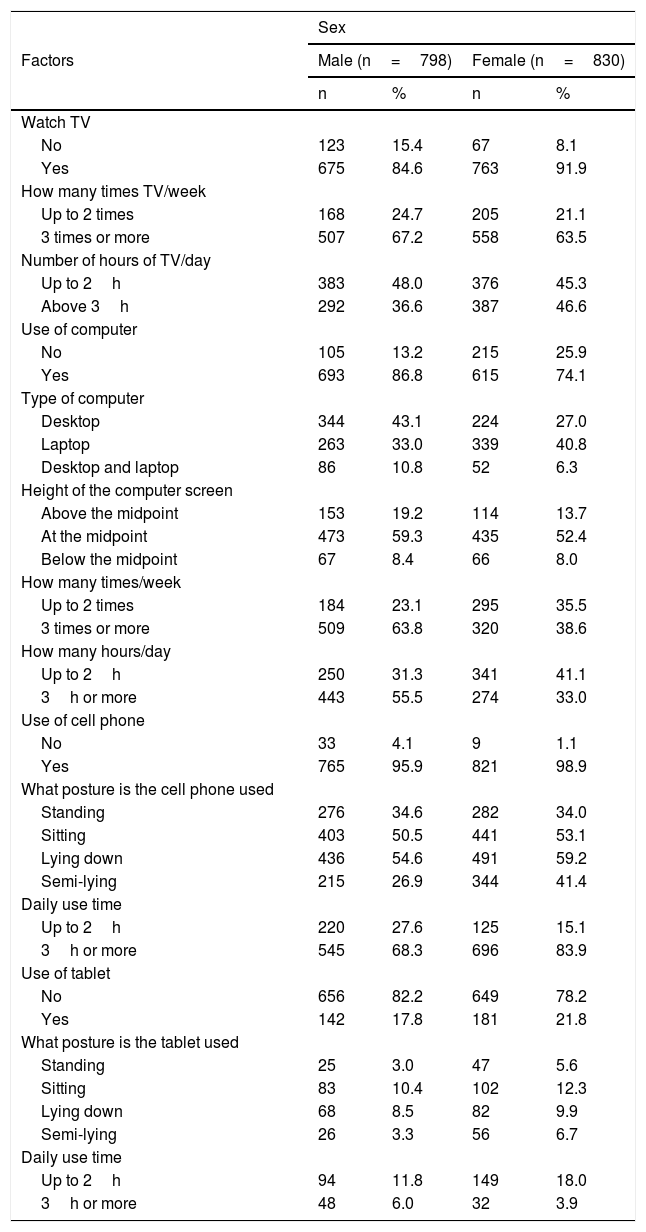
The variables related to the use of electronic devices in high school adolescents are presented in Table 1.
Distribution of absolute and relative frequencies of electronic devices in high school adolescents by sex.
| Factors | Sex | |||
|---|---|---|---|---|
| Male (n=798) | Female (n=830) | |||
| n | % | n | % | |
| Watch TV | ||||
| No | 123 | 15.4 | 67 | 8.1 |
| Yes | 675 | 84.6 | 763 | 91.9 |
| How many times TV/week | ||||
| Up to 2 times | 168 | 24.7 | 205 | 21.1 |
| 3 times or more | 507 | 67.2 | 558 | 63.5 |
| Number of hours of TV/day | ||||
| Up to 2h | 383 | 48.0 | 376 | 45.3 |
| Above 3h | 292 | 36.6 | 387 | 46.6 |
| Use of computer | ||||
| No | 105 | 13.2 | 215 | 25.9 |
| Yes | 693 | 86.8 | 615 | 74.1 |
| Type of computer | ||||
| Desktop | 344 | 43.1 | 224 | 27.0 |
| Laptop | 263 | 33.0 | 339 | 40.8 |
| Desktop and laptop | 86 | 10.8 | 52 | 6.3 |
| Height of the computer screen | ||||
| Above the midpoint | 153 | 19.2 | 114 | 13.7 |
| At the midpoint | 473 | 59.3 | 435 | 52.4 |
| Below the midpoint | 67 | 8.4 | 66 | 8.0 |
| How many times/week | ||||
| Up to 2 times | 184 | 23.1 | 295 | 35.5 |
| 3 times or more | 509 | 63.8 | 320 | 38.6 |
| How many hours/day | ||||
| Up to 2h | 250 | 31.3 | 341 | 41.1 |
| 3h or more | 443 | 55.5 | 274 | 33.0 |
| Use of cell phone | ||||
| No | 33 | 4.1 | 9 | 1.1 |
| Yes | 765 | 95.9 | 821 | 98.9 |
| What posture is the cell phone used | ||||
| Standing | 276 | 34.6 | 282 | 34.0 |
| Sitting | 403 | 50.5 | 441 | 53.1 |
| Lying down | 436 | 54.6 | 491 | 59.2 |
| Semi-lying | 215 | 26.9 | 344 | 41.4 |
| Daily use time | ||||
| Up to 2h | 220 | 27.6 | 125 | 15.1 |
| 3h or more | 545 | 68.3 | 696 | 83.9 |
| Use of tablet | ||||
| No | 656 | 82.2 | 649 | 78.2 |
| Yes | 142 | 17.8 | 181 | 21.8 |
| What posture is the tablet used | ||||
| Standing | 25 | 3.0 | 47 | 5.6 |
| Sitting | 83 | 10.4 | 102 | 12.3 |
| Lying down | 68 | 8.5 | 82 | 9.9 |
| Semi-lying | 26 | 3.3 | 56 | 6.7 |
| Daily use time | ||||
| Up to 2h | 94 | 11.8 | 149 | 18.0 |
| 3h or more | 48 | 6.0 | 32 | 3.9 |
Of the subjects interviewed, 46.7% (95% CI: 44.27–49.11) reported LBP at least some time in the 12 months preceding the interview; 42.0% (95% CI: 36.63–43.41) of men and 58.0% (95% CI: 49.73–56.51) of women, a statistically significant difference.
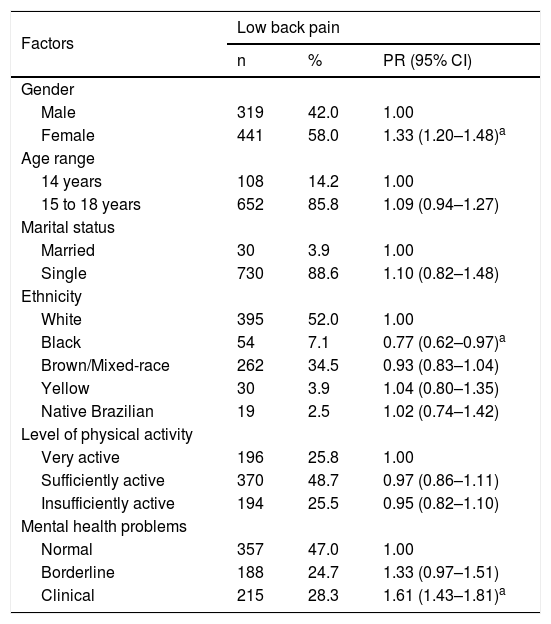
Table 2 presents a statistically significant association between LBP with the female sex, black ethnicity, and mental health problems
Bivariate analysis of low back pain with sociodemographic characteristics, level of physical activity and mental health problems in high school adolescents.
| Factors | Low back pain | ||
|---|---|---|---|
| n | % | PR (95% CI) | |
| Gender | |||
| Male | 319 | 42.0 | 1.00 |
| Female | 441 | 58.0 | 1.33 (1.20–1.48)a |
| Age range | |||
| 14 years | 108 | 14.2 | 1.00 |
| 15 to 18 years | 652 | 85.8 | 1.09 (0.94–1.27) |
| Marital status | |||
| Married | 30 | 3.9 | 1.00 |
| Single | 730 | 88.6 | 1.10 (0.82–1.48) |
| Ethnicity | |||
| White | 395 | 52.0 | 1.00 |
| Black | 54 | 7.1 | 0.77 (0.62–0.97)a |
| Brown/Mixed-race | 262 | 34.5 | 0.93 (0.83–1.04) |
| Yellow | 30 | 3.9 | 1.04 (0.80–1.35) |
| Native Brazilian | 19 | 2.5 | 1.02 (0.74–1.42) |
| Level of physical activity | |||
| Very active | 196 | 25.8 | 1.00 |
| Sufficiently active | 370 | 48.7 | 0.97 (0.86–1.11) |
| Insufficiently active | 194 | 25.5 | 0.95 (0.82–1.10) |
| Mental health problems | |||
| Normal | 357 | 47.0 | 1.00 |
| Borderline | 188 | 24.7 | 1.33 (0.97–1.51) |
| Clinical | 215 | 28.3 | 1.61 (1.43–1.81)a |
CI, confidence interval; PR, prevalence ratio.
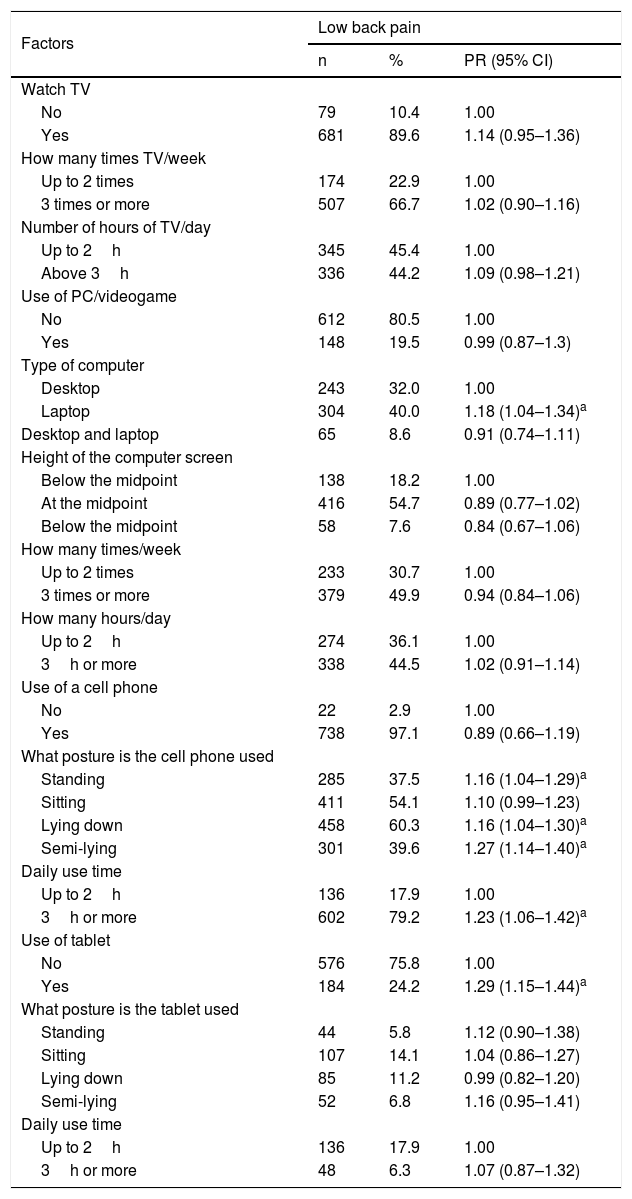
Table 3 presents the association of LBP with the use of laptop computer; use of a cell phone in the postures standing up, lying and semi-lying; daily cell phone use for more than 3h; and use of a tablet.
Bivariate analysis of low back pain with electronic devices in high school adolescents.
| Factors | Low back pain | ||
|---|---|---|---|
| n | % | PR (95% CI) | |
| Watch TV | |||
| No | 79 | 10.4 | 1.00 |
| Yes | 681 | 89.6 | 1.14 (0.95–1.36) |
| How many times TV/week | |||
| Up to 2 times | 174 | 22.9 | 1.00 |
| 3 times or more | 507 | 66.7 | 1.02 (0.90–1.16) |
| Number of hours of TV/day | |||
| Up to 2h | 345 | 45.4 | 1.00 |
| Above 3h | 336 | 44.2 | 1.09 (0.98–1.21) |
| Use of PC/videogame | |||
| No | 612 | 80.5 | 1.00 |
| Yes | 148 | 19.5 | 0.99 (0.87–1.3) |
| Type of computer | |||
| Desktop | 243 | 32.0 | 1.00 |
| Laptop | 304 | 40.0 | 1.18 (1.04–1.34)a |
| Desktop and laptop | 65 | 8.6 | 0.91 (0.74–1.11) |
| Height of the computer screen | |||
| Below the midpoint | 138 | 18.2 | 1.00 |
| At the midpoint | 416 | 54.7 | 0.89 (0.77–1.02) |
| Below the midpoint | 58 | 7.6 | 0.84 (0.67–1.06) |
| How many times/week | |||
| Up to 2 times | 233 | 30.7 | 1.00 |
| 3 times or more | 379 | 49.9 | 0.94 (0.84–1.06) |
| How many hours/day | |||
| Up to 2h | 274 | 36.1 | 1.00 |
| 3h or more | 338 | 44.5 | 1.02 (0.91–1.14) |
| Use of a cell phone | |||
| No | 22 | 2.9 | 1.00 |
| Yes | 738 | 97.1 | 0.89 (0.66–1.19) |
| What posture is the cell phone used | |||
| Standing | 285 | 37.5 | 1.16 (1.04–1.29)a |
| Sitting | 411 | 54.1 | 1.10 (0.99–1.23) |
| Lying down | 458 | 60.3 | 1.16 (1.04–1.30)a |
| Semi-lying | 301 | 39.6 | 1.27 (1.14–1.40)a |
| Daily use time | |||
| Up to 2h | 136 | 17.9 | 1.00 |
| 3h or more | 602 | 79.2 | 1.23 (1.06–1.42)a |
| Use of tablet | |||
| No | 576 | 75.8 | 1.00 |
| Yes | 184 | 24.2 | 1.29 (1.15–1.44)a |
| What posture is the tablet used | |||
| Standing | 44 | 5.8 | 1.12 (0.90–1.38) |
| Sitting | 107 | 14.1 | 1.04 (0.86–1.27) |
| Lying down | 85 | 11.2 | 0.99 (0.82–1.20) |
| Semi-lying | 52 | 6.8 | 1.16 (0.95–1.41) |
| Daily use time | |||
| Up to 2h | 136 | 17.9 | 1.00 |
| 3h or more | 48 | 6.3 | 1.07 (0.87–1.32) |
CI, confidence interval; PR, prevalence ratio.
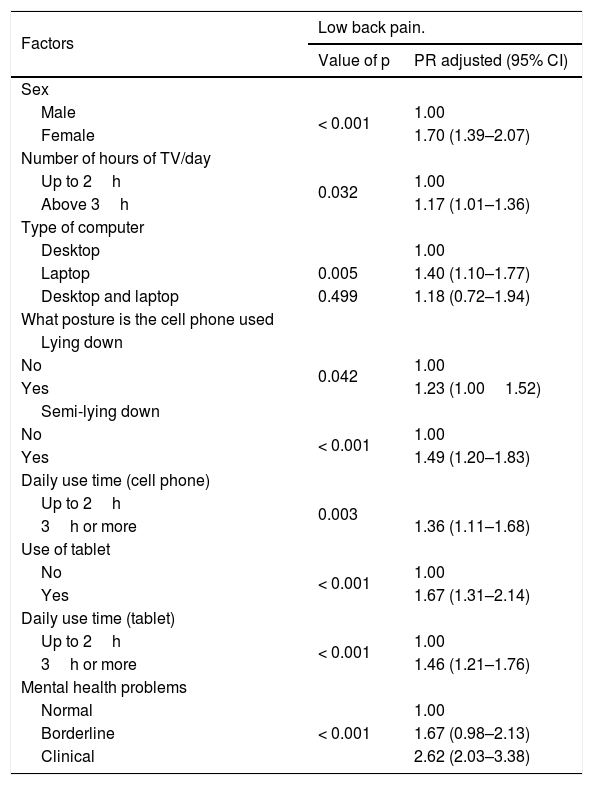
The variables that remained significantly associated with LBP were: female sex, daily TV use for more than 3h, use of a laptop computer, use of a cell phone in lying position, use of a cell phone in semi-lying position, daily cell phone use for more than 3h, use of tablet; daily tablet use for more than 3h, and mental health problems (Table 4).
Multivariate logistic regression, for associations of variables with low back pain in high school adolescents.
| Factors | Low back pain. | |
|---|---|---|
| Value of p | PR adjusted (95% CI) | |
| Sex | ||
| Male | < 0.001 | 1.00 |
| Female | 1.70 (1.39–2.07) | |
| Number of hours of TV/day | ||
| Up to 2h | 0.032 | 1.00 |
| Above 3h | 1.17 (1.01–1.36) | |
| Type of computer | ||
| Desktop | 1.00 | |
| Laptop | 0.005 | 1.40 (1.10–1.77) |
| Desktop and laptop | 0.499 | 1.18 (0.72–1.94) |
| What posture is the cell phone used | ||
| Lying down | ||
| No | 0.042 | 1.00 |
| Yes | 1.23 (1.001.52) | |
| Semi-lying down | ||
| No | < 0.001 | 1.00 |
| Yes | 1.49 (1.20–1.83) | |
| Daily use time (cell phone) | ||
| Up to 2h | 0.003 | |
| 3h or more | 1.36 (1.11–1.68) | |
| Use of tablet | ||
| No | < 0.001 | 1.00 |
| Yes | 1.67 (1.31–2.14) | |
| Daily use time (tablet) | ||
| Up to 2h | < 0.001 | 1.00 |
| 3h or more | 1.46 (1.21–1.76) | |
| Mental health problems | ||
| Normal | < 0.001 | 1.00 |
| Borderline | 1.67 (0.98–2.13) | |
| Clinical | 2.62 (2.03–3.38) | |
CI, confidence interval; PR, prevalence ratio.
In the present study, the prevalence of LBP was 46.7%. The prevalence in other countries has been reported as follows: 33.1% in Shanghai, China.3 In some Brazilian localities, a prevalence of 13.7% was observed in Pelotas,4 13.4% in Porto Alegre,5 42.1% in Petrolina,6 46.9% in Recife,7 32.9% in Piauí,20 and 27.7% in São Leopoldo, RS.21 These variations in prevalence may be a result of sociocultural, demographic, economic, and occupational differences of the locations investigated.
The outcome remained associated with females, with daily TV use for more than 3h, use of laptop computer, use of mobile in lying position, using the cell phone in semi-lying position, daily cell phone use for more than 3h, use of tablet, daily table use for more than 3h, and mental health problems.
Females were approximately 1.70 times more likely to develop pain when compared with men, similar to other studies in adolescents.3,7,20,22 The female sex presents structural and psychosocial differences in relation to males, such as musculoskeletal differences, which make women predisposed to overload in the vertebral column in the long periods that adolescents are sitting in school, hormonal changes resulting from puberty, lower levels of physical activity, and greater frequency of pain reporting.20,23 The present study assessed whether the LBP was related to the menstrual period, which excludes the risk of an overestimated prevalence in women and confirms it as an associated factor.
The use of television, cell phone, and tablet over 3h a day was associated with the outcome, corroborating the findings of other investigations.23–26 The use of information and communication technologies is a potential risk factor for the development of spinal pain. It is believed that the explanation is based on inadequate static posture adopted using these devices associated with a prolonged time, which generates musculoskeletal overload, reduction of blood flow, and muscle spasm, activating the pain receptors. In addition, the excess time daily in static posture generates insufficient recovery time after local muscle fatigue, essential in the genesis of muscle pain in static work.10
The use of laptops and tablets were associated with the outcome, corroborating the findings of a study conducted in China.3 Stationary computers can be positioned on a more comfortable way, for example, the height of the screen, keyboard, chair, and table, adapting the most appropriate posture, while these adjustments are not possible with laptops and tablets. Another important point is the longer time of exposure to inappropriate postures, since the laptops and tablets can be used at any location.3,26
The lying down and semi-lying postures when using cell phone were factors associated with LBP; the first posture described corroborates with the study conducted in China,3 while, in relation to the second, no studies assessing its association with LBP were retrieved. The maintenance of fixed postures for prolonged time reduces the pumping action of the intervertebral disc, reducing the nutrition of this structure. Due to poor mechanical conditions generated by these postures, the fluid from the disc decreases and degenerates gradually, causing abnormal movements among the vertebral bodies, predisposing degeneration and pain. Moreover, these inappropriate postures generate mechanical tension in the muscles, ligaments, and joints.27,28
The clinical category related to mental health problems was associated with LBP in adolescents, corroborating the results of previous studies carried out in Southern Brazil, in Iran, and New Zealand.29,30 The emergence of emotional symptoms is common among students, which may be triggered by the moment lived, pressure in the school environment, economic hardship, and relationship problems. There appears to be an association between emotional symptoms and physical manifestations, such as increased secretion of cortisol and changes in hormonal regulation of adrenal glands, which generates inhibitory effects on the immune response, digestion, and symptoms of excessive wear of the body, tiredness, fatigue, muscle pain, joint disorders, and reduced physical capacity.30
This study had a series of methodological limitations: first, some confounding factors were not controlled, such as the types of tablet used, previous injuries, and exposure to other technologies. Second, no data were collected about how the outcome affected and/or limited their usual activities or caused changes in their daily routine and their relationship with psychosocial factors. Third, the data were based on self-reported responses, which increases the risk of recall bias. The strength of this study is the consistency of results with the literature, the use of validated questionnaires for the studied outcome, and the number of individuals interviewed.
LBP is a common condition that causes substantial disability. Considering that the available data from national surveys on the outcome are scarce in Brazil, this study will serve as a reference to other epidemiological investigations and contribute to the national evaluation of prevalence and risk factors, systematic reviews, and meta-analyzes.
It can be concluded that LBP had high prevalence and important association with the female sex, daily TV use for more than 3h, use of laptop computer, use of the cell phone in the lying down posture, use of the cell phone in semi-lying down posture, daily cell phone use for more than 3h, use of tablet, daily tablet use for more than 3h, and mental health problems.
FundingThis study was supported by funding from the FAPESP (São Paulo Research Foundation).
Conflicts of interestThe authors declare no conflicts of interest.
Please cite this article as: Bento TP, Cornelio GP, Perrucini PO, Simeão SF, Conti MH, de Vitta A. Low back pain in adolescents and association with sociodemographic factors, electronic devices, physical activity and mental health. J Pediatr (Rio J). 2020;96:717–24.


