To evaluate the impact of a nutritional intervention on nutritional status, ultra-processed food consumption, and quality of life of adolescents with excess weight.
MethodsExperimental study with adolescent students with excess weight, divided into two groups, an intervention group and a control group. The nutritional intervention lasted six months, with an educational and motivational approach. Nutritional status (waist circumference and body mass index), quality of life, and ultra-processed food consumption were evaluated before and after the period.
ResultsSixty-two adolescents with overweight or obesity participated in the study, 37 in the intervention group and 25 in the control group, aged 13.2±1.5 years in intervention group, and 13.0±1.8 years in control group, both of which had a higher female participation. There were changes in the body mass index (intervention group Δ: −0.81±2.28, control group Δ: −0.64±1.28) and in the waist circumference for intervention group (Δ:−3.31±5.47). For the pre- and post-ultra-processed food consumption, there was a significant reduction in the consumption of soft drinks in the intervention group (Δ: −0.07 [−0.27 to 0.00]), instant noodles (Δ: −0.03 [−0.07 to 0.00]), and sandwich cookies (Δ: −0.06 [−0.26 to 0.00]). The quality of life increased in the intervention group and decreased in the control group, with no intra- (p=0.162) or intergroup statistical relevance in the pre- (p=0.426) and post- (0.249) intervention period, with a reduction in the emotional domain score, with a significant variation in the intervention group (pre and post; Δ: −19.0±40.6).
ConclusionThere was a decrease in body mass index and waist circumference (central obesity being more often related to insulin resistance), reduction of ultra-processed food consumption (soft drinks, sandwich cookies, and instant noodles), and a tendency toward quality of life improvement (however, there was a decrease in the domains of emotional and school quality of life).
Avaliar o impacto de uma intervenção nutricional no estado nutricional, no consumo de alimentos ultraprocessados e na qualidade de vida de adolescentes com excesso de peso.
MétodosEstudo experimental, realizado com escolares com excesso de peso, que foram divididos em dois grupos, intervenção e controle. A intervenção nutricional durou seis meses, com abordagem educativa e motivacional. Foram avaliados, antes e após o período, estado nutricional (circunferência da cintura e índice de massa corporal), qualidade de vida e consumo de alimentos ultraprocessados.
ResultadosParticiparam 62 adolescentes com sobrepeso ou obesidade, 37 do grupo intervenção e 25 do grupo controle, 13,2±1,5 anos no grupo intervenção e 13,0±1,8 anos no grupo controle, ambos com maior participação do sexo feminino. No índice de massa corporal houve mudanças [grupo intervenção (variação de -0,81±2,28); grupo controle (variação de -0,64±1,28)] e circunferência da cintura para os grupos intervenção (variação de – 3,31±5,47). No consumo de alimentos ultraprocessados pré e pós, houve redução significativa no grupo intervenção do consumo de refrigerante [variação de -0,07 (-0,27 a 0,00)], macarrão instantâneo [variação de -0,03 (-0,07 a 0,00)] e bolacha recheada [variação de -0,06 (-0,26 a 0,00)]. A qualidade de vida aumentou no grupo intervenção e reduziu no grupo controle, sem relevância estatística intra (p=0,162) ou entre grupos pré (p=0,426) e pós (0,249), reduziu a pontuação do domínio emocional, com variação significativa no grupo intervenção (pré e pós) (Δ-19,0±40,6).
ConclusãoObteve-se uma diminuição do índice de massa corporal e circunferência da cintura (obesidade central mais relacionada com resistência insulínica), diminuição de alimentos ultraprocessados (refrigerante, biscoito recheado e macarrão instantâneo), tendência de melhoria da qualidade de vida (contudo, diminuição dos domínios da qualidade de vida emocional e escolar).
The nutritional transition that has been taking place over the last four decades has brought changes to the food pattern of the Brazilian population,1 such as the substitution of in natura or minimally processed foods by ultra-processed foods.2 All of these changes contribute to the increase in the prevalence rates of excess weight and chronic noncommunicable diseases in the general population and, consequently, in adolescence.3,4
Adolescence is a stage of increased risk for weight gain, being characterized by relevant changes in eating behaviors and body composition, and increased sensitivity to insulin.5 This period represents an important window of opportunity for lifestyle interventions aiming to prevent and manage the accumulation of body fat in the long term, and to establish habits that tend to remain throughout life.6,7
In Brazil, data from the National Survey of School Health (Pesquisa Nacional de Saúde do Escolar [PeNSE], 2015) showed that 23.7% of adolescents aged 13 to 17 years had excess weight and 7.8% were obese,8 thus showing the need for interventions in this chronic condition.
Lifestyle interventions during this period can have significant influence on the individual's health. Nutritional and eating education with moderate reduction in energy intake is a strategy to reduce the body mass index (BMI), and when associated with the practice of physical exercises together with the changes in daily habits, can effectively reach all social strata of the population. These strategies also correspond to the main types of non-pharmacological treatment of obesity.9
It appears to be a challenge to encourage the development of nutritional intervention strategies, inserted in the health education field as a method to control the problem at this stage of life, focused on disseminating information about the benefits of certain foods and nutrients and the harm caused by others.10
The aim of this study was to evaluate the impact of a nutritional intervention, performed over a six-month period, on the nutritional status, consumption of processed foods, and quality of life (QoL) of adolescents with excess weight.
MethodsThis was an experimental study featuring adolescent students with overweight or obesity from the municipality of Santa Cruz do Sul, RS, Brazil, carried out from June to November of 2016.
The adolescents were identified from the data collected for the project “School Health – Phase III. Evaluation of biochemical, genetic, hematological, immunological, postural, somatomotor, oral health, risk factors for cardiovascular diseases and lifestyle of schoolchildren: a study in Santa Cruz do Sul-RS,” developed by the Department of Physical Education and Health and the Master's Degree Program in Health Promotion of Universidade de Santa Cruz do Sul (UNISC).
Sample size calculation was performed using the software WinPEPI (WinPEPI, v. 11.43, Programs for Epidemiologists for Windows) and based on the study by Poeta et al. (2013).11 For a significance level of 5%, power of 80%, and an effect size of one standard deviation between the groups regarding the anthropometric and QoL data, predicting 20% losses, a minimum total of 20 adolescents per group was obtained.
For this purpose, the adolescents were invited to participate in an intervention process at UNISC for a period of six months, constituting the intervention group (IG), and those who had no interest or willingness to participate in the IG at that moment constituted the control group (CG). The CG was matched by gender, age, and nutritional status with the IG.
The inclusion criteria were: being in the age range of 10 and 19 years; availability and interest in participating in the project for both the IG and the CG groups; participate in the data collection at all requested moments (over the six-month period), and being able to come to UNISC to participate in the weekly meetings. The exclusion criteria comprised the following: students who were not physically able to undergo the anthropometric assessment, such as wheelchair users, individuals with amputated limbs or limbs in a cast, pregnant adolescents, and students without mental conditions and/or lack of comprehension to complete the questionnaires.
The physical activity, according to the school curriculum, was carried out twice a week; therefore, for the IG, this study added the physical activities proposed in the intervention, three afternoons each week, lasting 90min each.
Initially, a meeting was held with the parents to present the intervention research proposal at UNISC and the team that conducted the activities. The intervention lasted six months, with activities three times a week in the afternoon shift. The IG participated in recreational and sports activities monitored by physical education students and teachers three times a week, one meeting with a psychologist per week, and one-hour nutrition activities once a week, carried out by nutrition students and teachers.
The nutritional intervention involved an educational and motivational approach. The topics of the IG meetings involved aspects related to food and nutrition, aiming at decreasing the consumption of sugars and fats and promoting healthy eating habits. The educational materials were based on the ten steps of healthy eating for adolescents, recommendations for the management of obesity,12 and on the food guide for the Brazilian population.13
Each meeting addressed some topics related to nutrition and health through yarning circles, recreational activities (games and collages), videos, lectures, and cooking workshops. Through these methodologies, the intervention sought to increase the adolescents’ knowledge about food and food products, and possibilities for more adequate substitutions in their daily routines. Also, motivational strategies were used in all the meetings, encouraging the change of eating habits, supporting this initiative and increasing abilities, always focusing on health promotion and reducing the intake of processed foods.
A combination of habit changes was conducted each week with the adolescents according to the theme, and posters with these “combinations” were placed on a large mural for viewing at each meeting.
Anthropometric, food consumption, and QoL assessments were performed before the intervention was started and at the end of the period. For the CG, visits to the school were scheduled for data collection, but the students received no interference or intervention during the study period. All subjects received feedback on their evaluations.
The food behavior questionnaire was applied in the schools. The anthropometric measurements, to characterize nutritional status, were performed at UNISC by a trained team. Data on age, weight (kg), and height (cm) were collected according to the correct calibration techniques proposed by the Food and Nutrition Surveillance System (Sistema de Vigilância Alimentar e Nutricional [SISVAN]).14 Based on these measurements, the BMI was calculated as [weight (kg)/height(m2)]. The adolescents were classified as overweight or obese according to the BMI for age, expressed as a z-score, calculated using the software WHO-Anthro Plus (World Health Organization 2007), and following the recommendations proposed by the World Health Organization (WHO).15
Waist circumference (WC) was measured at midpoint between the last rib and the iliac crest. Then, the cutoff points were applied, which identify cardiovascular risk by the presence of abdominal adiposity, when WC is >90th percentile for age and gender.16
To assess pubertal stage (PS), a self-evaluation questionnaire with illustrative images was applied according to Tanner's criteria (1962),17 at the same moment of the anthropometric evaluation. The adolescent was placed in a private space to avoid embarrassment.
Data collection related to the consumption of processed foods was carried out using the questionnaire completed individually by the student, with prior monitoring and guidance provided by the research team. The tool applied in the study was the semi-quantitative Food Frequency Questionnaire (FFQ), which was used to analyze the usual consumption in the last month, proposed and validated by Sichieri and Everhart.18 This tool was adapted by selecting a list of ten processed foods (instant noodles, frankfurters/sausages, snacks, industrialized fruit juice, soft drinks, cold cuts/bologna, sandwich cookies, plain cookies, sugar, chocolate milk). This adaptation does not influence the questionnaire validation, since only questions related to food groups were excluded.
To identify the QoL, the generic questionnaire Pediatric Quality of Life Inventory (PedsQL 4.0), validated for the Brazilian population, was applied with four subscales, containing 23 items that cover the following domains: (1) physical domain (eight items); (2) emotional domain (five items); (3) social domain (five items); and (4) school domain (five items).19
The analysis of the PesdQL 4.0 responses was performed as follows: they were inversely scored and linearly transposed to a scale of 0–100 (never=0=100 points; almost never=1=75 points; sometimes=2=50 points;very often=3=25 points; almost always=4=0 points); thus, the higher the score, the better the QoL for health.19 A psychosocial summary score was created, which quantifies the psychosocial health of the student through the mean of the sum of the items in the social domain, emotional domain, and school domain. The physical health summary score (eight items) is the same as that of the physical domain scale.
In the presence of missing data, scale scores were computed as the sum of the items divided by the number of answered items. However, when more than 50% of the scale items were absent, the scale score was not recorded. The consistency of this computation is similar to that of another publication arbitrated by Peds QL 4.0 that established QoL.19
Regarding the data analysis, the quantitative variables were described by mean and standard deviation or interquartile range and median. Qualitative variables were described by absolute and relative frequencies. The daily consumption was considered for the consumption of processed foods. Thus, when the consumption was on a weekly or monthly basis, the mean of the frequency range was used and divided by 30 days. Student's t-test for independent samples was applied to compare means between groups. The Mann–Whitney test was used in case of asymmetry. In the comparison of proportions, Pearson's chi-squared or Fisher's exact tests were applied. In intra-group comparisons, Student's t-test for paired samples (symmetric distribution) or the Wilcoxon test (asymmetric distribution) was used. The significance level was set at 5% (p<0.05) and the analyses were performed using the software SPSS (IBM SPSS Statistics for Windows, Version 21.0. NY, United States, v. 21.0).
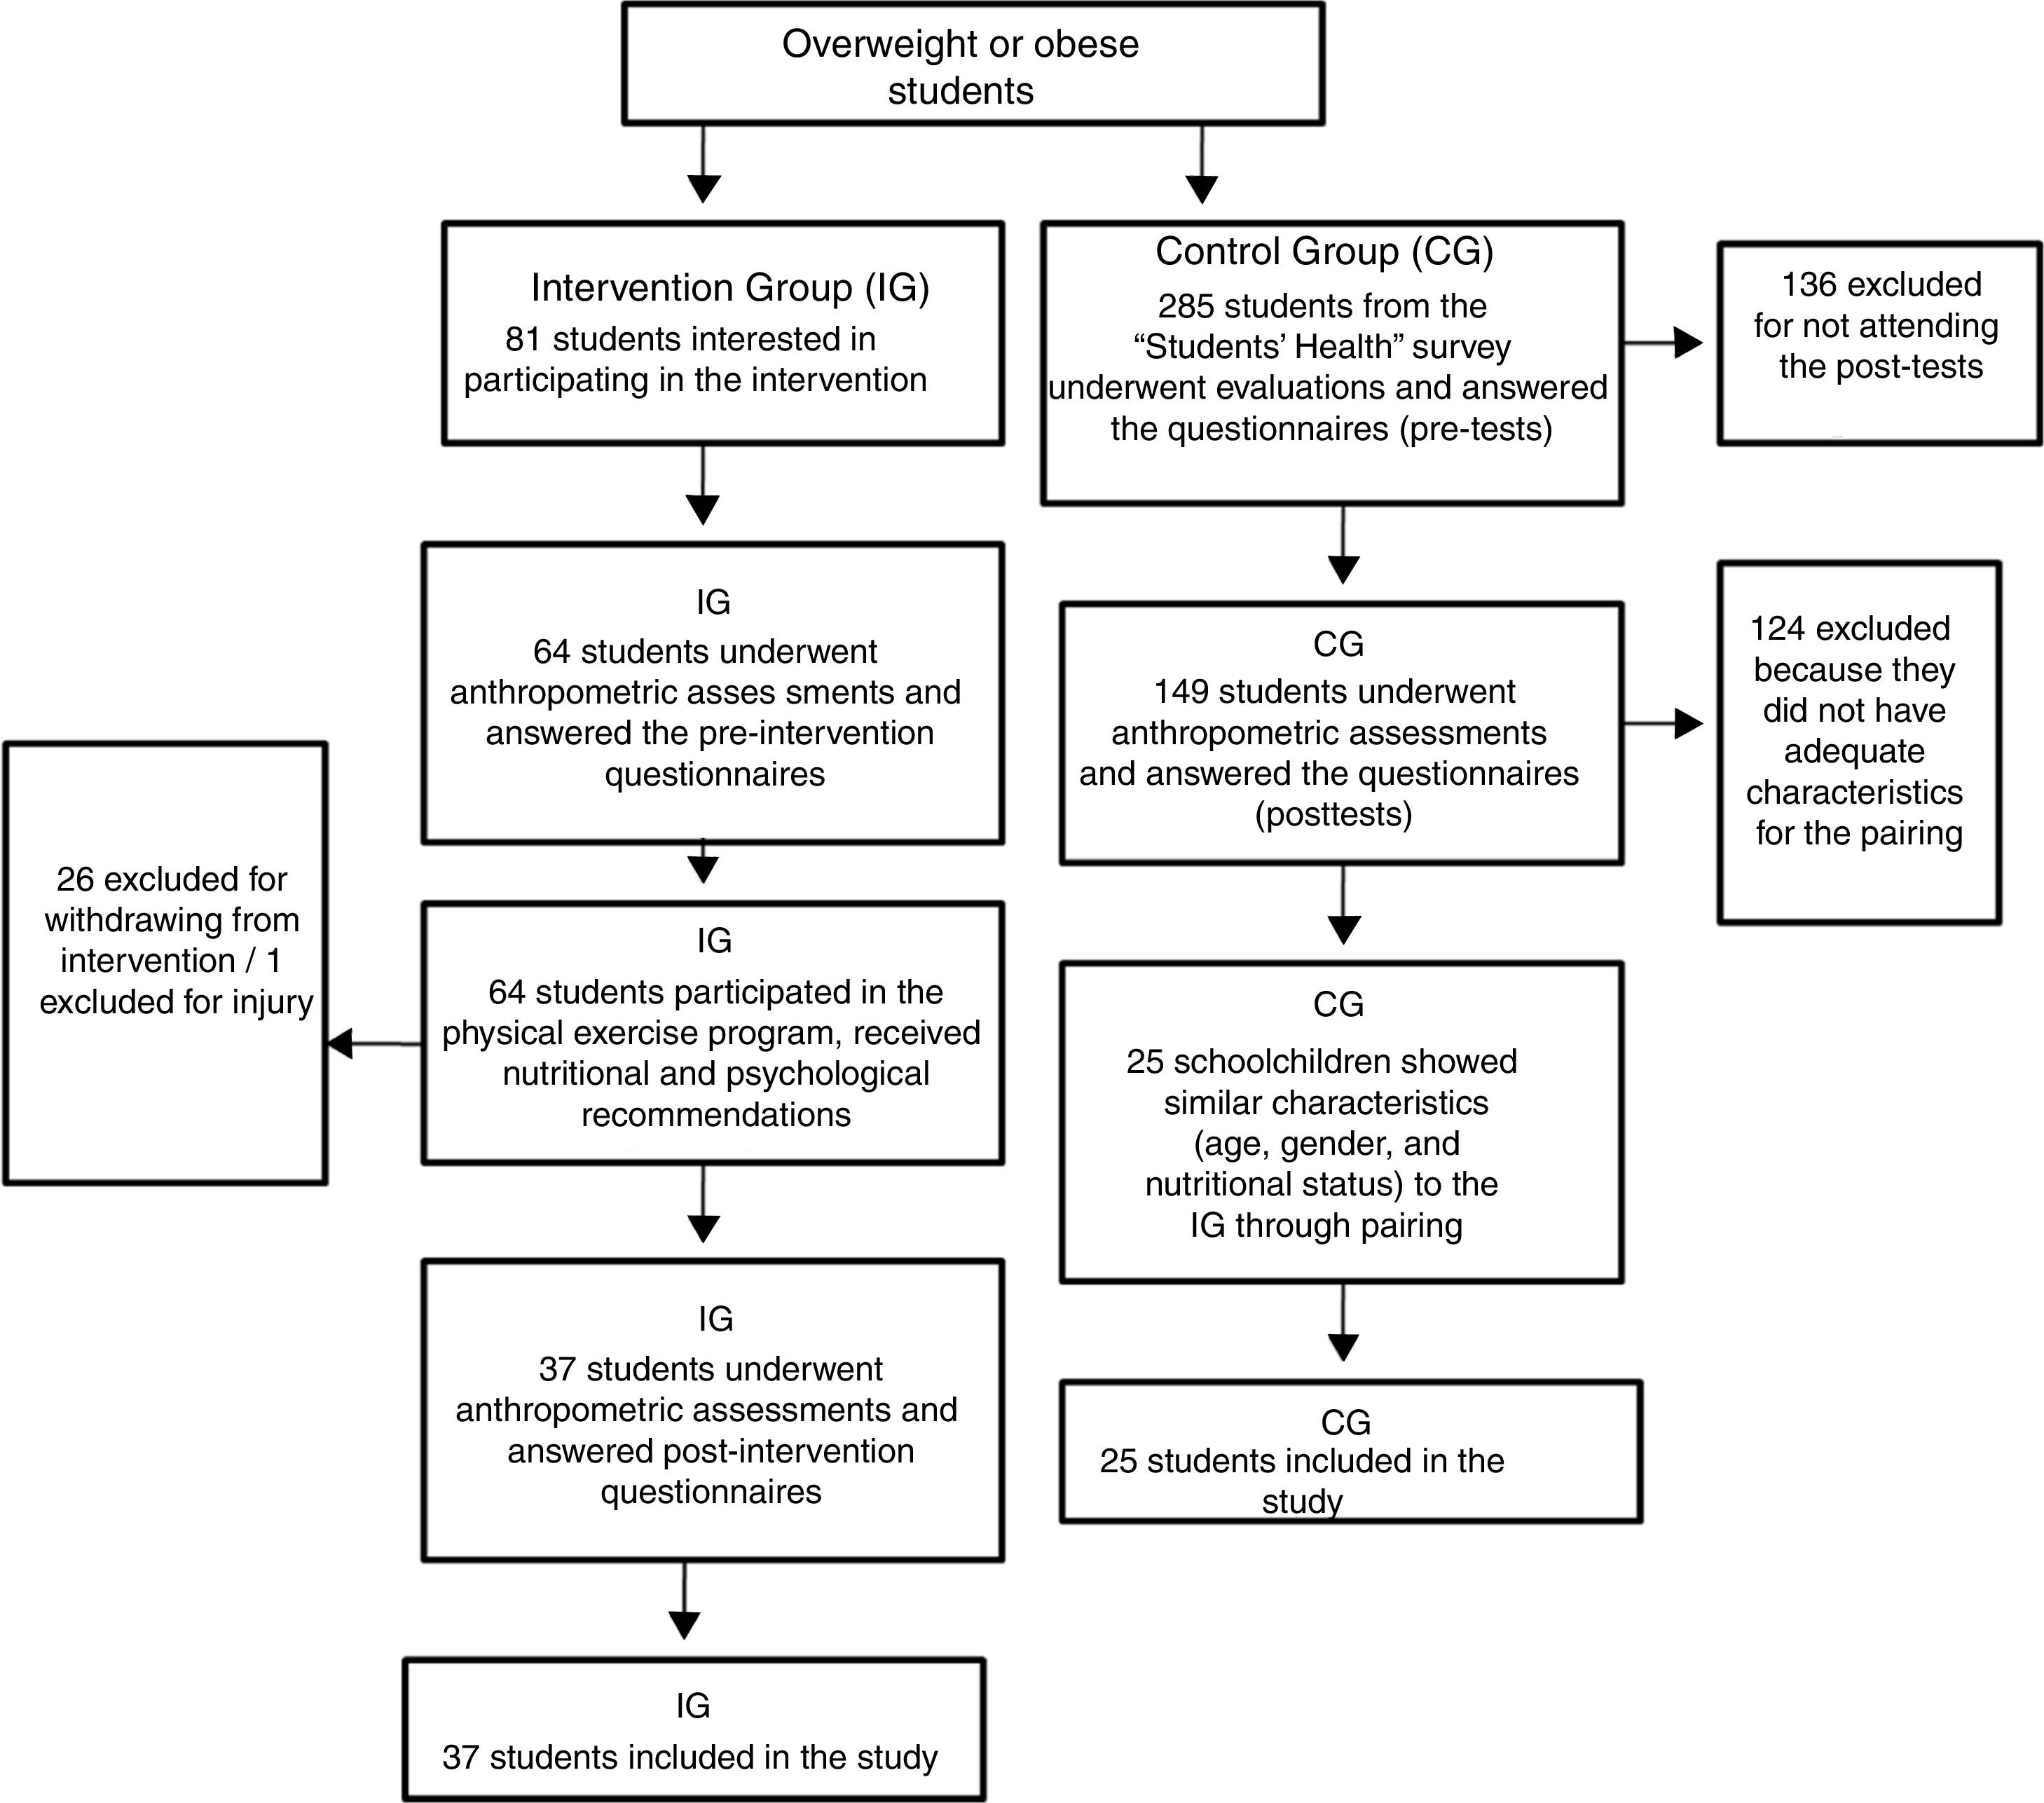
Regarding ethical issues, the study was approved by the Ethics Committee of Universidade Federal do Rio Grande do Sulunder the title “Nutritional approach in a group of adolescents with excess weight: a six-month intervention proposal” under CAAE No.68701317.6.0000.5347 and Opinion No.2,316,157, and followed all the ethical principles recommended in Resolution 466/12 of the National Health Council. The experimental study was registered in Clinical Trials (Protocol ID: 54985316.0.0000.5343). Fig. 1 shows the individuals’ distribution flowchart.
Results
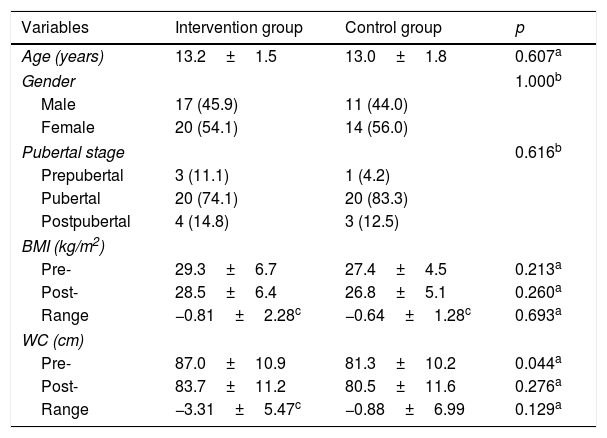
Data were collected from 62 adolescents with over weight or obesity, 37 of whom were included in IG and 25 in the CG. Table 1 shows the characterization of the participants regarding age, PS, and nutritional status. Of the total number of adolescents included in the study, PS was evaluated in 27 adolescents from the IG and 24 from the CG.
Sample characterization.
| Variables | Intervention group | Control group | p |
|---|---|---|---|
| Age (years) | 13.2±1.5 | 13.0±1.8 | 0.607a |
| Gender | 1.000b | ||
| Male | 17 (45.9) | 11 (44.0) | |
| Female | 20 (54.1) | 14 (56.0) | |
| Pubertal stage | 0.616b | ||
| Prepubertal | 3 (11.1) | 1 (4.2) | |
| Pubertal | 20 (74.1) | 20 (83.3) | |
| Postpubertal | 4 (14.8) | 3 (12.5) | |
| BMI (kg/m2) | |||
| Pre- | 29.3±6.7 | 27.4±4.5 | 0.213a |
| Post- | 28.5±6.4 | 26.8±5.1 | 0.260a |
| Range | −0.81±2.28c | −0.64±1.28c | 0.693a |
| WC (cm) | |||
| Pre- | 87.0±10.9 | 81.3±10.2 | 0.044a |
| Post- | 83.7±11.2 | 80.5±11.6 | 0.276a |
| Range | −3.31±5.47c | −0.88±6.99 | 0.129a |
Data expressed as mean±standard deviation for quantitative variables and as absolute frequency (relative frequency) for categorical variables.
p, significance probability value.
BMI, body mass index; WC, waist circumference.
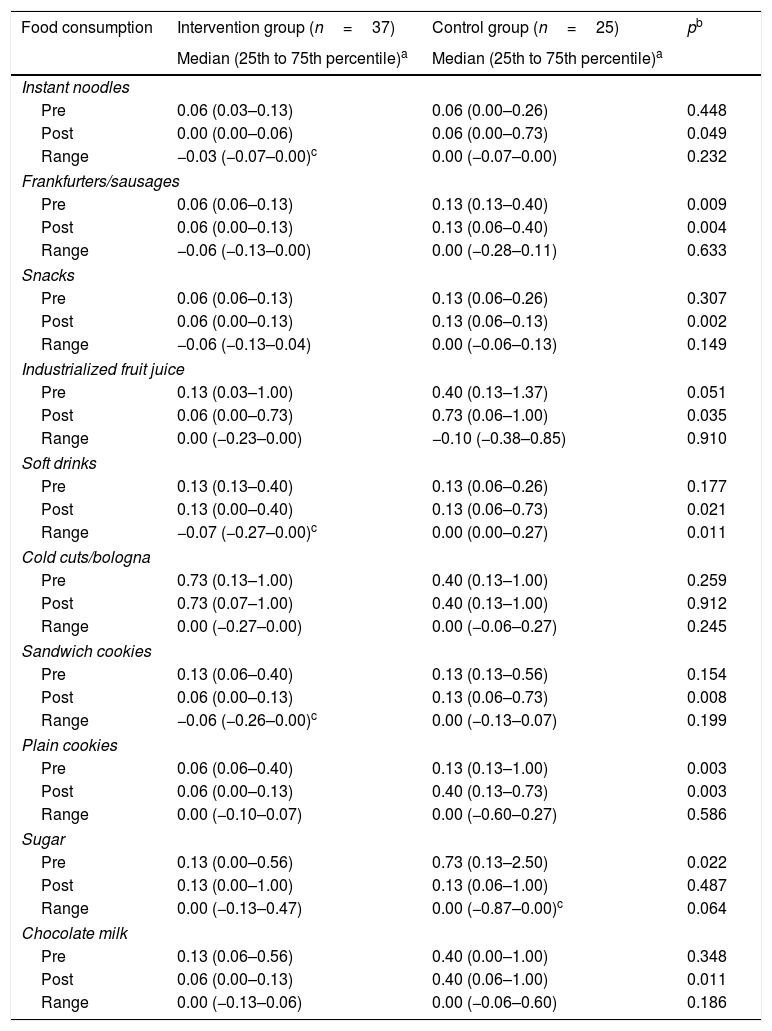
Considering an intragroup analysis, pre- and post-intervention, a significant reduction was observed in the IG regarding the consumption of soft drinks, instant noodles, and sandwich cookies. In the CG there was only a significant variation regarding sugar consumption (Table 2).
Daily frequency of processed food consumption by the adolescents in the intervention and control groups, pre- and post-intervention.
| Food consumption | Intervention group (n=37) | Control group (n=25) | pb |
|---|---|---|---|
| Median (25th to 75th percentile)a | Median (25th to 75th percentile)a | ||
| Instant noodles | |||
| Pre | 0.06 (0.03–0.13) | 0.06 (0.00–0.26) | 0.448 |
| Post | 0.00 (0.00–0.06) | 0.06 (0.00–0.73) | 0.049 |
| Range | −0.03 (−0.07–0.00)c | 0.00 (−0.07–0.00) | 0.232 |
| Frankfurters/sausages | |||
| Pre | 0.06 (0.06–0.13) | 0.13 (0.13–0.40) | 0.009 |
| Post | 0.06 (0.00–0.13) | 0.13 (0.06–0.40) | 0.004 |
| Range | −0.06 (−0.13–0.00) | 0.00 (−0.28–0.11) | 0.633 |
| Snacks | |||
| Pre | 0.06 (0.06–0.13) | 0.13 (0.06–0.26) | 0.307 |
| Post | 0.06 (0.00–0.13) | 0.13 (0.06–0.13) | 0.002 |
| Range | −0.06 (−0.13–0.04) | 0.00 (−0.06–0.13) | 0.149 |
| Industrialized fruit juice | |||
| Pre | 0.13 (0.03–1.00) | 0.40 (0.13–1.37) | 0.051 |
| Post | 0.06 (0.00–0.73) | 0.73 (0.06–1.00) | 0.035 |
| Range | 0.00 (−0.23–0.00) | −0.10 (−0.38–0.85) | 0.910 |
| Soft drinks | |||
| Pre | 0.13 (0.13–0.40) | 0.13 (0.06–0.26) | 0.177 |
| Post | 0.13 (0.00–0.40) | 0.13 (0.06–0.73) | 0.021 |
| Range | −0.07 (−0.27–0.00)c | 0.00 (0.00–0.27) | 0.011 |
| Cold cuts/bologna | |||
| Pre | 0.73 (0.13–1.00) | 0.40 (0.13–1.00) | 0.259 |
| Post | 0.73 (0.07–1.00) | 0.40 (0.13–1.00) | 0.912 |
| Range | 0.00 (−0.27–0.00) | 0.00 (−0.06–0.27) | 0.245 |
| Sandwich cookies | |||
| Pre | 0.13 (0.06–0.40) | 0.13 (0.13–0.56) | 0.154 |
| Post | 0.06 (0.00–0.13) | 0.13 (0.06–0.73) | 0.008 |
| Range | −0.06 (−0.26–0.00)c | 0.00 (−0.13–0.07) | 0.199 |
| Plain cookies | |||
| Pre | 0.06 (0.06–0.40) | 0.13 (0.13–1.00) | 0.003 |
| Post | 0.06 (0.00–0.13) | 0.40 (0.13–0.73) | 0.003 |
| Range | 0.00 (−0.10–0.07) | 0.00 (−0.60–0.27) | 0.586 |
| Sugar | |||
| Pre | 0.13 (0.00–0.56) | 0.73 (0.13–2.50) | 0.022 |
| Post | 0.13 (0.00–1.00) | 0.13 (0.06–1.00) | 0.487 |
| Range | 0.00 (−0.13–0.47) | 0.00 (−0.87–0.00)c | 0.064 |
| Chocolate milk | |||
| Pre | 0.13 (0.06–0.56) | 0.40 (0.00–1.00) | 0.348 |
| Post | 0.06 (0.00–0.13) | 0.40 (0.06–1.00) | 0.011 |
| Range | 0.00 (−0.13–0.06) | 0.00 (−0.06–0.60) | 0.186 |
p, significance probability value.
In the intergroup comparison, a significant variation was observed in the consumption of soft drinks, which allows the conclusion that the IG reduced its consumption more than the CG. Although there was no significant variation after the six-month period, there was a significant reduction in the consumption of instant noodles in the IG. Regarding the consumption of frankfurters/sausages, industrialized fruit juice, snacks, and chocolate milk, a difference was observed in the post-intervention consumption, but without a significant variation (Table 2).
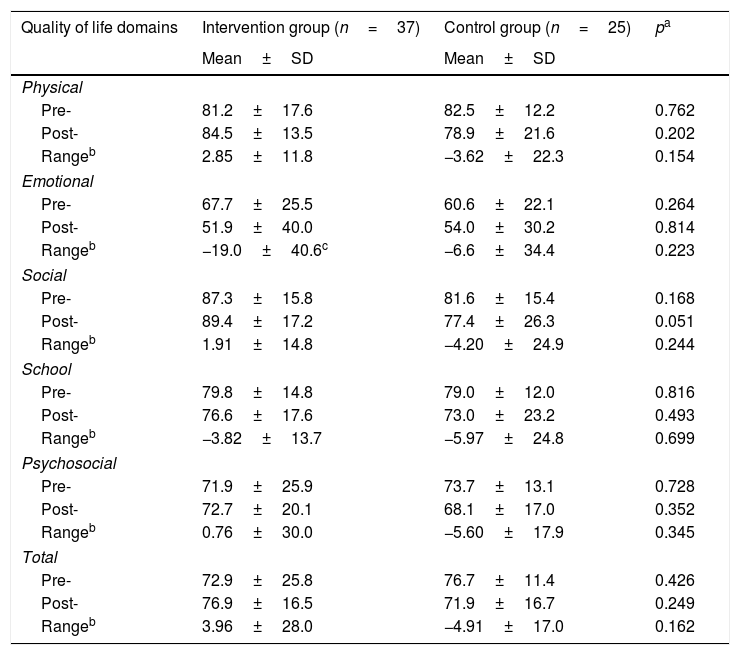
The total QoL score increased in the IG and decreased in the CG, but without statistical significance intra group or intergroup, and a reduction in the emotional domain score was observed, with a significant variation in the IG (pre and post; Table 3).
PedsQL total and subscale scores of the adolescents in the intervention and control groups, pre- and post-intervention.
| Quality of life domains | Intervention group (n=37) | Control group (n=25) | pa |
|---|---|---|---|
| Mean±SD | Mean±SD | ||
| Physical | |||
| Pre- | 81.2±17.6 | 82.5±12.2 | 0.762 |
| Post- | 84.5±13.5 | 78.9±21.6 | 0.202 |
| Rangeb | 2.85±11.8 | −3.62±22.3 | 0.154 |
| Emotional | |||
| Pre- | 67.7±25.5 | 60.6±22.1 | 0.264 |
| Post- | 51.9±40.0 | 54.0±30.2 | 0.814 |
| Rangeb | −19.0±40.6c | −6.6±34.4 | 0.223 |
| Social | |||
| Pre- | 87.3±15.8 | 81.6±15.4 | 0.168 |
| Post- | 89.4±17.2 | 77.4±26.3 | 0.051 |
| Rangeb | 1.91±14.8 | −4.20±24.9 | 0.244 |
| School | |||
| Pre- | 79.8±14.8 | 79.0±12.0 | 0.816 |
| Post- | 76.6±17.6 | 73.0±23.2 | 0.493 |
| Rangeb | −3.82±13.7 | −5.97±24.8 | 0.699 |
| Psychosocial | |||
| Pre- | 71.9±25.9 | 73.7±13.1 | 0.728 |
| Post- | 72.7±20.1 | 68.1±17.0 | 0.352 |
| Rangeb | 0.76±30.0 | −5.60±17.9 | 0.345 |
| Total | |||
| Pre- | 72.9±25.8 | 76.7±11.4 | 0.426 |
| Post- | 76.9±16.5 | 71.9±16.7 | 0.249 |
| Rangeb | 3.96±28.0 | −4.91±17.0 | 0.162 |
Data expressed as mean±standard deviation for quantitative variables.
p, significance probability value.
This study aimed to identify changes in anthropometric parameters, processed food consumption, and QoL score of overweight or obese adolescents, through a six-month nutritional intervention process. The results after this process were: reduction in BMI and WC (central obesity more often related to insulin resistance), reduction in the consumption of ultra-processed foods (soft drinks, sandwich cookies, and instant noodles), and a tendency to improve QoL (however, with a decrease in the emotional and school QoL domains), thus resulting in a biopsychosocial improvement of adolescents with overweight and obesity.
As a positive aspect of this study, there was a statistically significant variation with a reduction in BMI and WC between the pre- and post-intervention periods for the IG. These findings corroborate those of several studies (30–37). This result was positive, since the reduction in BMI and WC in overweight and obese adolescents through lifestyle-based interventions can determine weight maintenance or loss and improve cardiometabolic risk factors.20
Regarding the consumption of processed foods, the change in soft drink consumption showed an ideal spectrum for an intervention study, since the groups did not show any differences regarding the pre- and post-intervention periods, as well as difference in the variation; however, when comparing the intragroup changes, a difference was obtained only in the intervention. The consumption of sandwich cookies and instant noodles followed similar patterns of change, with a significant reduction in consumption and a difference after the intervention period (Table 2). These findings are similar to other interventional studies that indicate, in most cases, a reduction in the consumption of caloric, sugary foods and snacks after a period of nutritional intervention with different approach strategies. In 2012, DeBar et al. reported a weekly reduction in fast food consumption in the IG when comparing the pre- and post-intervention periods (1.17 [1.06] to 1.18 [1.32]) and in the CG (1.27 [1.12] and 1.08 [1.17]) (p=0.021).21 Also, the consumption of sugary and soft drinks by the IG reduced from 1.10 (1.43) to 0.92 (0.89) after six months, and in the CG, from 1.48 (1.68) to 1.09 (1.16) (p=0.252).21 Another study reported significant reductions in the frequency of fast food consumption for both groups (p=0.03) and of soft drinks for the IG (p=0.04),22 and observed that the individuals consumed less high-calorie foods (3.9±1.9 to 3.0±1.5servings/day, p=0.01) and snacks (9.7±5.5 to 6.8±4.0servings/day, p=0.02) at the end of the period.
In the CG, there was only a significant variation regarding sugar consumption. This fact may be associated to the higher initial consumption frequency by the CG, which was practically daily for these adolescents.
In the present study, the total QoL score, assessed by PedsQL 4.0, increased and was higher in the IG between the beginning and the end of the intervention. The CG, at the start of the period, showed better levels, but in the end there was a reduction in the QoL score, although without statistically significant differences. In another intervention study, the initial QoL in the IG, also assessed by PedsQL 4.0, was 71.12 (16.22) and 77.63 (13.54) in the post-intervention, similar to the present study.21
However, a significant reduction in the emotional score in the IG was observed, from 67.7±25.5 to 51.9±40.0, which represents a negative result. Authors often report that the emotional score is the lowest subscale score of PedsQL 4.0 in overweight or obese students. Therefore, it is pointed out that obesity may be a determining factor for QoL decline, especially in the emotional domain.23–25 Another study performed by the present research group also showed that the most affected domain among overweight or obese students was the emotional one.26 In a recent clinical trial similar to the present study, the intervention group (adolescents receiving conventional, directive counseling, providing information, instructions, and advice, without active discussion) attained a decrease in the emotional and social scores. However, the motivational intervention group achieved an increase in the emotional subscale.27 What may have occurred in the present study is that in the meetings, professionals may have carried out nutritional counseling in a more conventional way. Thus, the need to apply the principles of motivational interviewing by trained professionals must be emphasized.
Lower emotional domains constitute a matter of concern, especially when they are associated to excess weight in the young population, since a recent review study shows that food consumption motivated by emotional states is associated with the development and maintenance of excess weight.28
The present study showed a decrease in the school domain score in both groups (Table 3). This is a matter of concern, since childhood obesity can be associated to poor school performance. Authors have concluded that overweight or obese children are four times more likely to report problems at school than their peers with healthy weight.29 This may also be related to the fact that they are more likely to miss classes, especially when they have chronic health conditions, such as diabetes and asthma, which can also affect academic performance.30
This study is important, as it demonstrates the positive results of an intervention process in adolescents with excess weight, which allowed, based on a cross-sectional study, the possibility of treatment and counseling to adolescent students in the municipality, a pioneering activity in the region. However, it must be emphasized that nutritional interventions should not be restricted to individuals with excess weight and/or obesity, and need to include the entire population, regardless of the nutritional status, for the purpose of prevention, given the complexity of obesity treatment.
As limitations, the authors emphasize the small sample size, although the sample-size calculation was achieved, as well as the lack of a longer follow-up period to verify the results in the medium or long term, since obesity is a chronic condition.
The nutritional intervention with an educational and motivational approach resulted in a decrease in BMI and WC (central obesity being more often related to insulin resistance), reduction of ultra-processed food consumption (soft drinks, sandwich cookies, and instant noodles), and a tendency toward QoL improvement (however, with a decrease in the emotional and school QoL domains).
Conflicts of interestThe authors declare no conflicts of interest.
Please cite this article as: Poll FA, Miraglia F, D’avila HF, Reuter CP, Mello ED. Impact of intervention on nutritional status, consumption of processed foods, and quality of life of adolescents with excess weight. J Pediatr (Rio J). 2020;96:621–9.


