to identify the dietary patterns of adolescents attending public municipal schools in Northern Minas Gerais, Brazil, and to test the association between these patterns and socioeconomic variables and nutritional status of the adolescents.
Methodsthis was an analytical, cross-sectional study with randomized sample of 474 adolescents of both genders, between 11 and 17 years of age, attending municipal public schools in the urban area of Montes Claros, MG, Brazil. The parents provided demographic and economic data. The nutritional status (body mass index - BMI) of the adolescents was determined at school, and their dietary habits were assessed though the administration of the Food Frequency Questionnaire for Adolescents (FFQA). Based on 26 categories extracted from FFQA, dietary patterns were determined using principal component analysis (PCA) and associated to anthropometric and socioeconomic factors using multiple regression analysis.
Resultsthe three dietary patterns identified, “junk food,” “healthy,” and “traditional”, explained 23.26%, 6.90%, and 5.24% of data variability, respectively. Adolescents with per capita family income exceeding half a minimum wage were more likely to consume the “junk food” pattern (OR=1.66; 95% CI=1.07-2.56), and overweight adolescents had lower chances of eating the “healthy” food pattern (OR=0.56, 95% CI=0.35-0.91).
Conclusionsdeviations from the “healthy” patterns were not associated to low income, but rather to bad eating habits in the studied population. Overweight adolescents did not adhere to the “healthy” dietary pattern, emphasizing the need for nutritional education among them.
identificar os padrões de consumo alimentar de adolescentes de escolas públicas do norte de Minas Gerais e testar a associação desses padrões com variáveis socioeconômicas e estado nutricional.
Métodosestudo analítico e transversal com amostra aleatória de 474 adolescentes de ambos os sexos, 11 a 17 anos de idade, matriculados do 6° ao 9° ano de escolas públicas municipais da zona urbana de Montes Claros, MG. Os pais forneceram informações demográficas e econômicas. Nas escolas, avaliou-se o estado nutricional dos adolescentes (índice de massa corporal - IMC) e investigou-se seus hábitos alimentares aplicando-se um Questionário de Frequência Alimentar para Adolescentes (QFAA). Com base em 26 categorias de alimentos extraídas do QFAA, aplicou-se uma análise fatorial de componentes principais (ACP) para identificar os padrões alimentares, que foram associados a fatores antropométricos e socioeconômicos por análise de regressão múltipla.
Resultadosos três padrões alimentares identificados, “junk food”, “saudável” e “tradicional”, explicaram 23,26%, 6,90% e 5,24% da variabilidade dos dados, respectivamente. Adolescentes com renda familiar per capita superior a 1/2 salário mínimo apresentaram maior chance de aderir ao padrão “junk food” (OR=1,66; IC 95%=1,07-2,56), enquanto aqueles com excesso de peso possuíram menor chance de aderir ao padrão “saudável” (OR=0,56; IC 95%=0,35-0,91).
Conclusõesdesvios do padrão alimentar “saudável” não estão relacionados à baixa renda, mas sim aos maus hábitos alimentares da população estudada. Adolescentes com sobrepeso não aderiram ao padrão “saudável”, reforçando a necessidade da implementação de educação nutricional junto aos mesmos.
The eating habits of adolescents are of concern for public health, as there is a direct association between inadequate diet during this phase and the occurrence of obesity and other chronic diseases in adulthood.1 Exacerbating this scenario, the prevalence of obesity and related diseases has significantly increased worldwide.2,3
It is common for adolescents to substitute main meals with high-calorie snacks or to skip important meals such as breakfast. In addition, they consume many foods with a high content of sugar, refined carbohydrates and saturated fats, and do not consume enough fruit and vegetables; they are also prone to adopting monotonous diets or food fads.4
Following a trend shown in studies in the nutrition area, the association between adolescents’ diet and health should not consider the presence or absence of a particular nutrient, but the group of consumed foods, considering the type, amount, and proportions. In fact, the evaluation of food groups better reflects the dietary habits of a given population,5 and expresses the actual situation of food availability and the differentiated conditions of inclusion of the populations in varying social scenarios.6 In addition, food consumption patterns can be used as a prognostic factor in the association between diet and chronic disease risk, especially when they are associated with dietary characteristics.5
Dietary patterns can be determined by principal component analysis (PCA), which is a statistical method for reducing and/or aggregating elements to identify factors that may influence eating habits.7
However, although the identification of these factors is necessary to support dietary interventions, there have been few studies with these characteristics aimed at adolescents.8 To fill this gap, and considering the importance of knowing the dietary pattern of specific communities, the aim of this study was to apply PCA to identify food consumption patterns of adolescents from public schools in Northern Minas Gerais, Brazil, and to test their association with socioeconomic and nutritional status variables. It should be noted that the study is regionally relevant, as obesity problems have been detected in this population.9
MethodsThe analytical cross-sectional study was performed in the second half of 2011 with adolescents of both genders, aged between 11 and 17 years, and enrolled in 6th to 9th grade in public schools of the urban area of the city of Montes Claros, state of Minas Gerais, Brazil. The rural area was not considered due to logistic reasons and because it encompasses less than 3% of students in the public school network.
Participants were selected by random cluster sampling. The sample size of 474 individuals was performed using Epi Info, release 3.5.1 statistical analysis software and based on the total number of students in the population studied. Obesity prevalence of 20% (based on studies with Brazilian adolescents),10 a confidence level of 95%, a 5% sampling error, and a correction factor for the sampling design (“deff”) of 2 were also considered for the sample calculation.
The sample was randomly chosen according to the cluster sampling technique and performed in two stages. In the first stage, the selection of schools was performed by applying the method of selection with probability proportional to size. In the second stage, the groups were selected by simple random sampling, by interviewing all students in selected classes to obtain a sample in excess of the calculated sample size.
Initially, adolescents were informed of the study and asked verbally for their consent to participate. Those who agreed to participate were given an informed consent form to be signed by parents or guardians, which included a brief explanation of the research objectives and methodology, as well as the assurance that there would be no identification of participants. The study was approved by the Ethics Committee of the Universidade Estadual de Montes Claros, process No. 3016/2011.
A form completed by the parents or guardians was used to collect sociodemographic data (gender, age, socioeconomic status, and parental education) of the participants. The assessment of income was based on the Brazilian Association of Research Companies (Associação Brasileira das Empresas de Pesquisa - ABEP) form,11 which estimates the purchasing power of urban households through a score consisting of the sum of points related to property ownership and educational level of the head of the household. Considering the per capita income related to the month before the interview, subjects were classified as income < half a minimum wage or > half a minimum wage.
To determine the nutritional status of adolescents, anthropometric measurements of weight and height were measured in duplicate using techniques standardized by the Food and Nutrition Surveillance System (Sistema de Vigilância Alimentar e Nutricional - Sisvan), in accordance with the World Health Organization (WHO) guidelines.12 Based on the body mass index (BMI) obtained in Z-scores, the nutritional status of adolescents was assessed, using the WHO proposal for children and adolescents aged 5-19 years as reference.13 For the purposes of analysis, the overweight and obese categories were combined.
The usual food intake assessment was performed by applying the Food Frequency Questionnaire for Adolescents (FFQA).14 This is a semiquantitative tool that provides seven consumption choices for 94 foods: never; less than once per month; one to three times per month; once per week, two to four times per week, once per day; two or more times per day. The questionnaire was completed by the adolescents themselves.
To identify the dietary patterns by principal components factor analysis (PCA), the 94 food items from the food frequency questionnaire were grouped into 26 categories according to the similarity of nutritional content,15 as follows: 1) rice and tuberous roots; 2) pasta; 3) cooked beans; 4) red meat; 5) white meat; 6) eggs 7) whole dairy foods; 8) skim dairy foods; 9) margarine and butter; 10) breads; 11) cereals; 12) powdered chocolate milk; 13) sweets and desserts; 14) sugar; 15) filled biscuits; 16) processed meats; 17) leafy greens; 18) legumes; 19) fruit; 20) carbonated beverages; 21) natural juices; 22) artificial juices; 23) coffee and tea; 24) fatty foods; 25) sweet foods; 26) mayonnaise and salads with mayonnaise.
The frequency of consumption of foods or food groups was summarized by a single value for each adolescent, according to the methodology established by the literature.16,17 Dietary patterns were shown as a discrete variable, which was obtained by the sum of the frequencies of consumption of foods contained in each dietary pattern.
Before applying the PCA, sample size was verified regarding its adequacy, since for the identification of dietary patterns it is recommended that the number of individuals be equal to or greater than five for each food/food group of the FFQA.18 In this study, 26 food groups were identified, so it would be necessary to have 130 individuals (26 x 5 groups), which was met by the sampling. The analysis of the Kaiser-Meyer-Olkin coefficient (KMO=0.888) and Bartlett's test of sphericity (χ2 (325)=3089.22, p < 0.01) was also performed before the data were analyzed by PCA followed by Varimax orthogonal rotation to identify dietary patterns.
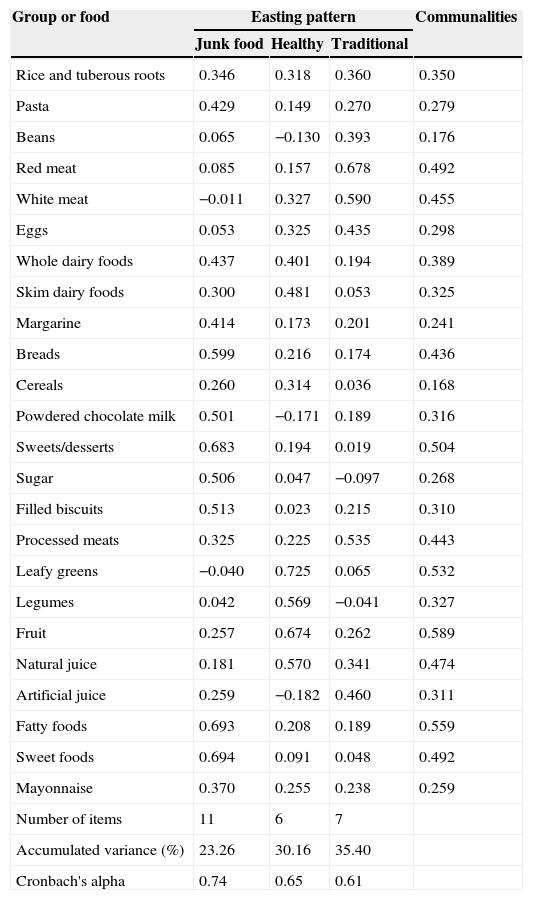
Then, the fitness of each variable was verified through the anti-image correlation matrix (determinant of the correlation matrix=0.003; determinant of the anti-image correlation matrix=> 0.50).19 To assess the exploratory factorial structure of the FFQA, factorial loads greater than 0.30 (Table 1) were considered. The number of factors to be extracted was defined according to the screen plot graph.
Distribution of factorial loads of dietary patterns of adolescents. Montes Claros – MG.
| Group or food | Easting pattern | Communalities | ||
|---|---|---|---|---|
| Junk food | Healthy | Traditional | ||
| Rice and tuberous roots | 0.346 | 0.318 | 0.360 | 0.350 |
| Pasta | 0.429 | 0.149 | 0.270 | 0.279 |
| Beans | 0.065 | −0.130 | 0.393 | 0.176 |
| Red meat | 0.085 | 0.157 | 0.678 | 0.492 |
| White meat | −0.011 | 0.327 | 0.590 | 0.455 |
| Eggs | 0.053 | 0.325 | 0.435 | 0.298 |
| Whole dairy foods | 0.437 | 0.401 | 0.194 | 0.389 |
| Skim dairy foods | 0.300 | 0.481 | 0.053 | 0.325 |
| Margarine | 0.414 | 0.173 | 0.201 | 0.241 |
| Breads | 0.599 | 0.216 | 0.174 | 0.436 |
| Cereals | 0.260 | 0.314 | 0.036 | 0.168 |
| Powdered chocolate milk | 0.501 | −0.171 | 0.189 | 0.316 |
| Sweets/desserts | 0.683 | 0.194 | 0.019 | 0.504 |
| Sugar | 0.506 | 0.047 | −0.097 | 0.268 |
| Filled biscuits | 0.513 | 0.023 | 0.215 | 0.310 |
| Processed meats | 0.325 | 0.225 | 0.535 | 0.443 |
| Leafy greens | −0.040 | 0.725 | 0.065 | 0.532 |
| Legumes | 0.042 | 0.569 | −0.041 | 0.327 |
| Fruit | 0.257 | 0.674 | 0.262 | 0.589 |
| Natural juice | 0.181 | 0.570 | 0.341 | 0.474 |
| Artificial juice | 0.259 | −0.182 | 0.460 | 0.311 |
| Fatty foods | 0.693 | 0.208 | 0.189 | 0.559 |
| Sweet foods | 0.694 | 0.091 | 0.048 | 0.492 |
| Mayonnaise | 0.370 | 0.255 | 0.238 | 0.259 |
| Number of items | 11 | 6 | 7 | |
| Accumulated variance (%) | 23.26 | 30.16 | 35.40 | |
| Cronbach's alpha | 0.74 | 0.65 | 0.61 | |
Three factors (dietary patterns) were identified, called “junk food,” “healthy,” and “traditional” according to the terminology used in other studies.7,17 Cronbach's alpha indices19 (≥ 0.6) demonstrated that for, all three patterns, an acceptable level of accuracy of measurement was guaranteed, thereby confirming the internal consistency of the FFQA used in the study.
The three dietary patterns were categorized into a dichotomous variable (0 and 1), using the high (1) and low consumption (0) category for values above or below the median, respectively. This allowed each subject to be positioned, according to their score, at a particular classification in each of the identified patterns.7,15
The association between dietary patterns and independent factors was assessed by odds ratio (OR), estimated by the logistic regression model. For the multivariate analysis, the variables tested were those that showed p<0.20, and those that could explain some behavior, according to theoretical references. The final model included those variables that showed a statistical significance of up to 5% (p<0.05). The data were analyzed using the Statistical Package for Social Sciences (SPSS), release 15.0.
ResultsA total of 535 adolescents were included in the study, distributed in 25 classes in 16 schools from all areas of the city. Incomplete questionnaires and those who reported extreme calorie consumption were excluded.
Of the 535 students who participated in the study, 68% were females and 32% males, 52.3% were aged between 11 and 13 years of age, and 47.7% were 14 years or older. In the nutritional status assessment, it was observed that the proportion of overweight and obesity (in relation to normal weight and underweight) was 19.5% in females and 16.4% in males.
When analyzing the participants’ socioeconomic status (per capita), 19.1% had an income lower than half the minimum wage and 80.9% earned half the minimum wage or more. In general, parents had low educational level and only 37.9% of the heads of the households had finished elementary school.
Of the 26 food items tested, 24 were valid and had saturation values higher than 0.30 (Table 1). Foods with a low correlation factorial loading (carbonated beverages and coffee) were eliminated. The three dietary patterns resulting from the PCA explained 35.4% of the total variability of data. The “junk food” pattern explained 23.26% of the total variability, representing the high consumption of pasta, whole dairy products, margarine, breads, chocolate milk powder, sweets and desserts, sugar, filled biscuits, fatty foods, sweet foods, and mayonnaise. The “healthy” pattern explained 6.90% of the variability, characterized by significant consumption of skim dairy products, cereals, leafy vegetables, fruits, and natural juices. Finally, the “Traditional” pattern corresponded to 5.24% of the variability, indicating a high consumption of rice, tuberous roots, beans, red and white meat, eggs, processed meats, and artificial juices.
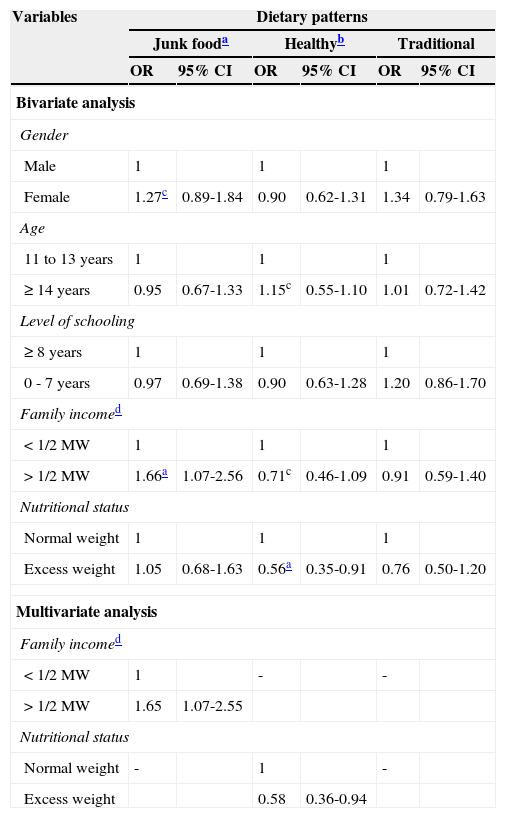
Table 2 shows the results of the bivariate and multivariate regression analysis of factors associated with dietary patterns. The bivariate regression analysis indicated that adolescents with per capita family income higher than half a minimum wage were more likely to consume foods of the “junk food” pattern (OR=1.66, 95% CI=1.07 to 2.56), whereas overweight adolescents were less likely to consume food of the “healthy” pattern (OR=0.56, 95% CI=0.35 to 0.91). After adjusting the data to the logistic regression model, these variables still remained significant (p<0.05), with explanatory power similar to that of previous analysis.
Analysis of crude and adjusted associations (odds ratios) and respective confidence intervals between variables associated with different dietary patterns of adolescents. Montes Claros – MG.
| Variables | Dietary patterns | |||||
|---|---|---|---|---|---|---|
| Junk fooda | Healthyb | Traditional | ||||
| OR | 95% CI | OR | 95% CI | OR | 95% CI | |
| Bivariate analysis | ||||||
| Gender | ||||||
| Male | 1 | 1 | 1 | |||
| Female | 1.27c | 0.89-1.84 | 0.90 | 0.62-1.31 | 1.34 | 0.79-1.63 |
| Age | ||||||
| 11 to 13 years | 1 | 1 | 1 | |||
| ≥ 14 years | 0.95 | 0.67-1.33 | 1.15c | 0.55-1.10 | 1.01 | 0.72-1.42 |
| Level of schooling | ||||||
| ≥ 8 years | 1 | 1 | 1 | |||
| 0 - 7 years | 0.97 | 0.69-1.38 | 0.90 | 0.63-1.28 | 1.20 | 0.86-1.70 |
| Family incomed | ||||||
| < 1/2 MW | 1 | 1 | 1 | |||
| > 1/2 MW | 1.66a | 1.07-2.56 | 0.71c | 0.46-1.09 | 0.91 | 0.59-1.40 |
| Nutritional status | ||||||
| Normal weight | 1 | 1 | 1 | |||
| Excess weight | 1.05 | 0.68-1.63 | 0.56a | 0.35-0.91 | 0.76 | 0.50-1.20 |
| Multivariate analysis | ||||||
| Family incomed | ||||||
| < 1/2 MW | 1 | - | - | |||
| > 1/2 MW | 1.65 | 1.07-2.55 | ||||
| Nutritional status | ||||||
| Normal weight | - | 1 | - | |||
| Excess weight | 0.58 | 0.36-0.94 | ||||
MW, minimum wage; OR, odds ratio; 95% CI, 95% confidence interval.
Multiple analysis:
This study identified, by applying the principal component analysis (PCA), three dietary patterns among the adolescents: “junk food,” “healthy,” and “traditional.” It also showed that the consumption of low nutritional quality foods was positively associated with family income, and that overweight adolescents usually do not consume foods from the “healthy” pattern.
Dietary patterns can vary depending on cultural, geographic, and economic habits. Thus, although different studies consider a dietary pattern with the same name, e.g., “Western diet”,4,20 it does not mean that the food items this pattern represents in each context are the same. In the present study, the terminology used for the dietary patterns was based on Brazilian studies.
The study by Salvatti et al.7 identified, in adolescents from a public school in the city of São Paulo, the “traditional,” “urban,” “healthy,” and “junk food” patterns.7 In another study based on obese adolescents, Dishchekenian et al.21 classified the patterns as “traditional,” “in transition,” and “fast food.” It should be emphasized, however, that the type of foods grouped in each category is specific for each study.
The “traditional” dietary pattern corresponded to foods found in the staple diet of Brazilians, and is similar to the “traditional” pattern reported in other studies.7,17,21 In the present study, this pattern included the consumption of processed meats and artificial juices, which may indicate a trend toward the inclusion of new items in the staple diet of the Brazilian population. The Household Budget Survey (HBS) conducted in 2008-200922 confirms the increased consumption of these, often due to their convenience and low cost.
The foods that constitute the “healthy” dietary pattern are rich in vitamins, minerals, and fiber, which are considered protective against nontransmissible chronic diseases.23 This dietary pattern also includes skim dairy products, which have a low percentage of fat. The low consumption of these foods by adolescents has piqued the interest of researchers.24 In the present study, the “healthy” dietary pattern was associated with the normal weight nutritional status (Table 1), corroborating other studies.7,25,26 However, it is worth mentioning that, in some studies, the “healthy” dietary pattern was associated with the obesity profile; the possible association of this result with the success of healthy eating programs in that region should be considered.7
The “junk food” pattern was characterized by the excessive intake of high-energy foods, high in sugars, saturated fats, and trans-fats. This dietary pattern, commonly identified in such studies,7,17,21 reflects some of the worst eating habits of adolescents.27 It is similar to the “fast food” pattern, which can lead to lipid abnormalities, hyperinsulinemia, and hypertension.21 In the present study, the “junk food” pattern was positively associated with higher socioeconomic level of the adolescents, possibly because those from families with higher incomes have more access to such products.28
The present study was conducted with students from public schools in Montes Claros, a municipality that has a mean HDI below the national mean (0.783 in 2009/2010). Although this community has limited resources,29 the data indicate that deviations from healthy eating habits are not associated with socioeconomic status, but with the adolescents’ bad eating habits. They also indicate that overweight adolescents do not adhere to the “healthy” dietary pattern. These results suggest the need for consolidation and expansion of actions to promote healthy eating habits among the young population, especially for the maintenance of healthy habits in adulthood, as well as reduced risk of chronic diseases and obesity.30
FundingCAPES grant to Lucinéia de Pinho.
Conflicts of interestThe authors declare no conflicts of interest.
The authors would like to thank the Coordenação de Aperfeiçoamento de Pessoal de Nível Superior (CAPES) for financial support, and the City Hall of Montes Claros, for their logistic support.
Please cite this article as: de Pinho L, Silveira MF, Botelho AC, Caldeira AP. Identification of dietary patterns of adolescents attending public schools. J Pediatr (Rio J). 2014;90:267–72.
Study performed at Post-Graduation Program in Health Sciences, Universidade Estadual de Montes Claros (Unimontes), Montes Claros, MG, Brazil.
articles


