To evaluate food intake according to the degree of processing, stratified by family income and age, in a representative sample of children younger than 6 years in the city of Pelotas, RS, Brazil.
MethodsCross-sectional population-based study carried out with 770 children aged 0–72 months of age living in the urban area of Pelotas. The dietary intake of children was assessed by 24-h recall administered to mothers or guardians. The energy intake was estimated and each food item was classified according to the food processing degree. Food consumption was stratified by age (younger than 24 months; 24 months or older) and associations between quintiles of family income and relative contribution of each food to total energy were performed by linear regression. The Wald test was applied to test linear trend across groups.
ResultsThe mean energy intake was 1725.7kcal/day. The mean contribution of processed and ultraprocessed foods was 19.7% among children younger than 24 months and 37% in those aged 24 months or older, while the mean consumption of natural and minimally processed food was 61% and 44%, respectively. Among children aged 24 months or older, a greater consumption of canned foods, cheese and sweets was observed as family income quintiles increased, while breads were more consumed by those children belonging to the lower income quintiles.
ConclusionA high caloric contribution of ultraprocessed foods in detriment to a lower consumption of natural and minimally processed foods was observed in the diet of children younger than 6 years.
Avaliar o consumo alimentar conforme o grau de processamento, segundo a renda e a faixa etária, em uma amostra representativa de crianças menores de seis anos de idade da cidade de Pelotas, RS.
MétodosEstudo transversal conduzido com 770 crianças de zero a 72 meses residentes na zona urbana de Pelotas. O consumo alimentar das crianças foi avaliado por recordatório de 24 horas, aplicado às mães ou responsáveis e o consumo calórico dos alimentos foi estimado de acordo com o grau de processamento. O consumo alimentar foi estratificado por faixa etária (menos de 24 meses; 24 meses ou mais) e as associações entre renda familiar e a participação relativa dos alimentos no total de calorias diárias foram conduzidas por regressão linear simples. Realizou-se teste de Wald para avaliar tendência linear entre os grupos.
ResultadosA média de consumo foi 1.725,7 Kcal/dia. A participação calórica proveniente do grupo de alimentos ultraprocessados foi de 19,7% nas crianças com menos de 24 meses e 36,1% naquelas com 24 meses ou mais, enquanto que a contribuição do grupo de alimentos in natura e minimamente processados foi de 61,2% e 44,1%%, respectivamente. Nas crianças com 24 meses ou mais, observou-se maior consumo de doces conforme o aumento da renda familiar, enquanto que os pães foram mais consumidos entre as crianças pertencentes aos menores quintis de renda.
ConclusãoObservou-se elevada participação calórica de alimentos ultraprocessados em detrimento ao menor consumo de alimentos in natura e minimamente processados na alimentação de crianças menores de 6 anos.
Interest on food consumption in childhood is increasing, considering that the formation of eating habits occurs in the early years of life.1,2 Inappropriate eating habits at an early age can have negative effects in the short- and long-term, affecting the child's physical growth and development3,4 and representing a risk for obesity and other complications.5–7
In recent years, the prevalence of overweight and obesity has increased considerably in the Brazilian population, according to data from the Family Budget Survey (Pesquisa de Orçamentos Familiares [POF]) carried out in 2008–2009. The numbers are also of concern regarding children aged 5–9 years, of whom 33.5% are overweight and 14.3% are obese.8 The substitution of home-cooked and natural foods for processed foods can be one of the factors responsible for the high prevalence of excess weight observed in childhood, because these are high energy-density foods, high in fat, sugar, and sodium. Factors such as globalization, accelerated pace of life, purchasing power, and women's work outside the home can also contribute to the changes that occurred in the eating habits of Brazilian families.9–11 Similarly, the influence of marketing, through advertisements, attractive packaging and labels, stimulates excessive consumption of industrialized goods, especially among children.12–14
In 2010, Monteiro et al.15 proposed a food classification based on the degree and purpose of food processing. This classification has been recently updated and incorporated into the Food Guide for the Brazilian population, in its latest version published in 2015.16 The first group comprises natural and minimally processed food (e.g., fruits, vegetables, meats, and beans). The second group is characterized by the processed food or food ingredients from the food industry, i.e., substances extracted from foods and used in the preparation and cooking of dishes (e.g., vegetable oil, salt, sugar). The third group consists of food products with the addition of salt or sugar or other culinary use substances to natural food to make them durable and more palatable (e.g., pickled vegetables, fruits conserved in syrup and candied fruit, canned sardines and tuna; cheese). The fourth group consists of ultraprocessed food products such as ready-to-eat or ready-to-heat foods, whose processing is aimed at durability, availability, convenience, and the appeal of being a ready-to-eat food.
Considering the early introduction of processed and ultraprocessed foods in children's diet, as well as the fact that low consumption of raw or minimally processed foods may have a negative impact on children's health, this study aimed to evaluate food intake according to the degree of food processing, stratified by income and age range, in a representative sample of children aged less than 6 years from a city in Southern Brazil.
MethodsA cross-sectional population-based study was carried out in the city of Pelotas, state of Rio Grande do Sul, Brazil, in 2008, comprising a temporal series of four surveys from a study that aimed to assess the effect of fortification of wheat flour and corn meal on the occurrence of anemia in children aged less than 6 years. Methodological details of the study can be found in a previous publication.17 In the 40 studied census sectors, systematically selected with probability proportional to size, 850 children aged 1–72 months were identified. Therefore, 799 children were included in the study, representing 94% of the sample. For the present study, children were grouped by age range: younger than 24 months and 24 months or older.
The children's food intake was assessed through a 24-h recall, applied to mothers or tutors, on a weekday not subsequent to Sundays and holidays, by a team of trained nutritionists. One hundred and nineteen children attended day care centers. In this case, the 24-h recall was applied to caregivers, and was complemented by the mother or guardian. The home measurements obtained from the 24-h food recall were transformed in grams or milliliters for the analysis of their nutritional composition. The use of vegetable oil was standardized at 15mL for each savory meal.
The energy content of foods was analyzed with the ADSNutri program (ADSNutri (2006) Nutritional System, version 9.0; Brazil),18 using the Brazilian Food Composition Table,19 complemented by the table from the United States Department of Agriculture.20 For children who were still breastfed, but also received other types of milk and/or complementary foods, the energy contribution of breast milk was calculated.21
Subsequently, the consumed foods were classified into four groups according to the degree and purpose of their processing, following the proposal of the Food Guide for the Brazilian population.16 Group 1 comprised natural and minimally processed foods (e.g., vegetables, fruits, roots and tubers, grains and cereals, legumes, dried fruits, and natural fruit juices; nuts without salt or sugar, flours and meal, pasta, and fresh pasta; meats; fresh, pasteurized or ultra-pasteurized milk or powder milk; yogurt (no sugar added); eggs; and tea, coffee, and drinking water). Group 2 comprised processed culinary ingredients (e.g., vegetable oils, butter, lard, and coconut oil; white, demerara or brown sugar; and refined or coarse salt). Group 3 comprised processed foods (e.g., canned foods, fruit in syrup and crystallized fruits, jams, dried meat and bacon, canned sardines and tuna, cheese), and group 4 comprised ultraprocessed foods (e.g., bread, cakes and baked products, cookies, ice cream, chocolates, candies and sweets in general; cereal bars, breakfast cereals with added sugar, sweetened and flavored yogurt and dairy beverages; energy drinks; frozen and ready-to-heat foods [pasta, pizza, burgers], nuggets, frankfurters and sausages, and pre-prepared dishes and sauces; hydrogenated vegetable fat [margarine and halvarine], chips; sauces; sweet and savory snacks; soft drinks and processed juices; canned meat and dehydrated soups; ready-made noodles; infant formula, complementary formula, and processed baby food; and artificial sweeteners).
Some socio-demographic information were obtained from the main study and used as covariates in this analysis: child gender, maternal level of education in years (up to 4, 5–8, 9–11, ≥12 years), and family income quintiles (obtained by the sum of the income of all household members).
Initially, the mean daily energy (kcal) ingested by children and the corresponding standard error were calculated. The same estimate was calculated according to quintiles of household income (first quintile, lowest income and fifth quintile, highest income), in order to identify whether the income has influence on food consumption according to the degree of processing. At a second moment, the relative contribution of each of the four groups in relation to the total daily energy estimation of each child was calculated, as well as the individual relative contribution of each food in relation to the total energy estimate. Both estimates were analyzed according to the quintiles of household income and stratified by age group (<24 months and 24 months of age or older).
Data were analyzed using the Stata program (Stata Corporation, College Station, version 12.0; USA) using the svy command in all analyses, given the complexity of the sampling process, which was carried out in multiple stages. The association between family income and relative participation of each food group in total energy was performed by linear regression. Wald test for linear trend was performed to assess differences between the groups. A 5% significance level was assumed for all analyses.
The study was approved by the Ethics Committee of Faculdade de Medicina da Universidade Federal de Pelotas. An informed consent was obtained from the children's parent or guardian prior to data collection.
ResultsOf the 799 children included in the original study, 770 were assessed, as 29 were in exclusive breastfeeding. It was observed that 52% of children were males, 72.5% were aged less than 24 months, 53% of mothers had up to eight years of schooling, and the mean family income was R$ 1326.00 (median of R$ 860.00). The mean daily energy consumption was 1725.7kcal. Ultraprocessed foods contributed with about 32% of the total energy; of the remaining, approximately 14% of total daily energy was obtained from processed culinary ingredients and 5.2% of processed foods (data not shown in tables).
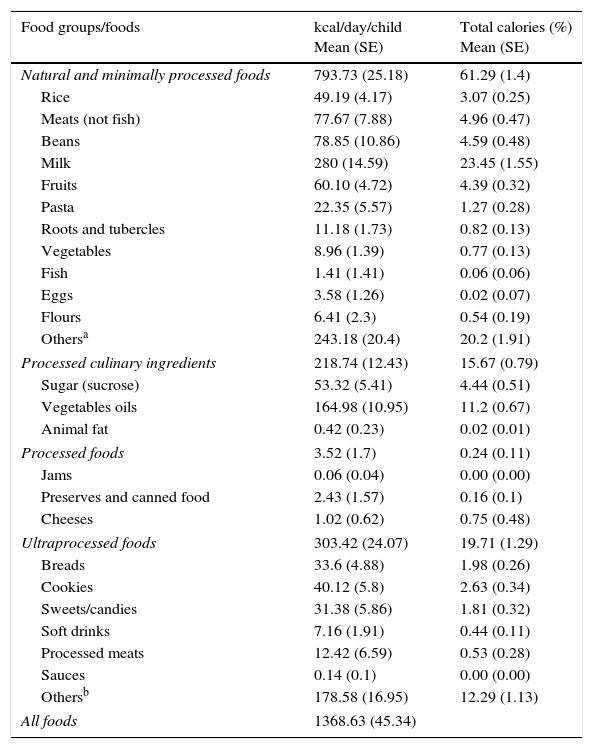
Among children younger than 24 months, the mean energy consumption was 1368.6kcal. Approximately 61% were obtained from natural or minimally processed foods, represented mainly by milk (23.4%). The contribution of ultraprocessed food was 19.7% of total daily energy; 12.9% of foods were classified as others (such as industrialized juices, processed baby food, supplements, and powdered infant formulas), followed by cookies (2.6%), bread (1.9%), and candies/sweets (1.8%). Processed culinary ingredients contributed with 15.7% of the total daily energy, obtained mainly from vegetable oils (11.2%; Table 1).
Caloric intake of children aged less than 24 months, according to classification of foods in relation to the extent and purpose of their industrial processing. Pelotas, RS, Brazil, 2008 (n=214).
| Food groups/foods | kcal/day/child Mean (SE) | Total calories (%) Mean (SE) |
|---|---|---|
| Natural and minimally processed foods | 793.73 (25.18) | 61.29 (1.4) |
| Rice | 49.19 (4.17) | 3.07 (0.25) |
| Meats (not fish) | 77.67 (7.88) | 4.96 (0.47) |
| Beans | 78.85 (10.86) | 4.59 (0.48) |
| Milk | 280 (14.59) | 23.45 (1.55) |
| Fruits | 60.10 (4.72) | 4.39 (0.32) |
| Pasta | 22.35 (5.57) | 1.27 (0.28) |
| Roots and tubercles | 11.18 (1.73) | 0.82 (0.13) |
| Vegetables | 8.96 (1.39) | 0.77 (0.13) |
| Fish | 1.41 (1.41) | 0.06 (0.06) |
| Eggs | 3.58 (1.26) | 0.02 (0.07) |
| Flours | 6.41 (2.3) | 0.54 (0.19) |
| Othersa | 243.18 (20.4) | 20.2 (1.91) |
| Processed culinary ingredients | 218.74 (12.43) | 15.67 (0.79) |
| Sugar (sucrose) | 53.32 (5.41) | 4.44 (0.51) |
| Vegetables oils | 164.98 (10.95) | 11.2 (0.67) |
| Animal fat | 0.42 (0.23) | 0.02 (0.01) |
| Processed foods | 3.52 (1.7) | 0.24 (0.11) |
| Jams | 0.06 (0.04) | 0.00 (0.00) |
| Preserves and canned food | 2.43 (1.57) | 0.16 (0.1) |
| Cheeses | 1.02 (0.62) | 0.75 (0.48) |
| Ultraprocessed foods | 303.42 (24.07) | 19.71 (1.29) |
| Breads | 33.6 (4.88) | 1.98 (0.26) |
| Cookies | 40.12 (5.8) | 2.63 (0.34) |
| Sweets/candies | 31.38 (5.86) | 1.81 (0.32) |
| Soft drinks | 7.16 (1.91) | 0.44 (0.11) |
| Processed meats | 12.42 (6.59) | 0.53 (0.28) |
| Sauces | 0.14 (0.1) | 0.00 (0.00) |
| Othersb | 178.58 (16.95) | 12.29 (1.13) |
| All foods | 1368.63 (45.34) | |
kcal, calories; SE, standard error.
Natural fruit juices; peanuts; lentils; soups and other home-cooked culinary preparations (purees, vegetable pies, pancakes, among others); homemade cakes and breads; teas and coffees; rolled oats; honey.
Industrialized juices; processed baby food; powder infant formula and supplements; cereal flour; processed meats (breaded meat, nuggets, hamburgers); processed pasta (cup noodles and noodles); industrialized seasoning; sweetened cornflakes; potato chips; sweetened cereal bars; pizzas; chocolate milk powder; soy beverages; artificial sweeteners; cream cheese; yogurt and sweetened and flavored dairy beverages.
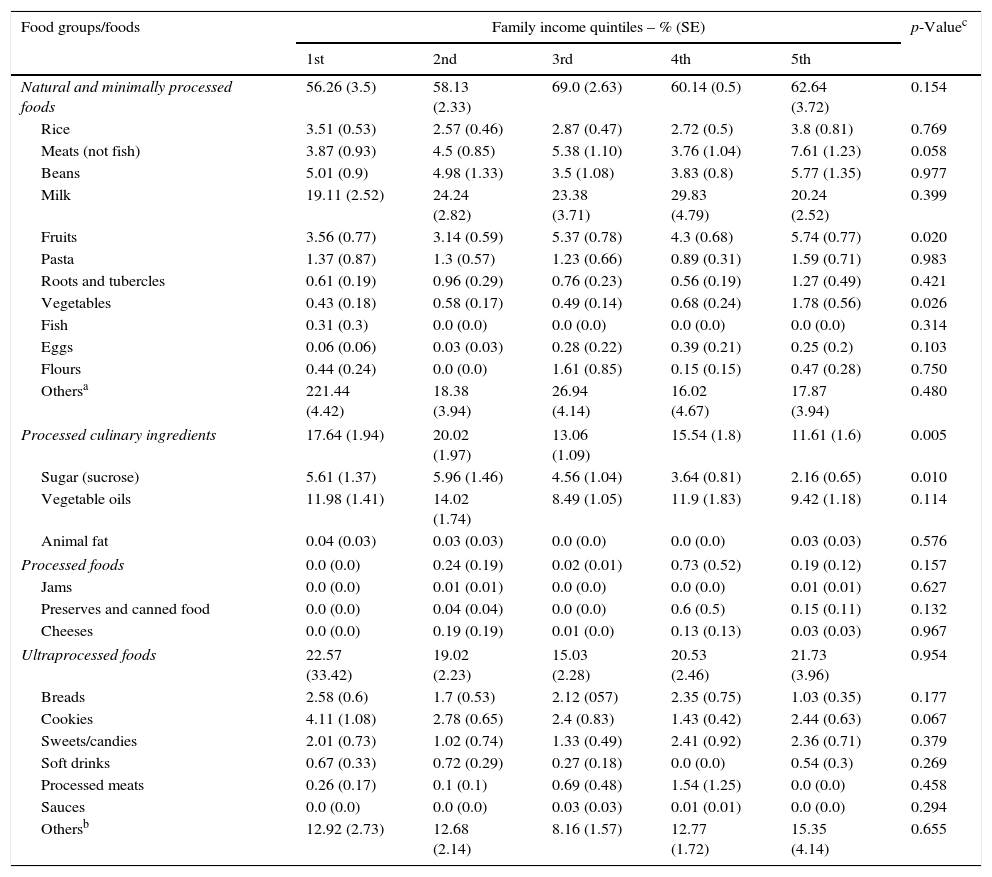
Regarding income quintiles in children younger than 24 months, there were no significant differences in the consumption of natural and minimally processed foods. However, when analyzing the participation of each food alone, it was observed that consumption of fruits and vegetables was significantly higher among children belonging to the highest income quintile. As for the participation of processed culinary ingredients, sugar consumption showed a significant inverse association with income quintiles. The consumption of processed and ultraprocessed foods did not differ according to income quintiles (Table 2).
Relative caloric contribution of food groups, classified according to the extent and purpose of their industrial processing, for the caloric intake of children aged less than 24 months, according to family income quintiles. Pelotas, RS, Brazil, 2008 (n=214).
| Food groups/foods | Family income quintiles – % (SE) | p-Valuec | ||||
|---|---|---|---|---|---|---|
| 1st | 2nd | 3rd | 4th | 5th | ||
| Natural and minimally processed foods | 56.26 (3.5) | 58.13 (2.33) | 69.0 (2.63) | 60.14 (0.5) | 62.64 (3.72) | 0.154 |
| Rice | 3.51 (0.53) | 2.57 (0.46) | 2.87 (0.47) | 2.72 (0.5) | 3.8 (0.81) | 0.769 |
| Meats (not fish) | 3.87 (0.93) | 4.5 (0.85) | 5.38 (1.10) | 3.76 (1.04) | 7.61 (1.23) | 0.058 |
| Beans | 5.01 (0.9) | 4.98 (1.33) | 3.5 (1.08) | 3.83 (0.8) | 5.77 (1.35) | 0.977 |
| Milk | 19.11 (2.52) | 24.24 (2.82) | 23.38 (3.71) | 29.83 (4.79) | 20.24 (2.52) | 0.399 |
| Fruits | 3.56 (0.77) | 3.14 (0.59) | 5.37 (0.78) | 4.3 (0.68) | 5.74 (0.77) | 0.020 |
| Pasta | 1.37 (0.87) | 1.3 (0.57) | 1.23 (0.66) | 0.89 (0.31) | 1.59 (0.71) | 0.983 |
| Roots and tubercles | 0.61 (0.19) | 0.96 (0.29) | 0.76 (0.23) | 0.56 (0.19) | 1.27 (0.49) | 0.421 |
| Vegetables | 0.43 (0.18) | 0.58 (0.17) | 0.49 (0.14) | 0.68 (0.24) | 1.78 (0.56) | 0.026 |
| Fish | 0.31 (0.3) | 0.0 (0.0) | 0.0 (0.0) | 0.0 (0.0) | 0.0 (0.0) | 0.314 |
| Eggs | 0.06 (0.06) | 0.03 (0.03) | 0.28 (0.22) | 0.39 (0.21) | 0.25 (0.2) | 0.103 |
| Flours | 0.44 (0.24) | 0.0 (0.0) | 1.61 (0.85) | 0.15 (0.15) | 0.47 (0.28) | 0.750 |
| Othersa | 221.44 (4.42) | 18.38 (3.94) | 26.94 (4.14) | 16.02 (4.67) | 17.87 (3.94) | 0.480 |
| Processed culinary ingredients | 17.64 (1.94) | 20.02 (1.97) | 13.06 (1.09) | 15.54 (1.8) | 11.61 (1.6) | 0.005 |
| Sugar (sucrose) | 5.61 (1.37) | 5.96 (1.46) | 4.56 (1.04) | 3.64 (0.81) | 2.16 (0.65) | 0.010 |
| Vegetable oils | 11.98 (1.41) | 14.02 (1.74) | 8.49 (1.05) | 11.9 (1.83) | 9.42 (1.18) | 0.114 |
| Animal fat | 0.04 (0.03) | 0.03 (0.03) | 0.0 (0.0) | 0.0 (0.0) | 0.03 (0.03) | 0.576 |
| Processed foods | 0.0 (0.0) | 0.24 (0.19) | 0.02 (0.01) | 0.73 (0.52) | 0.19 (0.12) | 0.157 |
| Jams | 0.0 (0.0) | 0.01 (0.01) | 0.0 (0.0) | 0.0 (0.0) | 0.01 (0.01) | 0.627 |
| Preserves and canned food | 0.0 (0.0) | 0.04 (0.04) | 0.0 (0.0) | 0.6 (0.5) | 0.15 (0.11) | 0.132 |
| Cheeses | 0.0 (0.0) | 0.19 (0.19) | 0.01 (0.0) | 0.13 (0.13) | 0.03 (0.03) | 0.967 |
| Ultraprocessed foods | 22.57 (33.42) | 19.02 (2.23) | 15.03 (2.28) | 20.53 (2.46) | 21.73 (3.96) | 0.954 |
| Breads | 2.58 (0.6) | 1.7 (0.53) | 2.12 (057) | 2.35 (0.75) | 1.03 (0.35) | 0.177 |
| Cookies | 4.11 (1.08) | 2.78 (0.65) | 2.4 (0.83) | 1.43 (0.42) | 2.44 (0.63) | 0.067 |
| Sweets/candies | 2.01 (0.73) | 1.02 (0.74) | 1.33 (0.49) | 2.41 (0.92) | 2.36 (0.71) | 0.379 |
| Soft drinks | 0.67 (0.33) | 0.72 (0.29) | 0.27 (0.18) | 0.0 (0.0) | 0.54 (0.3) | 0.269 |
| Processed meats | 0.26 (0.17) | 0.1 (0.1) | 0.69 (0.48) | 1.54 (1.25) | 0.0 (0.0) | 0.458 |
| Sauces | 0.0 (0.0) | 0.0 (0.0) | 0.03 (0.03) | 0.01 (0.01) | 0.0 (0.0) | 0.294 |
| Othersb | 12.92 (2.73) | 12.68 (2.14) | 8.16 (1.57) | 12.77 (1.72) | 15.35 (4.14) | 0.655 |
SE, standard error.
Natural fruit juices; peanuts; lentils; soups and other home-cooked culinary preparations (purees, vegetable pies, pancakes, among others); homemade cakes and breads; teas and coffees; rolled oats; honey.
Industrialized juices; processed baby food; powder infant formula and supplements; cereal flour; processed meats (breaded meat, nuggets, hamburgers); processed pasta (cup noodles and noodles); industrialized seasoning; sweetened cornflakes; potato chips; sweetened cereal bars; pizzas; chocolate milk powder; soy beverages; artificial sweeteners; cream cheese; yogurt and sweetened and flavored dairy beverages.
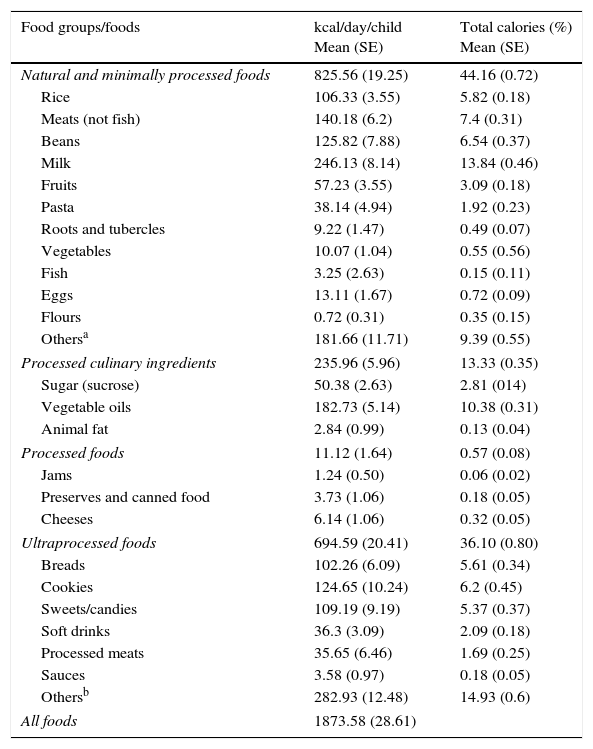
As for children aged 24 months or older, the mean daily energy was 1873.6kcal. Less than half (44.2%) of this energy percentage was obtained from the group of natural and minimally processed foods, mainly milk (13.8%), meats (7.4%), beans (6.5%), and rice (5.8%). The contribution of ultraprocessed food was 36.1% of total daily energy; 14.9% were obtained from foods classified as others (industrialized juices, processed baby food, supplements, and infant formulas), followed by cookies (6.2%), bread (5.6%), and candies/sweets (5.4%). Approximately 13% of total daily energy came from processed culinary ingredients; most of that energy was obtained from vegetable oils (10.4%; Table 3).
Caloric intake of children aged 24 months or older, according to the classification of foods in relation to the extent and purpose of the industrial processing. Pelotas, RS, Brazil, 2008 (n=556).
| Food groups/foods | kcal/day/child Mean (SE) | Total calories (%) Mean (SE) |
|---|---|---|
| Natural and minimally processed foods | 825.56 (19.25) | 44.16 (0.72) |
| Rice | 106.33 (3.55) | 5.82 (0.18) |
| Meats (not fish) | 140.18 (6.2) | 7.4 (0.31) |
| Beans | 125.82 (7.88) | 6.54 (0.37) |
| Milk | 246.13 (8.14) | 13.84 (0.46) |
| Fruits | 57.23 (3.55) | 3.09 (0.18) |
| Pasta | 38.14 (4.94) | 1.92 (0.23) |
| Roots and tubercles | 9.22 (1.47) | 0.49 (0.07) |
| Vegetables | 10.07 (1.04) | 0.55 (0.56) |
| Fish | 3.25 (2.63) | 0.15 (0.11) |
| Eggs | 13.11 (1.67) | 0.72 (0.09) |
| Flours | 0.72 (0.31) | 0.35 (0.15) |
| Othersa | 181.66 (11.71) | 9.39 (0.55) |
| Processed culinary ingredients | 235.96 (5.96) | 13.33 (0.35) |
| Sugar (sucrose) | 50.38 (2.63) | 2.81 (014) |
| Vegetable oils | 182.73 (5.14) | 10.38 (0.31) |
| Animal fat | 2.84 (0.99) | 0.13 (0.04) |
| Processed foods | 11.12 (1.64) | 0.57 (0.08) |
| Jams | 1.24 (0.50) | 0.06 (0.02) |
| Preserves and canned food | 3.73 (1.06) | 0.18 (0.05) |
| Cheeses | 6.14 (1.06) | 0.32 (0.05) |
| Ultraprocessed foods | 694.59 (20.41) | 36.10 (0.80) |
| Breads | 102.26 (6.09) | 5.61 (0.34) |
| Cookies | 124.65 (10.24) | 6.2 (0.45) |
| Sweets/candies | 109.19 (9.19) | 5.37 (0.37) |
| Soft drinks | 36.3 (3.09) | 2.09 (0.18) |
| Processed meats | 35.65 (6.46) | 1.69 (0.25) |
| Sauces | 3.58 (0.97) | 0.18 (0.05) |
| Othersb | 282.93 (12.48) | 14.93 (0.6) |
| All foods | 1873.58 (28.61) | |
SE, standard error.
Natural fruit juices; peanuts; lentils; soups and other home-cooked culinary preparations (purees, vegetable pies, pancakes, among others); homemade cakes and breads; teas and coffees; rolled oats; honey.
Industrialized juices; processed baby food; powder infant formula and supplements; cereal flour; processed meats (breaded meat, nuggets, hamburgers); processed pasta (cup noodles and noodles); industrialized seasoning; sweetened cornflakes; potato chips; sweetened cereal bars; pizzas; chocolate milk powder; soy beverages; artificial sweeteners; cream cheese; yogurt and sweetened and flavored dairy beverages.
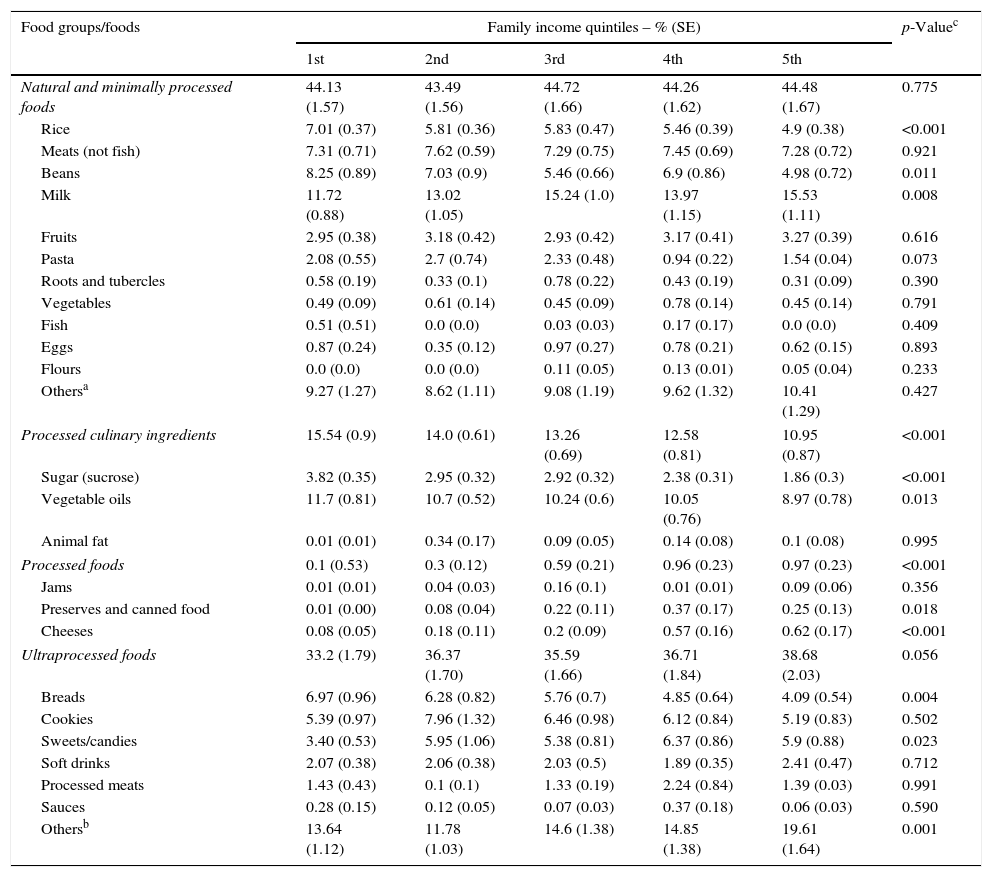
In the age group of 24 months or older, the participation of the group of natural and minimally processed foods did not vary according to income quintiles. However, when analyzing the participation of each food alone, it was observed that the consumption of rice and beans decreased significantly with increasing income, whereas milk consumption increased. Regarding the participation of processed culinary ingredients in the diet, sugar and vegetable oils showed an inverse association with income quintiles. Regarding the group of processed and ultraprocessed foods, consumption increased according to the income quintiles, being significant only in the group of processed foods.
When analyzing the contribution of each item from the ultraprocessed food group alone, the consumption of bread decreased significantly as income increased, while candies/sweets and other foods, such as chocolate milk powder, processed juices, yogurts, and dairy beverages, showed a positive significant association with income (Table 4).
Relative caloric contribution of food groups, classified according to the extent and purpose of their industrial processing, for the caloric intake of children aged 24 months or older, according to family income quintiles. Pelotas, RS, Brazil, 2008 (n=556).
| Food groups/foods | Family income quintiles – % (SE) | p-Valuec | ||||
|---|---|---|---|---|---|---|
| 1st | 2nd | 3rd | 4th | 5th | ||
| Natural and minimally processed foods | 44.13 (1.57) | 43.49 (1.56) | 44.72 (1.66) | 44.26 (1.62) | 44.48 (1.67) | 0.775 |
| Rice | 7.01 (0.37) | 5.81 (0.36) | 5.83 (0.47) | 5.46 (0.39) | 4.9 (0.38) | <0.001 |
| Meats (not fish) | 7.31 (0.71) | 7.62 (0.59) | 7.29 (0.75) | 7.45 (0.69) | 7.28 (0.72) | 0.921 |
| Beans | 8.25 (0.89) | 7.03 (0.9) | 5.46 (0.66) | 6.9 (0.86) | 4.98 (0.72) | 0.011 |
| Milk | 11.72 (0.88) | 13.02 (1.05) | 15.24 (1.0) | 13.97 (1.15) | 15.53 (1.11) | 0.008 |
| Fruits | 2.95 (0.38) | 3.18 (0.42) | 2.93 (0.42) | 3.17 (0.41) | 3.27 (0.39) | 0.616 |
| Pasta | 2.08 (0.55) | 2.7 (0.74) | 2.33 (0.48) | 0.94 (0.22) | 1.54 (0.04) | 0.073 |
| Roots and tubercles | 0.58 (0.19) | 0.33 (0.1) | 0.78 (0.22) | 0.43 (0.19) | 0.31 (0.09) | 0.390 |
| Vegetables | 0.49 (0.09) | 0.61 (0.14) | 0.45 (0.09) | 0.78 (0.14) | 0.45 (0.14) | 0.791 |
| Fish | 0.51 (0.51) | 0.0 (0.0) | 0.03 (0.03) | 0.17 (0.17) | 0.0 (0.0) | 0.409 |
| Eggs | 0.87 (0.24) | 0.35 (0.12) | 0.97 (0.27) | 0.78 (0.21) | 0.62 (0.15) | 0.893 |
| Flours | 0.0 (0.0) | 0.0 (0.0) | 0.11 (0.05) | 0.13 (0.01) | 0.05 (0.04) | 0.233 |
| Othersa | 9.27 (1.27) | 8.62 (1.11) | 9.08 (1.19) | 9.62 (1.32) | 10.41 (1.29) | 0.427 |
| Processed culinary ingredients | 15.54 (0.9) | 14.0 (0.61) | 13.26 (0.69) | 12.58 (0.81) | 10.95 (0.87) | <0.001 |
| Sugar (sucrose) | 3.82 (0.35) | 2.95 (0.32) | 2.92 (0.32) | 2.38 (0.31) | 1.86 (0.3) | <0.001 |
| Vegetable oils | 11.7 (0.81) | 10.7 (0.52) | 10.24 (0.6) | 10.05 (0.76) | 8.97 (0.78) | 0.013 |
| Animal fat | 0.01 (0.01) | 0.34 (0.17) | 0.09 (0.05) | 0.14 (0.08) | 0.1 (0.08) | 0.995 |
| Processed foods | 0.1 (0.53) | 0.3 (0.12) | 0.59 (0.21) | 0.96 (0.23) | 0.97 (0.23) | <0.001 |
| Jams | 0.01 (0.01) | 0.04 (0.03) | 0.16 (0.1) | 0.01 (0.01) | 0.09 (0.06) | 0.356 |
| Preserves and canned food | 0.01 (0.00) | 0.08 (0.04) | 0.22 (0.11) | 0.37 (0.17) | 0.25 (0.13) | 0.018 |
| Cheeses | 0.08 (0.05) | 0.18 (0.11) | 0.2 (0.09) | 0.57 (0.16) | 0.62 (0.17) | <0.001 |
| Ultraprocessed foods | 33.2 (1.79) | 36.37 (1.70) | 35.59 (1.66) | 36.71 (1.84) | 38.68 (2.03) | 0.056 |
| Breads | 6.97 (0.96) | 6.28 (0.82) | 5.76 (0.7) | 4.85 (0.64) | 4.09 (0.54) | 0.004 |
| Cookies | 5.39 (0.97) | 7.96 (1.32) | 6.46 (0.98) | 6.12 (0.84) | 5.19 (0.83) | 0.502 |
| Sweets/candies | 3.40 (0.53) | 5.95 (1.06) | 5.38 (0.81) | 6.37 (0.86) | 5.9 (0.88) | 0.023 |
| Soft drinks | 2.07 (0.38) | 2.06 (0.38) | 2.03 (0.5) | 1.89 (0.35) | 2.41 (0.47) | 0.712 |
| Processed meats | 1.43 (0.43) | 0.1 (0.1) | 1.33 (0.19) | 2.24 (0.84) | 1.39 (0.03) | 0.991 |
| Sauces | 0.28 (0.15) | 0.12 (0.05) | 0.07 (0.03) | 0.37 (0.18) | 0.06 (0.03) | 0.590 |
| Othersb | 13.64 (1.12) | 11.78 (1.03) | 14.6 (1.38) | 14.85 (1.38) | 19.61 (1.64) | 0.001 |
SE, standard error.
Natural fruit juices; peanuts; lentils; soups and other home-cooked culinary preparations (purees, vegetable pies, pancakes, among others); homemade cakes and breads; teas and coffees; rolled oats; honey.
Industrialized juices; processed baby food; powder infant formula and supplements; cereal flour; processed meats (breaded meat, nuggets, hamburgers); processed pasta (cup noodles and noodles); industrialized seasoning; sweetened cornflakes; potato chips; sweetened cereal bars; pizzas; chocolate milk powder; soy beverages; artificial sweeteners; cream cheese; yogurt and sweetened and flavored dairy beverages.
This study showed that the participation of ultraprocessed foods in the diet of children younger than 6 years is high and increases with age. Consumption of ultraprocessed foods in the assessed age groups was characterized by several processed foods, as well as breads, cookies, and candies/sweets. It is known that children's eating behavior is highly influenced by the family's eating habits. Conversely, during the phase of complementary feeding introduction, it is common for children to have food neophobia and difficulties in accepting new flavors.22 Therefore, parents may experience difficulties in infant feeding with the offer of more palatable and convenient foods found in ultraprocessed items, which promotes the establishment of unhealthy habits at later ages.
The increase in the participation of processed and ultraprocessed foods and the decrease in the consumption of natural and minimally processed foods in the Brazilian diet is a phenomenon observed in the last three national Family Budget Surveys.10 The National Demographic and Health Survey (2006/2007) carried out with children younger than 5 years showed a low intake of natural foods, such as vegetables, green vegetables, and meat, as well as a high consumption of processed foods (such as soft drinks, candies/sweets and snacks).23 Another Brazilian study on dietary patterns of children younger than 5 years living in urban and rural regions identified the presence of breads, cookies, and sugars in the customary consumption of children aged 6–17 months, in addition to a low consumption of milk and low variety of fruits and vegetables in the diets of children aged 18 months and older.22
Data from the National Health Survey on infant feeding, which was recently released, shows that 60.8% of children younger than 2 years old eat cookies, biscuits, or cake, and 32.3% drank soft drinks or artificial juices.23 These results reinforce the growing trend of ultraprocessed food consumption by children with a consequent reduction in natural and minimally processed food consumption.
Regarding natural and minimally processed foods, it is observed that the participation of fruits and vegetables showed a positive association with family income only among children younger than 24 months, whereas in the older age group the relative participation decreased at the higher quintiles and thus, the association with income disappeared. Therefore, the data may suggest that the lower participation of fruit and vegetables in children's diet might not be only a matter of family income. In fact, the low consumption of fruits and vegetables is also observed in children from richer countries.1,2 Other factors such as the late introduction of fruits and vegetables at the phase of complementary feeding and the mothers’ habit of eating fruits and vegetables can interfere with their children's food preferences.1,24–26
In contrast, the relative contribution of milk in the diet showed no difference according to income quintiles among children aged less than 24 months, while in the older age group, the participation of dairy products decreases in all income quintiles and the positive association with income becomes significant. It is also interesting to note that the participation of rice and beans becomes inversely and significantly associated with income quintiles also in the older age group. Families with lower income tend to maintain a more traditional diet, based on beans and rice.27
Regarding processed culinary ingredients, sugar consumption maintained a significant inverse association with income quintiles in both age groups. The participation of vegetable oils showed a significant inverse association with income only among children older than 24 months. Unlike vegetable oils, which contribute as an important source of essential fatty acids in infant feeding, sugar is an ingredient virtually free of nutrients and its use does not contribute to improve the nutritional value of the food to which it is added. Often, the increased consumption of sugar and fats are usually associated with the lower income population.27,28
Although ultraprocessed foods have high energy density and do not add significant nutritional value, differences in the relative participation of certain foods in relation to income quintiles were observed only among children older than 24 months. However, the relative participation of soft drinks and cookies increased among children in the same age range, with no difference between the income quintiles. Conversely, the relative participation of sweets increased as the quintiles of household income increased. Other Brazilian studies have also shown the influence of family income on the consumption of ultraprocessed foods.3,29
One of the limitations of the present study is the use of 24-h recall of only one day of the week, which does not consider the variability of food consumption. Another limitation to be emphasized refers to the classification of foods regarding the degree of processing.
Because this was a study of secondary data, the initial study planning did not predict the classification of foods according to their degree of processing. However, the recall method requires a detailed account of the consumed foods, which allowed for the classification of most items; in cases of doubt, a conservative classification was chosen, characterizing as processed and ultraprocessed only those foods without the possibility of home preparation. Despite possible limitations, this study was able to collect detailed information on feeding and identify important differences in consumption between the assessed age groups.
This study reinforces discussions about the growing participation of ultraprocessed foods in the diet of Brazilians and the importance of greater attention to the quality of the diet provided to children younger than 6 years. The data show that at an early age, one can observe a greater relative participation of ultraprocessed food to the detriment of lower consumption of natural and minimally processed foods. The results can be used by healthcare professionals to guide parents about infant feeding, as well as educators and professionals involved in the planning of menus in kindergartens.
FundingConselho Nacional de Desenvolvimento Científico e Tecnológico.
Conflicts of interestThe authors declare no conflicts of interest.
Please cite this article as: Karnopp EV, Vaz JS, Schafer AA, Muniz LC, Souza RL, Santos I, et al. Food consumption of children younger than 6 years according to the degree of food processing. J Pediatr (Rio J). 2017;93:70–8.


