

Evaluate the relationship between body mass index and physical fitness in a cross-sectional sample of Brazilian youth.
MethodsParticipants were 3849 adolescents (2027 girls) aged 10–17 years. Weight and height were measured; body mass index was calculated. Physical fitness was evaluated with a multistage 20m shuttle run (cardiovascular endurance), standing long jump (power), and push-ups (upper body strength). Participants were grouped by sex into four age groups: 10–11, 12–13, 14–15, and 16–17 years. Sex-specific ANOVA was used to evaluate differences in each physical fitness item among weight status categories by age group. Relationships between body mass index and each physical fitness item were evaluated with quadratic regression models by age group within each sex.
ResultsThe physical fitness of thin and normal youth was, with few exceptions, significantly better than the physical fitness of overweight and obese youth in each age group by sex. On the other hand, physical fitness performances did not consistently differ, on average, between thin and normal weight and between overweight and obese youths. Results of the quadratic regressions indicated a curvilinear (parabolic) relationship between body mass index and each physical fitness item in most age groups. Better performances were attained by adolescents in the mid-range of the body mass index distribution, while performances of youth at the low and high ends of the body mass index distribution were lower.
ConclusionRelationships between the body mass index and physical fitness were generally nonlinear (parabolic) in youth 10–17 years.
Avaliar a relação entre o índice de massa corporal e a aptidão física em uma amostra transversal de jovens brasileiros.
MétodosOs participantes foram 3.849 adolescentes (2.027 meninas) entre 10-17 anos. Foram medidos o peso e a estatura e foi calculado o índice de massa corporal. A aptidão física foi avaliada com: a corrida vaivém de 20 metros de vários estágios (resistência cardiovascular), impulsão horizontal (energia) e flexões (força superior do corpo). Os participantes foram agrupados por sexo em quatro faixas etárias: 10-11, 12-13, 14-15 e 16-17 anos. A Anova específica para sexo foi usada para avaliar as diferenças em cada item de aptidão física entre as categorias de status do peso por faixa etária. As relações entre o índice de massa corporal e cada item de aptidão física foram avaliadas com os modelos de regressão quadrática por faixa etária com relação ao sexo.
ResultadosA aptidão física de jovens magros e normais foi, com poucas exceções,significativamente melhor do que a aptidão física de jovens com sobrepeso e obesos em cada faixa etária por sexo. Por outro lado, os desempenhos na aptidão física não diferiram de forma consistente, em média, entre jovens magros e com peso normal e entre jovens com sobrepeso e obesos. Os resultados das regressões quadráticas indicaram uma relação curvilínea (parabólica) entre o índice de massa corporal e cada item de aptidão física na maior parte das faixas etárias. Os melhores desempenhos foram obtidos pelos adolescentes na faixa intermediária da distribuição do índice de massa corporal, ao passo que os desempenhos dos jovens nas extremidades inferiores e superiores da distribuição do índice de massa corporal foram menores.
ConclusãoAs relações entre o índice de massa corporal e a aptidão física foram, em geral, não lineares (parabólica) nos jovens entre 10-17 anos.
The increasing prevalence of obesity among children and adolescence is a major public health challenge worldwide, as it is associated with poor health during childhood, adolescence, and adulthood.1 Obesity also affects health-related physical fitness, which is often defined in the context of cardiorespiratory endurance, muscular strength and endurance, and flexibility, among others.2
The body mass index (BMI) (weight [kg]/height [m2]) is a widely used indicator of weight status, which ranges from extreme thinness through obesity. At its higher extremes, i.e., overweight and obesity, BMI is commonly accepted as a surrogate indicator of excess weight. Since BMI is based on weight and height, it is considered less intrusive than more direct estimates of adiposity, e.g., skinfolds. Moreover, the conceptual basis for its use in this context is reasonably well understood by the general public.
Relationships between BMI and indicators of physical fitness among youth are commonly viewed in terms of potentially negative influences of excess weight-for-height on fitness. Many studies postulate a linear relationship between BMI and fitness,3,4 and evidence indicates linear, negative relationships between BMI and fitness, specifically in studies of overweight and/or obese individuals.5–7 The latter, of course, consider only a limited range of the BMI.
It is possible that at the other extreme, a low BMI may have a negative influence on some measures of physical fitness.8 A low BMI, i.e., thinness, may influence fitness tests requiring strength and power due in part to a smaller muscle mass. It thus makes sense to consider variation in indicators of fitness across the full range of variation in BMI in samples of youths.
Severe thinness and obesity represent contrasting extremes of the spectrum of weight status. It is equally important to recognize that moderate to severe thinness evident in low BMIs, sometimes labeled underweight or undernutrition, is associated with a risk of medical instability and long-term medical consequences.9,10 The incidence of restrictive eating and low BMI in children has been estimated at 3.1 per 100,000 person-years in the United Kingdom11 and 2.6 per 100,000 person-years in Canada.12 Low weight-for-height (wasting or thinness) indicates in most cases a recent and severe process of weight loss, which is often associated with acute starvation and/or severe disease. Wasting, of course, may also be the result of chronically unfavorable living conditions, as in segments of the population in developing countries. The prevalence of underweight in developed countries was estimated at 0.9%, but was markedly higher in the developing countries of Latin America, at 19.3%, Africa, at 26.8%, and Asia, at 18.5%.13
Relatively few studies have examined relationships between fitness and BMI in samples of youths with BMIs spanning the range from thin to obese, and/or have addressed potential nonlinear relationships.8,14 Results of a few studies have noted non-linear relationships for several fitness tests and also variation in relationships with chronological age and sex, and among specific fitness items.15
The purpose of this study was to evaluate the relationships between BMI and performances on three physical fitness tests in a cross-sectional sample of Brazilian youths, 10–17 years of age. It was hypothesized that individuals at each end of the BMI distribution, i.e., thinness (low BMI) and obesity (high BMI) would have lower performances on the individual fitness tests compared to normal weight youth. The expected association between the BMI and fitness items would be curvilinear with a parabolic shape.
MethodsParticipantsThirty-four schools were contacted from the Itaipu Lake region in the state of Paraná, Brazil, which has a student population of ∼58,000. The number of participants that would be representative of the student population of 10–17 year olds was determined as 5962 (10.2%) students (2938 males and 3024 females). This number of students was randomly selected with the permission and assistance of school authorities. Students with physical or mental limitations were excluded. Written informed consent was obtained from parents or guardians, and from the students. A consent rate of 80% was obtained. Since some students did not complete all assessments, the final sample was 3849 youths (2027 girls and 1822 boys), 10 through 17 years of age. The ethnic background of sample was primarily white (89.4%).
The study was approved by the ethical committee of the Medical School of the State University of Campinas, Sao Paulo, Brazil.
Body dimensionsBody weight and height were measured by five individuals experienced in anthropometry, following a standard protocol.15 Weight was measured with a digital scale (Tanita, model BC601) and height with a portable stadiometer (Seca, model 217). Intra-observer technical errors of measurement, obtained with two consecutive measures made by the same technician, varied between 0.19 and 0.27cm for height and between 0.20 and 0.28kg for weight. The BMI, weight (kg)/height squared (m2), was calculated. Age- and sex-specific cut-offs suggested by the International Obesity Task Force (IOTF) were used to classify youth as thin, normal weight, overweight, or obese.16,17
Physical fitnessCardiorespiratory fitness was measured with the multistage 20m shuttle run test.18 Participants were instructed to run at a pace indicated by a beep. The test started with a running speed of 8.5km/h and was progressively increased by 0.5km/h with each minute. The test ended when the individual stopped running due to fatigue or could not maintain the pace for two consecutive shuttles. The result was expressed as the total distance covered in meters.
Explosive power was assessed with the standing long jump, measured to the nearest cm. The longest of three jumps was retained for analysis.
Muscular strength and endurance was assessed with push-ups in boys and modified push-ups in girls. For the modified test the girls rested on their knees, in contrast to the standard position on the toes in the protocol for boys.
All measures were taken during physical education classes at the indoor facilities of each of the 34 schools.
AnalysisDescriptive statistics for all variables were calculated separately for girls and boys by two-year age groups – 10–11, 12–13, 14–15, and 16–17 years. One-way ANOVA was used to evaluate differences in each physical fitness item among weight status categories by age group within sex. The Tukey test was used for post hoc comparisons. Significance was set at p≤0.05.
Sex-specific quadratic regressions models of each fitness test on the BMI were performed in the four age groups. Each fitness item was the dependent variable, while the BMI and BMI2 were the independent variables as follows:
where a, b, and c were constants.Results
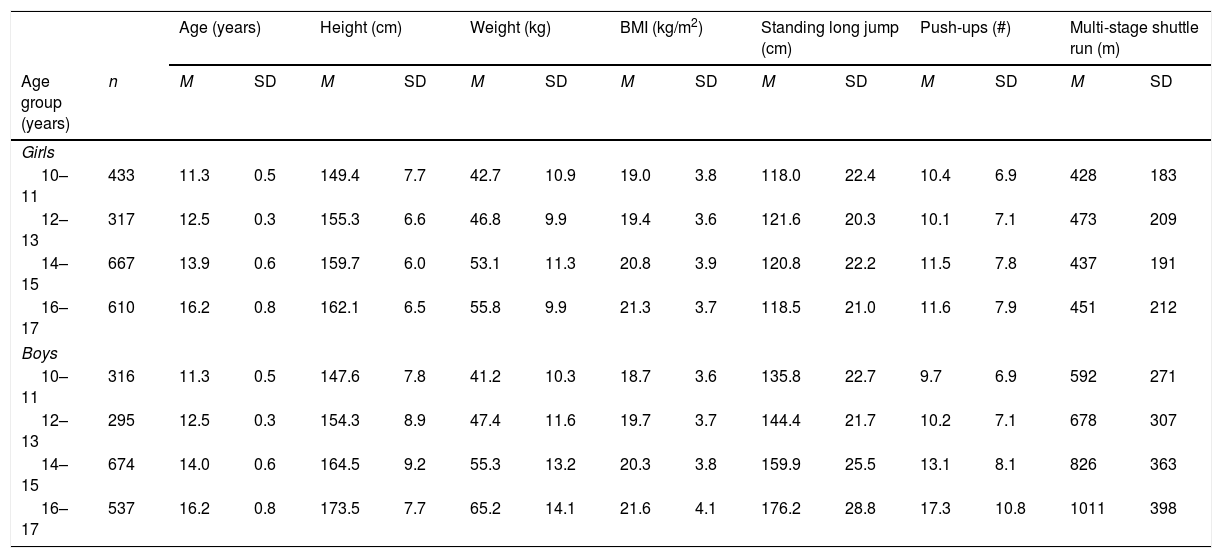
Descriptive statistics for age, height, weight, the BMI and three fitness items are summarized for girls and boys by age group in Table 1. There is little variation among age groups of girls in each fitness item; among boys, in contrast, performances on each test increase, on average, with age.
Number of participants, means, and standard deviations for age, height, weight, BMI, and physical fitness items for girls and boys by age group.
| Age (years) | Height (cm) | Weight (kg) | BMI (kg/m2) | Standing long jump (cm) | Push-ups (#) | Multi-stage shuttle run (m) | |||||||||
|---|---|---|---|---|---|---|---|---|---|---|---|---|---|---|---|
| Age group (years) | n | M | SD | M | SD | M | SD | M | SD | M | SD | M | SD | M | SD |
| Girls | |||||||||||||||
| 10–11 | 433 | 11.3 | 0.5 | 149.4 | 7.7 | 42.7 | 10.9 | 19.0 | 3.8 | 118.0 | 22.4 | 10.4 | 6.9 | 428 | 183 |
| 12–13 | 317 | 12.5 | 0.3 | 155.3 | 6.6 | 46.8 | 9.9 | 19.4 | 3.6 | 121.6 | 20.3 | 10.1 | 7.1 | 473 | 209 |
| 14–15 | 667 | 13.9 | 0.6 | 159.7 | 6.0 | 53.1 | 11.3 | 20.8 | 3.9 | 120.8 | 22.2 | 11.5 | 7.8 | 437 | 191 |
| 16–17 | 610 | 16.2 | 0.8 | 162.1 | 6.5 | 55.8 | 9.9 | 21.3 | 3.7 | 118.5 | 21.0 | 11.6 | 7.9 | 451 | 212 |
| Boys | |||||||||||||||
| 10–11 | 316 | 11.3 | 0.5 | 147.6 | 7.8 | 41.2 | 10.3 | 18.7 | 3.6 | 135.8 | 22.7 | 9.7 | 6.9 | 592 | 271 |
| 12–13 | 295 | 12.5 | 0.3 | 154.3 | 8.9 | 47.4 | 11.6 | 19.7 | 3.7 | 144.4 | 21.7 | 10.2 | 7.1 | 678 | 307 |
| 14–15 | 674 | 14.0 | 0.6 | 164.5 | 9.2 | 55.3 | 13.2 | 20.3 | 3.8 | 159.9 | 25.5 | 13.1 | 8.1 | 826 | 363 |
| 16–17 | 537 | 16.2 | 0.8 | 173.5 | 7.7 | 65.2 | 14.1 | 21.6 | 4.1 | 176.2 | 28.8 | 17.3 | 10.8 | 1011 | 398 |
M, mean; SD, standard deviation; BMI, body mass index.
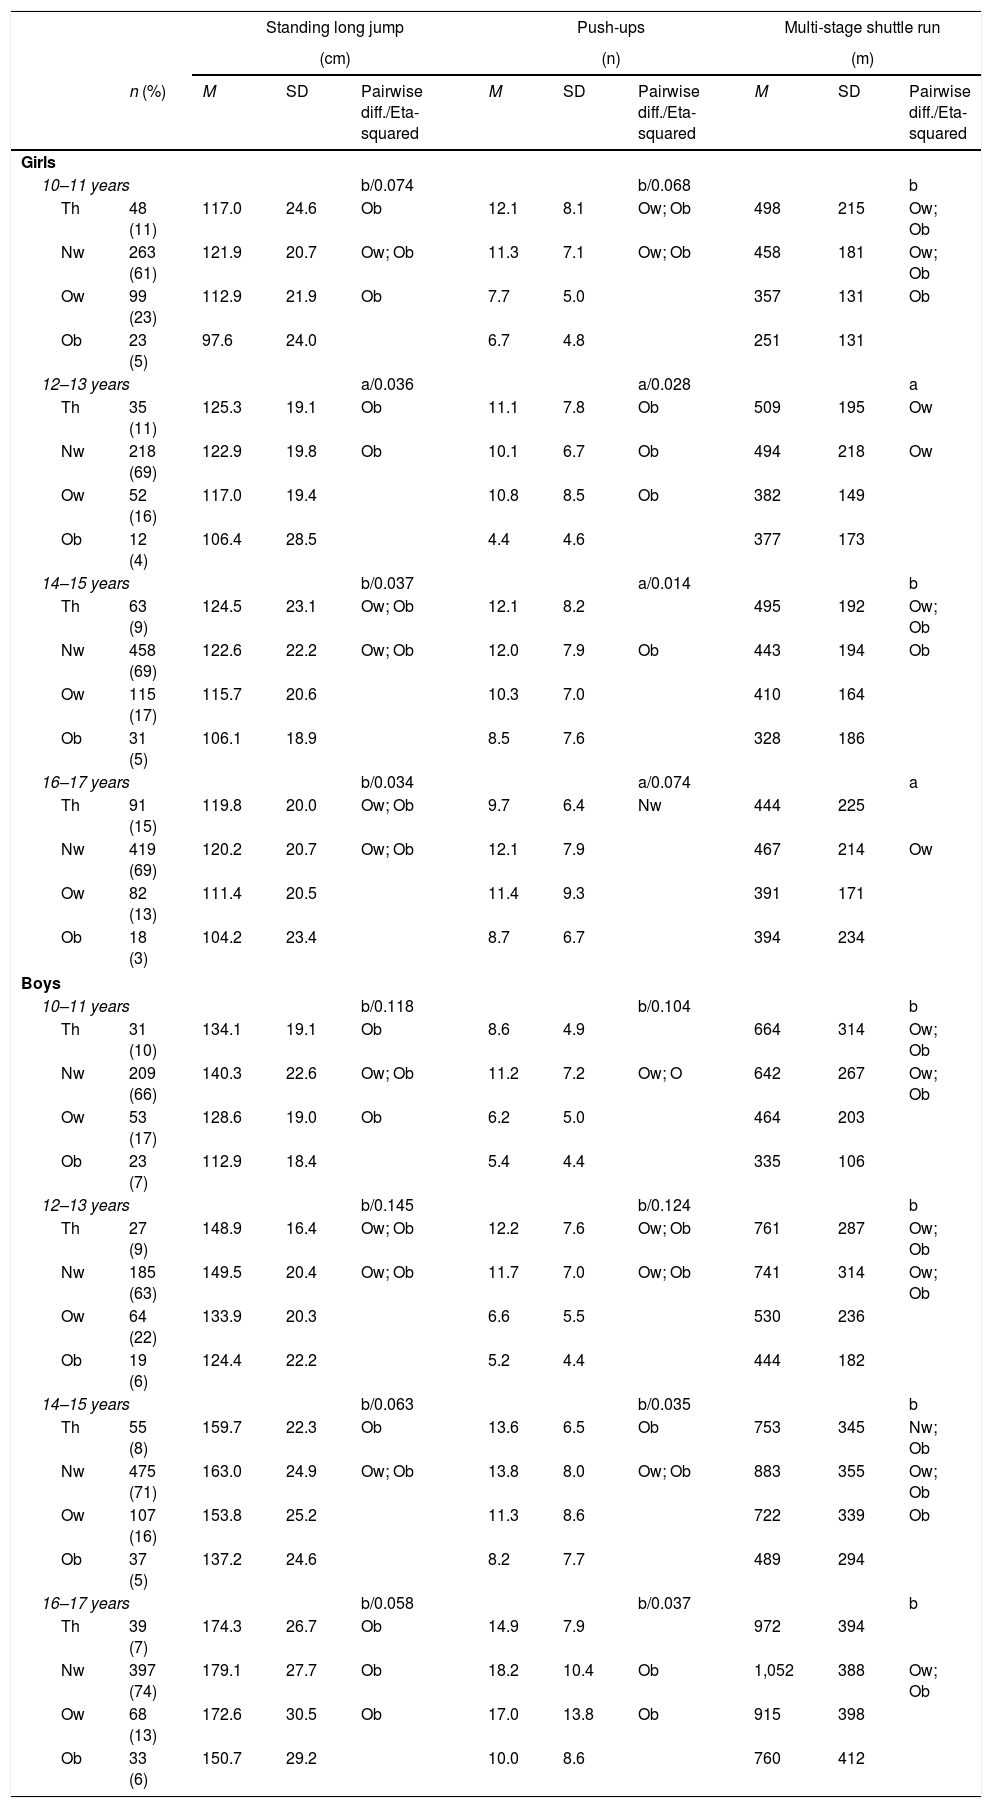
Frequencies and percentages of girls and boys in each age group classified by weight status and descriptive statistics for the three fitness tests are summarized in Table 2. Although there is overlap, performances of thin and normal weight youth in each age group of girls and boys are, with few exceptions, significantly better than those of overweight and obese youth. On the other hand, fitness performances of thin and normal weight youth and of overweight and obese youth did not significantly differ, on average.
Distributions (frequencies and percentages) and physical fitness performance in each physical fitness item of girls and boys by weight status within age groups. Summary of ANOVA results for differences between weight status in each physical fitness item within each sex (only the significant pairwise differences are shown).
| Standing long jump | Push-ups | Multi-stage shuttle run | ||||||||
|---|---|---|---|---|---|---|---|---|---|---|
| (cm) | (n) | (m) | ||||||||
| n (%) | M | SD | Pairwise diff./Eta-squared | M | SD | Pairwise diff./Eta-squared | M | SD | Pairwise diff./Eta-squared | |
| Girls | ||||||||||
| 10–11 years | b/0.074 | b/0.068 | b | |||||||
| Th | 48 (11) | 117.0 | 24.6 | Ob | 12.1 | 8.1 | Ow; Ob | 498 | 215 | Ow; Ob |
| Nw | 263 (61) | 121.9 | 20.7 | Ow; Ob | 11.3 | 7.1 | Ow; Ob | 458 | 181 | Ow; Ob |
| Ow | 99 (23) | 112.9 | 21.9 | Ob | 7.7 | 5.0 | 357 | 131 | Ob | |
| Ob | 23 (5) | 97.6 | 24.0 | 6.7 | 4.8 | 251 | 131 | |||
| 12–13 years | a/0.036 | a/0.028 | a | |||||||
| Th | 35 (11) | 125.3 | 19.1 | Ob | 11.1 | 7.8 | Ob | 509 | 195 | Ow |
| Nw | 218 (69) | 122.9 | 19.8 | Ob | 10.1 | 6.7 | Ob | 494 | 218 | Ow |
| Ow | 52 (16) | 117.0 | 19.4 | 10.8 | 8.5 | Ob | 382 | 149 | ||
| Ob | 12 (4) | 106.4 | 28.5 | 4.4 | 4.6 | 377 | 173 | |||
| 14–15 years | b/0.037 | a/0.014 | b | |||||||
| Th | 63 (9) | 124.5 | 23.1 | Ow; Ob | 12.1 | 8.2 | 495 | 192 | Ow; Ob | |
| Nw | 458 (69) | 122.6 | 22.2 | Ow; Ob | 12.0 | 7.9 | Ob | 443 | 194 | Ob |
| Ow | 115 (17) | 115.7 | 20.6 | 10.3 | 7.0 | 410 | 164 | |||
| Ob | 31 (5) | 106.1 | 18.9 | 8.5 | 7.6 | 328 | 186 | |||
| 16–17 years | b/0.034 | a/0.074 | a | |||||||
| Th | 91 (15) | 119.8 | 20.0 | Ow; Ob | 9.7 | 6.4 | Nw | 444 | 225 | |
| Nw | 419 (69) | 120.2 | 20.7 | Ow; Ob | 12.1 | 7.9 | 467 | 214 | Ow | |
| Ow | 82 (13) | 111.4 | 20.5 | 11.4 | 9.3 | 391 | 171 | |||
| Ob | 18 (3) | 104.2 | 23.4 | 8.7 | 6.7 | 394 | 234 | |||
| Boys | ||||||||||
| 10–11 years | b/0.118 | b/0.104 | b | |||||||
| Th | 31 (10) | 134.1 | 19.1 | Ob | 8.6 | 4.9 | 664 | 314 | Ow; Ob | |
| Nw | 209 (66) | 140.3 | 22.6 | Ow; Ob | 11.2 | 7.2 | Ow; O | 642 | 267 | Ow; Ob |
| Ow | 53 (17) | 128.6 | 19.0 | Ob | 6.2 | 5.0 | 464 | 203 | ||
| Ob | 23 (7) | 112.9 | 18.4 | 5.4 | 4.4 | 335 | 106 | |||
| 12–13 years | b/0.145 | b/0.124 | b | |||||||
| Th | 27 (9) | 148.9 | 16.4 | Ow; Ob | 12.2 | 7.6 | Ow; Ob | 761 | 287 | Ow; Ob |
| Nw | 185 (63) | 149.5 | 20.4 | Ow; Ob | 11.7 | 7.0 | Ow; Ob | 741 | 314 | Ow; Ob |
| Ow | 64 (22) | 133.9 | 20.3 | 6.6 | 5.5 | 530 | 236 | |||
| Ob | 19 (6) | 124.4 | 22.2 | 5.2 | 4.4 | 444 | 182 | |||
| 14–15 years | b/0.063 | b/0.035 | b | |||||||
| Th | 55 (8) | 159.7 | 22.3 | Ob | 13.6 | 6.5 | Ob | 753 | 345 | Nw; Ob |
| Nw | 475 (71) | 163.0 | 24.9 | Ow; Ob | 13.8 | 8.0 | Ow; Ob | 883 | 355 | Ow; Ob |
| Ow | 107 (16) | 153.8 | 25.2 | 11.3 | 8.6 | 722 | 339 | Ob | ||
| Ob | 37 (5) | 137.2 | 24.6 | 8.2 | 7.7 | 489 | 294 | |||
| 16–17 years | b/0.058 | b/0.037 | b | |||||||
| Th | 39 (7) | 174.3 | 26.7 | Ob | 14.9 | 7.9 | 972 | 394 | ||
| Nw | 397 (74) | 179.1 | 27.7 | Ob | 18.2 | 10.4 | Ob | 1,052 | 388 | Ow; Ob |
| Ow | 68 (13) | 172.6 | 30.5 | Ob | 17.0 | 13.8 | Ob | 915 | 398 | |
| Ob | 33 (6) | 150.7 | 29.2 | 10.0 | 8.6 | 760 | 412 | |||
M, mean; SD, standard deviation; ANOVA, analysis of variance; diff., differences; a, significant for p<0.01; b, significant for p<0.001; Th, thin; Nw, normal weight; Ow, overweight; Ob, obese.
Results of the quadratic regressions for each fitness test are illustrated by age group for girls and boys, respectively, in Fig. 1; the respective equation models are also included. Although the common variance was relatively low (R2 ranges from 2% to 16%), several trends are suggested.

Performances in the standing long jump show a curvilinear relationship with the BMI in the four age groups of boys, although the relationship among boys 12–13 years of age is not as well defined, as in the other age groups. Among girls, the relationship between performance in the standing long jump and the BMI is curvilinear among girls aged 10–11 and 12–13 years, but is linear among girls aged 14–15 and 16–17 years.
Performances in the push-up test show a well-defined curvilinear relationship with the BMI in boys aged 10–11, 14–15, and 16–17 years, but a linear relationship in boys aged 12–13 years. The relationship between push-up performance and the BMI is linear in girls aged 10–11 years, but is curvilinear in the three older age groups.
The relationship between the BMI and performance on the multistage shuttle run is markedly curvilinear in older boys aged 14–15 and 16–17 years, but is linear in younger boys at 10–11 and 12–13 years. In contrast, there is little consistency in relationships between the BMI and multistage shuttle run among the four age groups of girls. The relationship is linear among girls aged 10–11 and 14–15 years, with performances declining with an increasing BMI. The relationships among girls aged 12–13 years and 16–17 years are curvilinear, but the directions of the effects of the BMI on performance are variable. Among younger girls, distances covered in the multistage shuttle run are lower among girls with a BMI in the mid-range, and are greater among girls with BMIs at the lower and higher ends of the distributions; nevertheless, thin girls had significant better performances than overweight and obese girls. The reverse is the case among girls at 16–17 years of age. Distances covered are greater in the mid-range of the BMI distribution and are especially lower at the high end of the BMI distribution.
DiscussionCardiovascular fitness (endurance shuttle run), explosive power (standing long jump), and muscular strength and endurance (push-ups) improved, on average, with age in Brazilian boys, but were relatively stable in Brazilian girls. The trends were generally consistent with other studies of adolescents.19 Moreover, fitness levels of overweight and obese youth of both sexes were lower than fitness levels of normal weight and thin youth, consistent with observations of reduced levels of health-related fitness in overweight and obese youth.20,21
Performances on the endurance shuttle run and standing long jump were, on average, better among boys than girls across the age range. Given the difference in protocols, comparison of push-ups between boys and girls is not warranted. In contrast to fitness, the BMI overlapped, on average, between boys and girls across the age range.
Across the entire range of BMIs within each age group, relationships between BMI and physical fitness varied between boys and girls, within each sex, and among the test items. In most age groups, the relationship tended to be curvilinear (parabolic); better performances were attained by adolescents in the mid-range of the BMI distribution, while performances of youth at the low and high ends of the BMI distribution were lower.
The trends noted in Brazilian youth were generally consistent with those observed in Taiwanese youth aged 9–18 years for the standing long jump, sit-ups, and 800/1600m run/walk,15 more so among boys than among girls and allowing for the different tests of muscular strength and endurance (push-ups vs. sit-ups) and cardiovascular endurance (20m endurance shuttle run vs. 800/1600m run/walk). The same analytical strategy was used in both studies.
The association between the BMI and standing long jump was the same in both Brazilian and Taiwanese boys, i.e., a generally curvilinear relationship across adolescence. Note, however, that in Taiwanese boys aged 9–10 years, the association was linear.
The association between the endurance shuttle and BMI was linear among Brazilian boys at 10–11 and 12–13 years of age, and curvilinear at 14–15 and 16–17 years (Fig. 1). Among Taiwanese boys, the trend for the 800m run/walk was also linear at 9–10 and 11–12 years, and was curvilinear at 13–15 and 16–18 years. Thus among older adolescent Brazilian and Taiwanese boys, better cardiovascular performances were observed among boys with BMIs in the mid-range of the distributions.
Allowing for the different measures of muscular strength and endurance, associations with the BMI were generally similar in the Brazilian (push-ups) and Taiwanese (sit-ups) boys. The associations in both samples were curvilinear across the adolescent age range, except for Brazilian boys 12–13 years, among whom the relationship was linear.
In contrast to boys, there was more variability in the association between the BMI and indicators of fitness in girls. For the standing long jump, a curvilinear pattern was apparent in Brazilian girls at 10–11 and 12–13 years and also in Taiwanese girls at 11–12 and 13–15 years. However, among Brazilian girls at 14–15 and 16–17 years, the association between the BMI and jumping performance was linear, i.e., performances declined from a low to a high BMI, which contrasted the curvilinear trend in Taiwanese girls aged 16–18 years.
The association between the BMI and the endurance shuttle run also varied among age groups in Brazilian girls. The relationship was generally linear at 10–11 and 14–15 years, but was curvilinear at 12–13 and 16–17 years. Among girls 12–13 years, however, the relationships was inverted, i.e., better performances were indicated among girls at the low and high ends of the BMI distribution, whereas among girls at 16–17 years, better performances were indicated among girls in the mid-range of the BMI distribution. Among Taiwanese girls, the association between the 800 meter run/walk and BMI was linear at 9–10 years but curvilinear at 11–12, 13–15, and 16–18 years. In the latter three age groups, better performances were noted among girls in the low and mid-range of the BMI distributions.
Allowing for the different indicators of muscular strength and endurance, relationships with the BMI were generally similar in the two studies. Among Brazilian girls 11–12 years, the association between modified push-up performances and the BMI was linear, but the relationship was curvilinear in the three older age groups. Among Taiwanese girls, the relationships between sit-up performances and the BMI were curvilinear across the ages groups considered.
Relationships between the BMI and composite fitness scores have also been considered. Among the Taiwanese youth aged 9–18 years8 and Chinese youth aged 7–18 years,22 the relationship was consistently curvilinear, i.e., there were better overall fitness scores among youth in the mid-range compared to the low and high ranges of the BMI distribution.
Nevertheless, there are some components of the fitness batteries that deviate from the suggested trends. For example, both thin and obese Spanish youth 13–18 years had, in general, reduced levels of fitness in most tests,23 consistent with observations in the present study (Table 2). This trend, however, was not apparent in all fitness tests. For example, in an upper body strength test in which the body was suspended (bent arm hang), thin subjects performed better than normal weight, overweight, or obese youths, while in grip strength, which does not require support or movement of body mass, overweight and obese youth performed better than their thin and normal weight peers.23 By inference, care is warranted in generalizing about relationships between the BMI and specific fitness tests among youth.
Allowing for different analytical strategies, several studies have shown a negative relationship between the BMI and fitness or motor performances among youth. For example, performances on the push-up, sit-up, and 9-min run tests declined, on average, from normal weight to overweight to obese Hong Kong adolescents,24 while performances on motor coordination tests were negatively associated with BMI across childhood.21 From another perspective, the highest levels of fitness were noted among school children with a healthy BMI,25 while a lower BMI contributed with other variables to better aerobic capacity in Taiwanese children 7–8 years.26
BMI is largely used as a proxy measure of excess weight because it is a practical measure and is less intrusive than more direct measures such as skinfolds. As recommended by the IOTF, BMI can also be used as an indicator of nutritional status, specifically at the low end of the distribution. Although BMI has limitations, it is a concept that is easily understood by the general public.
The focus of the relationship between BMI and physical fitness is often on the negative influence of weight status on fitness.8 This likely reflects concerns for the relatively high prevalence of overweight and obesity among the youth in many countries.27 Most existing studies postulate a linear relationship between BMI and fitness, particularly when dealing with overweight/obese individuals.5–7 As such, the studies do not address the full range of variability of the BMI. Obesity and thinness represent opposite extremities of the weight status spectrum. The major goal in the present study was to show that physical fitness is in part dependent on weight status, can be negatively influenced by a high BMI (likely excess body fat), and can also be negatively influenced by a low BMI (reduced lean tissue mass). As the evidence suggests, the consideration of fitness across the total spectrum of the BMI in this sample of Brazilian youth indicates a curvilinear relationship, consistent with other studies. Unfortunately, skinfold thickness was not measured. An earlier study of young adult males indicated a linear, negative relationship between the sum of skinfolds and a fitness index, i.e., higher fitness among subjects with the lowest sum of skinfolds.28
Regrettably, an indicator of biological maturity status of the youth was not available. This is a limitation, as individual differences in the timing and tempo of growth spurts in height and weight could influence the BMI per se, and in turn influence relationships between the BMI and measures of fitness in early and mid-adolescence. In addition, body weight, lean tissue mass, fat mass, and muscular strength have their own growth spurts which, on average, reach their maximum velocity after the peak velocity of height growth.29,30 Nevertheless, data were analyzed in relatively narrow age groups, which perhaps reduced the potential influence of inter-individual differences in biological maturity status.
In summary, samples comprising many studies of BMI and fitness among youths are often limited in the range of BMIs represented. Quite often, studies focus on the overweight-obese range compared to the normal range of the BMI distribution. The sample of the present study spanned the BMI spectrum, as about 10% of the youth were classified as thin, 17% were classified as overweight, and 5% were classified as obese. In most of age groups, and in boys more so than girls, the relationship between BMI and physical fitness tests was curvilinear, with normal weight youths having better fitness test performances.
FundingThe first author was supported by the Portuguese Foundation for Science and Technology under grants DTP/04045/2013, POCI-01-0145-FEDER-006969, and UID/DTP/00617/2013; and by NORTE 2020 under the grant NanoSTIMA: Macro-to-Nano Human Sensing: Towards Integrated Multimodal Health Monitoring and Analytics, NORTE-01-0145-FEDER-000016.
Conflicts of interestThe authors declare no conflicts of interest.
Please cite this article as: Lopes VP, Malina RM, Gomez-Campos R, Cossio-Bolaños M, Arruda M, Hobold E. Body mass index and physical fitness in Brazilian adolescents. J Pediatr (Rio J). 2019;95:358–65.


