
To assess whether the indicators of weight status body mass index and waist-to-height ratio are similar to body fat percentage to identify obese children and adolescents with unfavorable lipid profile.
MethodsThis was a cross-sectional study involving 840 children and adolescents (6–18 years). The same individuals were classified as non-obese (95) or obese (≥P95) according to body fat percentage and indicators of weight status, body mass index, and waist-to-height ratio. Body fat percentage was obtained by multi-frequency bioelectrical impedance. Linear association between obesity and increased lipid fractions was tested by ANCOVA. Normal distribution curves of non-HDL cholesterol were designed for obese and non-obese. To provide the proportion of obese individuals with elevated non-HDL-c across all indicators, Z-score was calculated.
ResultsObese boys presented higher non-HDL cholesterol when compared with those non-obese, classified by body mass index (107±28 vs. 94±25mg/dL, p=0.001), waist-to-height ratio (115±29 vs. 94±25mg/dL, p<0.001) and body fat percentage (119±33 vs. 94±24mg/dL, p<0.001). Differently, obese girls presented with higher non-HDL cholesterol when compared with those non-obese only according to the body fat percentage classification (118±24 vs. 96±26mg/dL, p=0.001). A large shift to the right in the distribution curve of non-HDL cholesterol among obese girls compared with non-obese was observed only when body fat percentage was used to discriminate between obese and non-obese.
ConclusionBody fat percentage was better than the indicators of weight status to identify children and adolescents with unfavorable lipid profile, mainly among girls.
Investigar se os indicadores da condição do peso, índice de massa corporal e razão cintura/estatura são semelhantes ao percentual de gordura corporal para identificação de crianças e adolescentes obesos com perfil lipídico desfavorável.
MétodosEstudo transversal que envolveu 840 crianças e adolescentes (6-18 anos). Os mesmos indivíduos foram classificados em não obesos (p<95) ou obesos (p≥95) de acordo com o percentual de gordura corporal e os indicadores da condição do peso, índice de massa corporal e razão cintura/estatura. O percentual de gordura corporal foi obtido por bioimpedância multifrequencial tetrapolar. A associação linear entre obesidade e aumento das frações lipídicas foi tesada por ANCOVA. As curvas de distribuição normal de colesterol não HDL foram construídas para obesos e não obesos. Para fornecer a proporção de indivíduos obesos com colesterol não HDL elevado para todos os indicadores, o escore z foi calculado.
ResultadosOs meninos obesos apresentaram maior colesterol não HDL em comparação com não obesos de acordo com a classificação fornecida pelo índice de massa corporal (107±28 em comparação com 94±25mg/dL, p=0,001), razão cintura/estatura (115±29 em comparação com 94±25mg/dL, p<0,001) e percentual de gordura corporal (119±33 em comparação com 94±24g/dL, p<0,001). Diferentemente, as meninas obesas apresentaram maior colesterol não HDL em comparação com as não obesas, somente de acordo com a classificação fornecida pelo percentual de gordura corporal (118±24 em comparação com 96±26mg/dL, p=0,001). Um grande deslocamento para a direita na curva de distribuição de colesterol não HDL entre meninas obesas em comparação com não obesas foi observado somente quando o percentual de gordura corporal foi utilizado para discriminar obesas e não obesas.
ConclusãoO percentual de gordura corporal é melhor do que os indicadores da condição do peso na identificação de crianças e adolescentes com perfil lipídico desfavorável, principalmente entre meninas.
Lipoprotein disorders, such as high serum concentrations of low-density lipoprotein cholesterol (LDL-c) and triglycerides (TG) and low concentration of high-density lipoprotein cholesterol (HDL-c), are independent risk factors to the development of atherosclerosis and coronary artery disease.1 In addition to traditional lipid markers, recent studies have suggested that non-HDL-c was a better predictor for the severity of coronary atherosclerosis and major adverse cardiovascular events when compared with LDL-c.2,3 Regarding the association between obesity and dyslipidemia, worldwide studies have confirmed that an unfavorable lipid profile is more prevalent in overweight and obese than in normal weight children and adolescents.4–7Data from the Bogalusa Heart Study8 have shown that, as BMI-for-age increases, a marked increase is observed in the proportion of children with multiple metabolic risk factors. Although BMI is recognized as an important prognostic indicator of diabetes and heart disease,9 its appropriateness as a phenotypic marker of adiposity has been challenged, as it does not estimate body composition and cannot differentiate between fat and muscle in children.10 Furthermore, studies have suggested that waist-to-height ratio (WHtR) was a better predictor of cardiovascular and metabolic risk11–14 although the substantial heterogeneity among studies warrants further investigations.15
Recently, a meta-analysis of studies investigating the association between body fat assessed by dual energy X-ray absorptiometry (DEXA, the gold standard for assessing body composition) with either BMI or WHtR revealed that both indicators of weight status may be useful in defining adiposity among children and adolescents.16 However, little is known on whether these indicators of weight status are equivalent as body fatness surrogates to discriminate individuals with unfavorable lipid profile. Therefore, this study sought to investigate whether BMI and WHtR are similar to body fat percentage (BFP) in the identification of obese children and adolescents with unfavorable lipid profile.
MethodsStudy design and sample selectionThis was a cross-sectional study conducted with data from a convenience sample. Variables of interest were drawn from the database of the project entitled “Determinantes da elevação da pressão arterial em crianças e adolescentes de diferentes ancestralidades.”
The sample came from a social project called “Estação Conhecimento,” in Serra, Espírito Santo State, Brazil. At the time of data collection, about 900 children and adolescents were enrolled in this institution, which provides free academic support and the opportunity to practice sports and perform artistic activities.
From February 2014 to April 2016, participants attended the Cardiovascular Investigation Clinic (CIC) located at the “Hospital Universitário Cassiano Antônio de Moraes” (HUCAM-UFES) to undergo clinical and laboratory exams. The exams were carried out in the morning after overnight fasting. All data were collected in a single visit by a trained staff previously certified by the senior investigator (JGM). To the present analysis, 16 participants with missing data in the database were excluded.
The project was approved by the Center for Health Sciences Ethic Committee (register number: 30385014.8.0000.5060) and written informed consent was obtained from parents or legal guardians before enrollment.
AnthropometryWeight was measured using an electronic scale with 0.05kg precision (Toledo, Brazil) in barefoot individuals using only undergarments. Height was obtained in a wall-mounted stadiometer (Seca Stadiometer − Seca GmBH & Co, Hamburg, Germany) with 0.1cm precision. Body fat percentage (BFP) was measured by multi-frequency bioelectrical impedance analysis (MF-BIA8, InBody 230, Bioespace, South Korea). BMI was calculated as the ratio between weight and height squared. Waist circumference was measured at the top of the iliac crest. WHtR was obtained as the ratio between waist circumference and height.
As body fat accumulation is influenced by age and sex, the BMI-for-age percentiles for boys and girls were established in accordance with the standards of the Centers for Disease Control and Prevention for children and teenagers from 2 to 19 years of age.17 Corresponding age- and sex-specific BFP and WHtR percentiles were also obtained. Subsequently, the same individuals were classified as non-obese (95) or obese (≥P95) by using BFP and indicators of weight status (BMI and WHtR).
Biochemical examinationBlood collection was obtained by venipuncture after overnight fasting (8–14h) and sent to a central laboratory (Laboratório Tommasi − Vitória, Brazil) to determine serum concentrations of total cholesterol (Chol), LDL-c, HDL-c, TG, and fasting glucose. LDL-c was calculated by the Friedwald's equation for those with TG≤400mg/dL. Non-HDL-c was calculated as total cholesterol minus HDL-c. The cut-off value for non-HDL-c (144mg/dL) was obtained from the I Brazilian Guidelines for Cardiovascular Prevention.18 All dosages were performed with commercially available kits.
Blood pressure measurementSystolic blood pressure (SBP), diastolic blood pressure (DBP), and heart rate (HR) were obtained by using an automatic validated device (Omrom 705CP − Intellisense, Japan), with the cuff positioned in the left arm after a resting period of 5min in the sitting position. Three measures were taken with 1-min rest between them. The result for the first measure was discarded, and the mean between measures 2 and 3 was calculated. In case of a variation of more than 5mmHg between measures 2 and 3, a fourth measure was performed, and the two measures with a difference closer to 5mmHg averaged.
Statistical analysisCharacteristics of the sample were expressed as mean±standard deviation. Differences in general characteristics between sexes were tested with two-tailed t-test. Anthropometric characteristics were compared between obese and non-obese subjects with two-sample t-test and the association between obesity and lipid fractions was tested with ANCOVA using age, SBP, and HR as covariates.
Normality of all data was confirmed with the Kolmogorov–Smirnov test. Data were fitted so that normalized curves could be designed to compare the calculated Z-scores with standardized cut-off. Considering the properties of the standard normal distribution, 3.00 standard deviations (SD) to the left or right of a mean covered 99.76% of a population. Means and adjusted distribution (Z-score) were used to identify the proportion of children and adolescents with non-HDL-c above the cut-off value (144mg/dL). Obese individuals were compared with their non-obese peers across the three indicators.
All statistical calculations were performed with SPSS 21.0 statistical package (SPSS Inc., Chicago, Illinois, USA) and normalized curves for non-HDL-c were designed with GraphPad Prism 6.01 (GraphPad Software, Inc., CA, USA). Statistical power was calculated using R software version 3.2.2 (R Foundation for Statistical Computing, Vienna, Austria). Statistical significance was set at p<0.05.
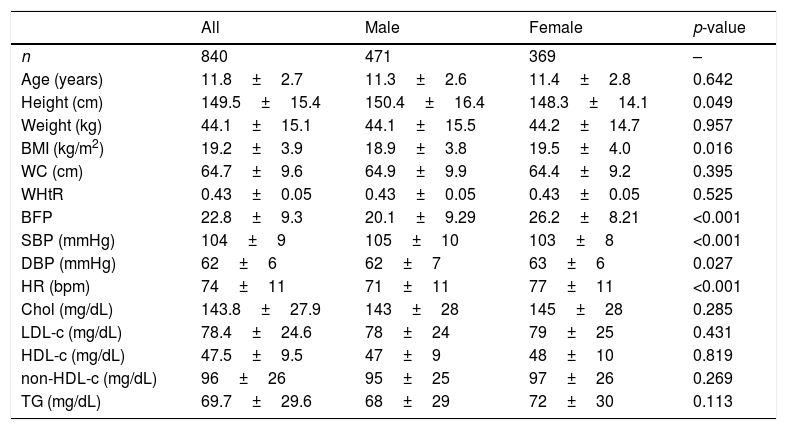
ResultsTable 1 presents the general characteristics of the sample stratified by sex1. As expected, taller height was observed among boys when compared with girls. Although WHtR was similar between sexes, both BMI and BFP were higher in girls when compared with boys (p<0.05).
General characteristics of the sample.
| All | Male | Female | p-value | |
|---|---|---|---|---|
| n | 840 | 471 | 369 | – |
| Age (years) | 11.8±2.7 | 11.3±2.6 | 11.4±2.8 | 0.642 |
| Height (cm) | 149.5±15.4 | 150.4±16.4 | 148.3±14.1 | 0.049 |
| Weight (kg) | 44.1±15.1 | 44.1±15.5 | 44.2±14.7 | 0.957 |
| BMI (kg/m2) | 19.2±3.9 | 18.9±3.8 | 19.5±4.0 | 0.016 |
| WC (cm) | 64.7±9.6 | 64.9±9.9 | 64.4±9.2 | 0.395 |
| WHtR | 0.43±0.05 | 0.43±0.05 | 0.43±0.05 | 0.525 |
| BFP | 22.8±9.3 | 20.1±9.29 | 26.2±8.21 | <0.001 |
| SBP (mmHg) | 104±9 | 105±10 | 103±8 | <0.001 |
| DBP (mmHg) | 62±6 | 62±7 | 63±6 | 0.027 |
| HR (bpm) | 74±11 | 71±11 | 77±11 | <0.001 |
| Chol (mg/dL) | 143.8±27.9 | 143±28 | 145±28 | 0.285 |
| LDL-c (mg/dL) | 78.4±24.6 | 78±24 | 79±25 | 0.431 |
| HDL-c (mg/dL) | 47.5±9.5 | 47±9 | 48±10 | 0.819 |
| non-HDL-c (mg/dL) | 96±26 | 95±25 | 97±26 | 0.269 |
| TG (mg/dL) | 69.7±29.6 | 68±29 | 72±30 | 0.113 |
BMI, body mass index; WC, waist circumference; WHtR, waist-to-height ratio; BFP, body fat percentage; SBP, systolic blood pressure; DBP, diastolic blood pressure; HR, heart rate; Chol, total cholesterol; LDL-c, low-density lipoprotein cholesterol; HDL-c, high-density lipoprotein cholesterol; non-HDL-c, total cholesterol minus HDL-c; TG, triglicerydes.
Data are expressed as mean±SD, p<0.05 for statistical significance.
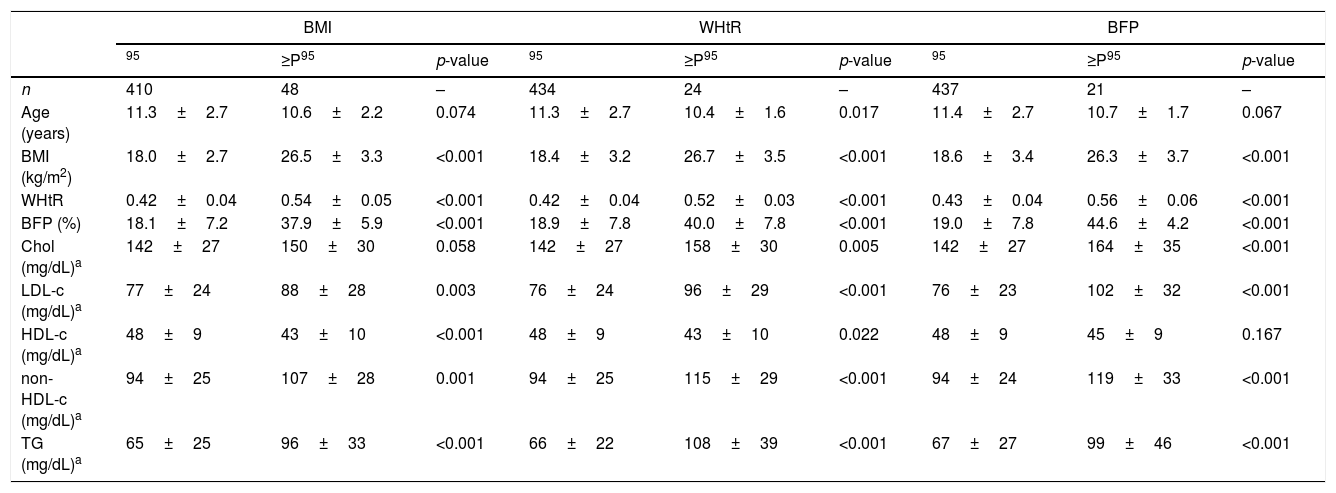
Table 2 shows the anthropometric characteristics and lipid profile among boys who were classified as obese or non-obese according to the three indicators. Age was similar and, as expected, BMI, WHtR, and BFP were higher in obese individuals when compared with their non-obese peers across all indicators. Among those individuals classified according to BMI, higher LDL-c (p=0.003), non-HDL-c (p=0.001), and TG (p<0.001), as well as lower HDL-c (p<0.001) was observed in obese individuals when compared with their non-obese peers, even after adjustment for age, SPB, and HR. Similar results were observed when the individuals were classified according to WHtR, in addition to higher Chol in obese compared with non-obese (p=0.005). Moreover, Chol, LDL-c, non-HDL, and TG were higher (all p<0.001) in individuals classified as obese by BPF when compared with those non-obese, whereas HDL-c was similar between groups.
Anthropometric characteristics and lipid profile according to the different indicators among boys.
| BMI | WHtR | BFP | |||||||
|---|---|---|---|---|---|---|---|---|---|
| 95 | ≥P95 | p-value | 95 | ≥P95 | p-value | 95 | ≥P95 | p-value | |
| n | 410 | 48 | – | 434 | 24 | – | 437 | 21 | – |
| Age (years) | 11.3±2.7 | 10.6±2.2 | 0.074 | 11.3±2.7 | 10.4±1.6 | 0.017 | 11.4±2.7 | 10.7±1.7 | 0.067 |
| BMI (kg/m2) | 18.0±2.7 | 26.5±3.3 | <0.001 | 18.4±3.2 | 26.7±3.5 | <0.001 | 18.6±3.4 | 26.3±3.7 | <0.001 |
| WHtR | 0.42±0.04 | 0.54±0.05 | <0.001 | 0.42±0.04 | 0.52±0.03 | <0.001 | 0.43±0.04 | 0.56±0.06 | <0.001 |
| BFP (%) | 18.1±7.2 | 37.9±5.9 | <0.001 | 18.9±7.8 | 40.0±7.8 | <0.001 | 19.0±7.8 | 44.6±4.2 | <0.001 |
| Chol (mg/dL)a | 142±27 | 150±30 | 0.058 | 142±27 | 158±30 | 0.005 | 142±27 | 164±35 | <0.001 |
| LDL-c (mg/dL)a | 77±24 | 88±28 | 0.003 | 76±24 | 96±29 | <0.001 | 76±23 | 102±32 | <0.001 |
| HDL-c (mg/dL)a | 48±9 | 43±10 | <0.001 | 48±9 | 43±10 | 0.022 | 48±9 | 45±9 | 0.167 |
| non-HDL-c (mg/dL)a | 94±25 | 107±28 | 0.001 | 94±25 | 115±29 | <0.001 | 94±24 | 119±33 | <0.001 |
| TG (mg/dL)a | 65±25 | 96±33 | <0.001 | 66±22 | 108±39 | <0.001 | 67±27 | 99±46 | <0.001 |
BMI, body mass index; WHtR, waist-to-height ratio; BFP, body fat percentage; P95, 95th percentile; Chol, total cholesterol; LDL-c, low-density lipoprotein cholesterol; HDL-c, high-density lipoprotein cholesterol; non-HDL-c, total cholesterol minus HDL-c; TG, triglicerydes.
Data are expressed as mean±SD, p<0.05 for statistical significance.
Table 3 features the anthropometric characteristics and lipid profile among girls who were classified as obese or non-obese according to the three indicators. Comparison between obese and non-obese across the indicators is shown with adjustment for age, SBP, and HR. Higher TG (p=0.001) and lower HDL-c (p=0.025) were observed in individuals classified as obese by BMI when compared with non-obese girls, whereas no significant difference between groups was detected for Chol, LDL-c, and non-HDL-c. When using WHtR as indicator, no significant difference was detected between obese and non-obese individuals for any lipid fraction. Conversely, Chol (p=0.021), LDL-c (p=0.003), non-HDL-c (p=0.001), and TG (p=0.003) were higher and HDL-c was lower (p=0.013) individuals classified as obese by BFP when compared with non-obese girls classified.
Anthropometric characteristics and lipid profile according to the different indicators among girls.
| BMI | WHtR | BFP | |||||||
|---|---|---|---|---|---|---|---|---|---|
| 95 | ≥P95 | p-value | 95 | ≥P95 | p-value | 95 | ≥P95 | p-value | |
| n | 323 | 30 | – | 334 | 19 | – | 334 | 19 | – |
| Age (years) | 11.4±2.8 | 10.8±2.9 | 0.217 | 11.4±2.8 | 10.8±2.8 | 0.439 | 11.5±2.8 | 10.3±2.8 | 0.061 |
| BMI (kg/m2) | 18.8±3.1 | 26.8±4.0 | <0.001 | 19.1±3.4 | 27.0±4.7 | <0.001 | 19.2±3.7 | 25.4±4.2 | <0.001 |
| WHtR | 0.42±0.04 | 0.53±0.03 | <0.001 | 0.43±0.04 | 0.56±0.03 | <0.001 | 0.43±0.05 | 0.52±0.03 | <0.001 |
| BFP (%) | 24.7±7.0 | 40.2±4.5 | <0.001 | 25.5±7.6 | 39.5±8.4 | <0.001 | 25.3±7.3 | 42.5±3.9 | <0.001 |
| Chol (mg/dL)a | 145±29 | 150±27 | 0.328 | 145±29 | 139±25 | 0.393 | 144±29 | 160±26 | <0.021 |
| LDL-c (mg/dL)a | 79±25 | 87±24 | 0.086 | 79±25 | 78±24 | 0.858 | 78±25 | 96±25 | 0.003 |
| HDL-c (mg/dL)a | 48±10 | 44±10 | 0.025 | 48±10 | 43±10 | 0.059 | 48±10 | 42±8 | 0.013 |
| non-HDL-c (mg/dL)a | 97±26 | 106±26 | 0.060 | 97±27 | 96±26 | 0.820 | 96±26 | 118±24 | 0.001 |
| TG (mg/dL)a | 70±29 | 88±38 | 0.001 | 70±29 | 84±37 | 0.063 | 70±29 | 92±41 | 0.003 |
BMI, body mass index; WHtR, waist to height ratio; BFP, body fat percentage; P95, 95th percentile; Chol, total cholesterol; LDL-c, low density lipoprotein cholesterol; HDL-c, high density lipoprotein cholesterol; non-HDL-c, total cholesterol minus HDL-c; TG, triglicerydes.
Data are expressed as mean±SD, p<0.05 for statistical significance.
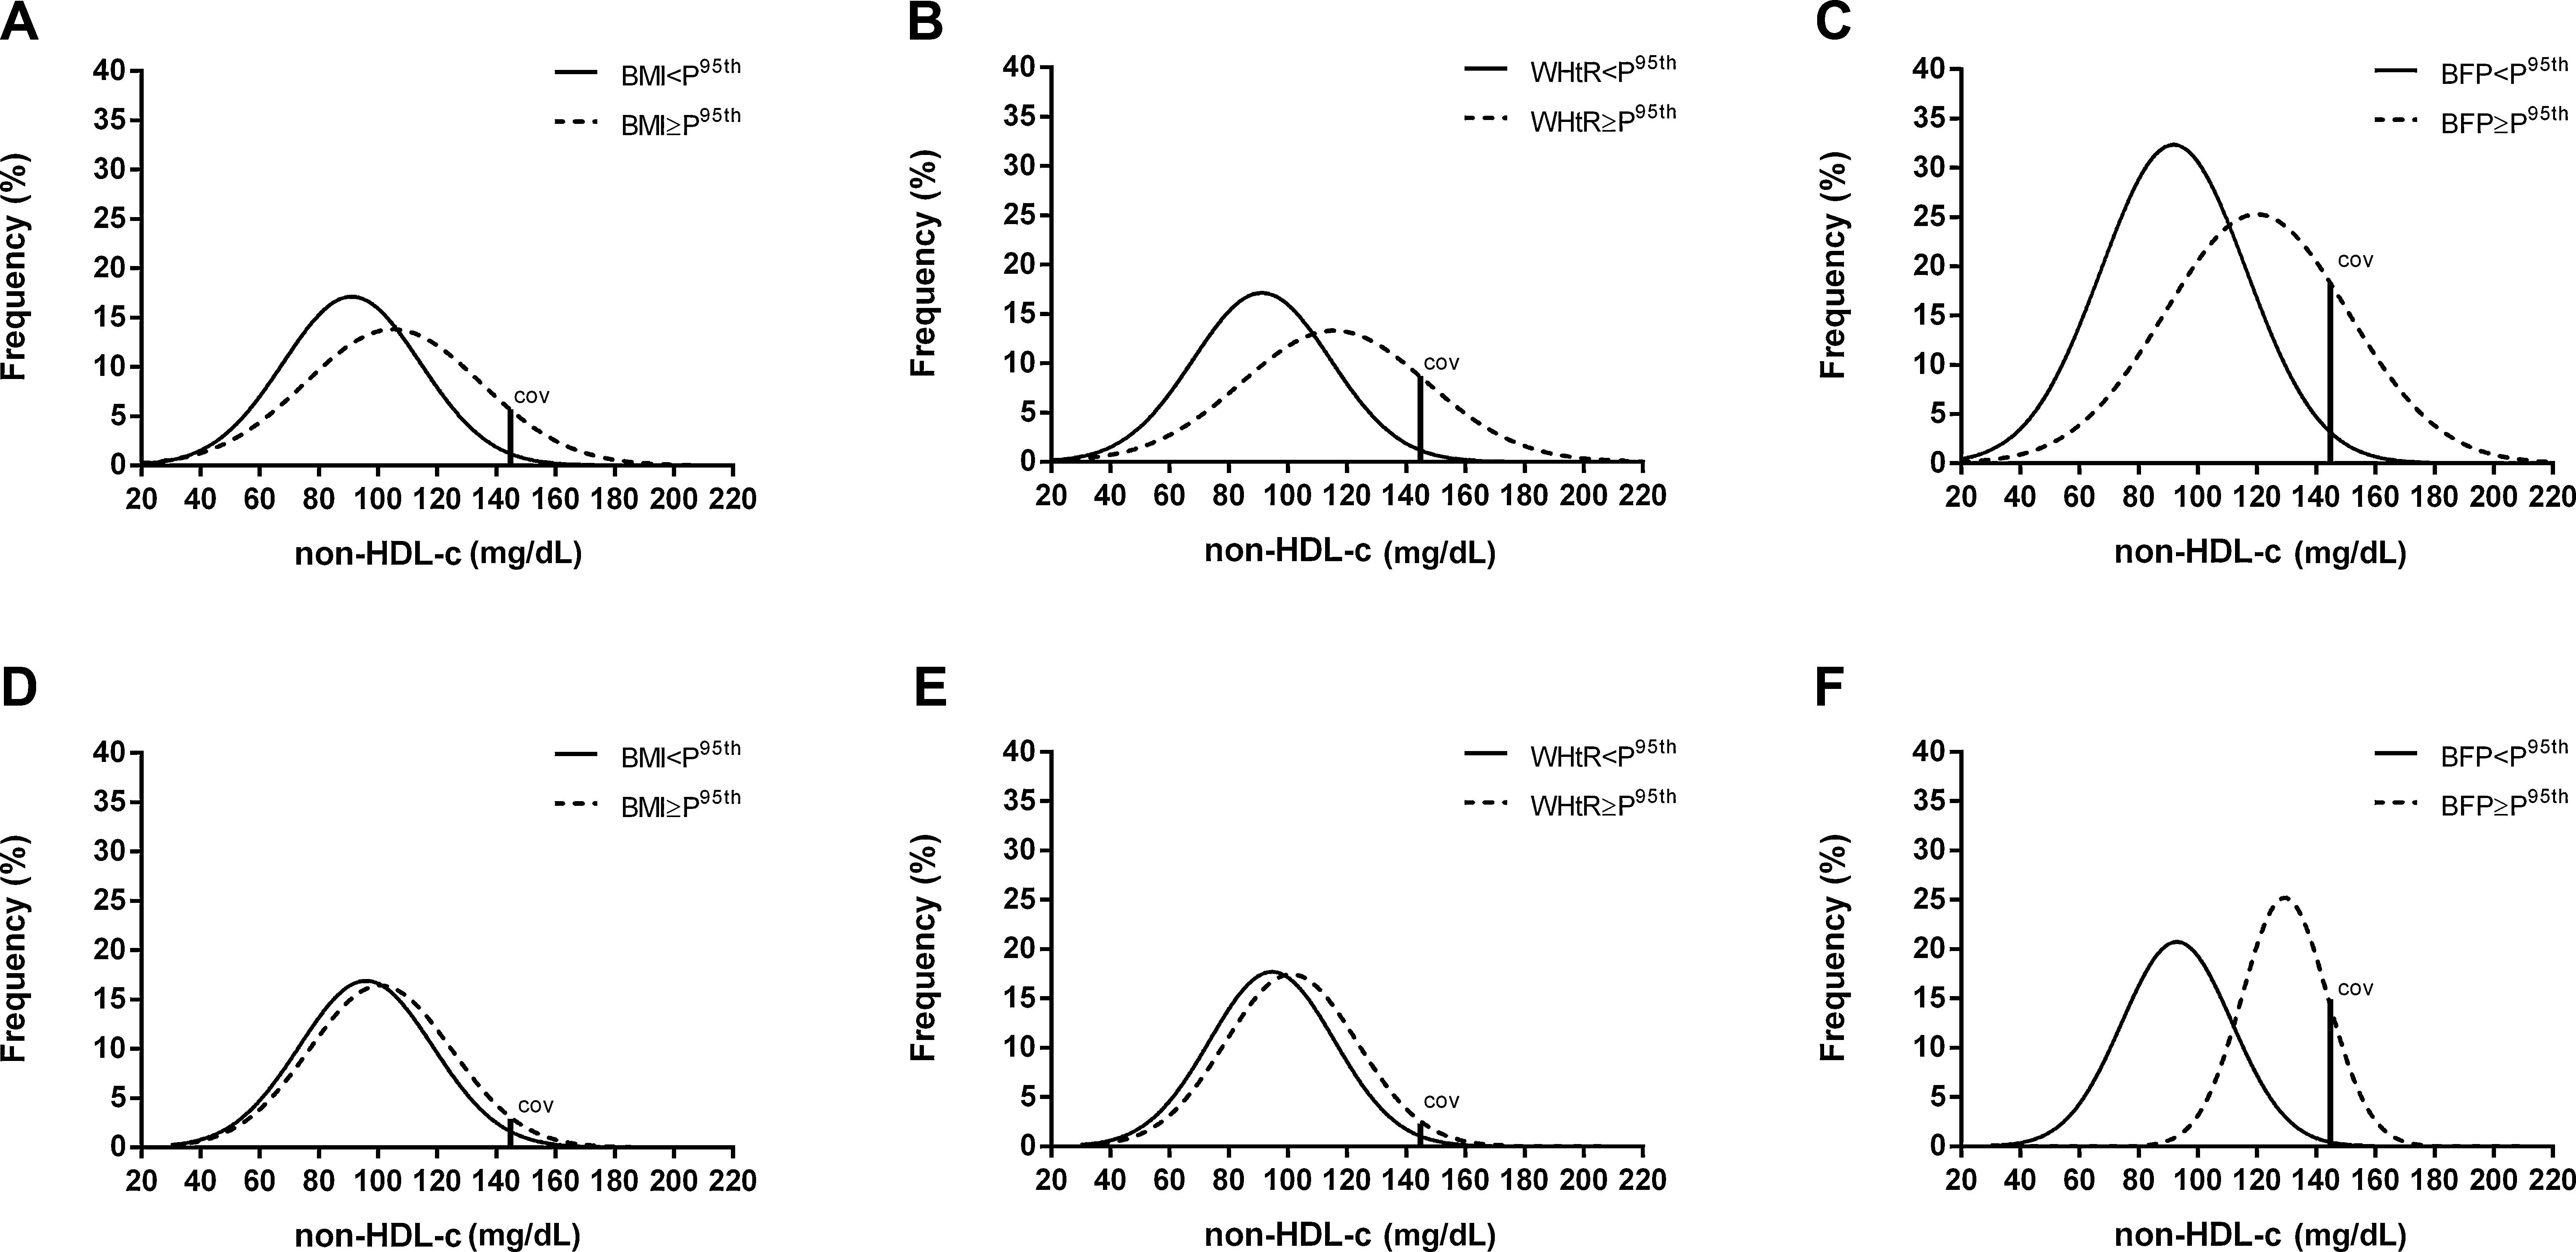
Overlapping normality curves showing the distribution of non-HDL-c in obese and non-obese boys according to the indicators of weight status and BFP are exhibited in the charts of Fig. 1. The shape of the normality curves revealed that not only the means, but also the distribution of non-HDL-c was different in obese individuals when compared with their non-obese peers. Across all indicators, a fair amount of overlapping can be noted (Fig. 1A–C), although the largest shift to the right was observed in the distribution curve of non-HDL-c of obese boys when BFP was the reference indicator (Fig. 1C).
 for non-HDL-c in obese and non-obese boys (A, B, C) and girls (D, E, F) according to the classification provided by BMI, WHtR, and BFP, respectively. BMI, body mass index; WHtR, waist-to-height ratio; BFP, body fat percentage; P95, 95th percentile.")
Normal distribution curves with cut-off value (COV) for non-HDL-c in obese and non-obese boys (A, B, C) and girls (D, E, F) according to the classification provided by BMI, WHtR, and BFP, respectively. BMI, body mass index; WHtR, waist-to-height ratio; BFP, body fat percentage; P95, 95th percentile.
Among girls, normal distribution curves of non-HDL-c of obese and non-obese nearly completely overlapped when using BMI (Fig. 1D) or WHtR as indicators (Fig. 1E). Conversely, a large shift to the right in the distribution curve of non-HDL-c in obese girls was observed when BFP was used to discriminate between obese and non-obese (Fig. 1F). For comparison purposes, among those girls classified as obese by WHtR, the mathematical difference from the mean of non-HDL-c (96mg/dL) to the cut-off (144mg/dL) resulted in a Z-score of 1.85; the area from this point to 3.0 standard deviations to the right covered 3.0% of the values above the cut-off. In turn, among girls classified as obese by BFP, the mathematical difference from the mean of non-HDL-c (118mg/dL) to the cut-off (144mg/dL) resulted in a Z-score of 1.08, and the remaining area to the right covered 13.8% of the values above the cut-off.
Considering the number of individuals in each group to be 40, 22mg/dL as the average mean difference between groups, and 25mg/dL as the average standard deviation in the values of non-HDL-c, the statistical power (calculated post hoc) was 0.98.
DiscussionThe main finding of this study was that among boys, BMI and WHtR were similar to BFP, whereas among girls, BFP was superior to BMI and WHtR regarding the ability to detect the association between obesity and unfavorable lipid profile. In this study, non-HDL-C was preferred over the other fractions because of its usefulness in predicting cardiovascular risk factors.19 Furthermore, non-HDL-C showed better association with measures of body fatness20 and abdominal adiposity.21
The link between excess adiposity and unfavorable lipid profile has been addressed by several recent studies.5–7,22,23 Reuter et al.7 cross-sectionally studied 1234 children and adolescents (7–17 years) from Brazil and reported that dyslipidemia was more prevalent in unfit and overweight/obese boys and girls, even after adjustment for age. In a ten-year follow-up conducted with Chinese children and adolescents (6–18 years),5 a significant trend of increasing mean serum levels of Chol, TG, LDL-C, and non-HDL-C has been observed; except for Chol, the lipid profile was worsened in obese individuals.
In the present study, in addition to the mean values, the distribution of non-HDL-c levels was shown to be affected by obesity, albeit in a different degree among boys depending on the reference indicator. In turn, among girls, obese and non-obese individuals presented with nearly superposed distribution curves of non-HDL-c levels when BMI and WHtR were used, whereas obese subjects presented a large shift to the right in the distribution curve of non-HDL-c levels when BFP was used. This gender difference could be happened because non-HDL-c curve has a shorter tail to the right among girls (i.e., lower non-HDL-c values to the right of the mean). Thus, the proportion of obese girls with high non-HDL-c levels identified by BFP was two-fold greater when compared with BMI and four-fold greater when compared with WHtR.
The better performance of MF-BIA may be explained by its greater capacity to discriminate between fat and lean mass, whereas both BMI and WHtR use non-specific anthropometric variables such as weight, height, and circumference. In addition, MF-BIA was performed with tetrapolar device with eight point-tactile electrodes, which allows greater accuracy in the body fat measurement.24
A recent study involving a large sample of children and adolescents (n=1134) from Brazil has shown that the indicators BMI, WHtR, and skinfold thickness had poor discriminatory power to predict dyslipidemia,25 although a specific indicator of adiposity such as BFP was not tested. Moreover, because the c statistic (area under the ROC curve) is based only on ranks, its use can underestimate the actual predicted probability in clinical risk prediction models.26
Childhood obesity is widely associated to several cardiovascular risk factors, such as hypertension, insulin resistance and dyslipidemia.8 The poor lipid profile found in a large part of obese children can be partially explained by insulin resistance related to obesity. Studies have shown that insulin is a potent inhibitor of hormone-sensitive lipase (HSL), the enzyme responsible by lipolysis in adipose tissue.27 Thus, in the presence of insulin resistance, increasing HSL activity induces lipolysis and greater supply of free fatty acids to circulation. This mechanism increases the production of TG in the liver,28 which triggers increasing LDL-C and decreasing HDL-C in the plasma.29
This study had limitations and strengths. The authors did not use a random sample of the population of children and adolescents of similar age range. Therefore, there is a limitation in extrapolating the results for the general population. Nevertheless, the difference across the indicators should not be impaired by selection bias. The study did not perform internal validation of MF-BIA to establish its capacity to assess the body fat in the studied population. However, validation of multi-frequency bioelectrical impedance with eight-point tactile electrodes against DEXA has been provided for children and adolescents.30 A large sample of children and adolescents enabling robust assessment of cholesterol distribution, was the main strength.
The present findings demonstrated that body fat percentage assessed by MF-BIA was superior to both BMI and WHtR to identify children and adolescents with unfavorable lipid profile, mainly among girls. This result encourages the use of body fat percentage instead of weight status indicators in future studies of association between obesity and metabolic disorders in pediatric populations.
FundingFAPES/PPSUS (No. 65854420/2014) and Fundação Vale.
Conflicts of interestThe authors declare no conflicts of interest.
The authors acknowledge the continuous support of “Estação Conhecimento” during the period of data collection of this work. This study received funding support from FAPES/PPSUS (No. 65854420/2014) and Fundação Vale. The authors are also very grateful to the statistician Juliana Bottoni de Souza who revised the statistical analysis.
Please cite this article as: Oliosa PR, Zaniqueli D, Alvim RO, Barbosa MC, Mill JG. Body fat percentage is better than indicators of weight status to identify children and adolescents with unfavorable lipid profile. J Pediatr (Rio J). 2019;95:112–8.


