The aim of this study was to examine the association between individual and school context characteristics with the body mass index of Portuguese children.
MethodsThe sample comprised 1641 children (847 boys) aged 6–10 years from the North and Central regions of Portugal. Regarding the individual characteristics, age, gender, city of residence, levels of physical activity, and physical fitness were assessed. Concerning the school context characteristics, the surrounding environment, school size, presence of recreational characteristics and space, and presence of a sports court and of physical education classes were considered. Children's body mass index was the dependent variable. The multilevel analysis was carried out in HLM 7.0 software.
ResultsThe predictors of the child and the school context explained, respectively, 97.3% and 2.7% of the total body mass index variance. Regarding the individual characteristics, older children, boys, and those who had lower performance at the 1-mile run/walk, curl-up, push-up, and higher performance in trunk lift tests showed higher BMI. Further, urban schools with higher recreational spaces were positively associated with children's body mass index.
ConclusionSchool context variables have a reduced effect on body mass index variation compared to the children's biological and behavioral characteristics. The authors therefore encourage strategies that aim to increasing children's physical fitness levels to help prevent excess weight.
Examinar a associação de características individuais e do contexto escolar no índice de massa corporal de crianças portuguesas.
MétodoA amostra compreendeu 1641 crianças (847 meninos) de 6 a 10 anos de idade. Em relação às características individuais foram utilizadas informações relativas ao sexo, à idade, à residência, à atividade física e à aptidão física. Em termos de contexto escolar, foram considerados o meio ambiente, o tamanho da escola, a presença de recreio, as características e dimensões do espaço disponível para o recreio, a existência de quadra poliesportiva e de aulas de Educação Física. O índice de massa corporal [kg/(m2)] foi a variável dependente. A análise multinível foi efetuada no software HLM 7.0.
ResultadosOs preditores da criança e do contexto escolar explicaram, respectivamente, 97,3% e 2,7% da variância total do índice de massa corporal. Quanto às características individuais, a idade (mais velhos) e o sexo (meninos), bem como o desempenho reduzido nas provas de corrida/marcha da milha, do curl-up, do push-up e valores elevados no trunk lift estiveram associados ao aumento no índice de massa corporal. Escolas do meio urbano e escolas com maiores espaços para o recreio também estiveram positivamente associadas ao aumento do índice de massa corporal.
ConclusõesAs variáveis do contexto escolar têm um efeito reduzido na variação do índice de massa corporal comparativamente às características biológicas e comportamentais das crianças. Sugere-se a aplicação de programas visando o incremento dos níveis de aptidão física das crianças para prevenir o excesso de peso na infância.
The high prevalence of overweight and obesity in childhood is a serious public health problem.1 Additionally, it is known that childhood obesity increases the risk of developing other comorbidities that persist into adolescence and adult life.2
Studies on agents that may influence overweight in childhood have also focused on modifiable risk factors, such as physical activity (PA) and physical fitness (PF).3 Studies have reported that more active children tend to have lower values of body mass index (BMI) and/or a more adequate nutritional status.4,5 However, other studies failed to corroborate these results.6,7 PF, and especially its cardiorespiratory component, has been described as inversely associated with children's BMI.8 In turn, research on the associations of other components of PF, such as musculoskeletal fitness and flexibility with BMI, is scarce.9
The influence of the school context on health education, especially in childhood, is significant in a developmental perspective.10,11 The school is one of the most relevant educational contexts in children's development, especially regarding opportunities for engaging in varied PAs,5,12 rich in playfulness, in addition to preventive actions regarding health behaviors,12 and its association with individual characteristics, such as BMI, despite its apparently limited effect.13,14
In recent years, epidemiological research has focused on ecological approaches to interpret, in a more integrated manner, the relevance of individual and contextual factors in health behaviors15; multilevel modeling is a valuable tool to simultaneously assess the hierarchical influence of variables from different levels.16 However, studies with multilevel modeling have shown a reduced effect of school characteristics on BMI variation or on the children's nutritional status.13,14
For instance, Leatherdale13 showed that, in Canadian children, participation in sports competitions among schools accounted for 5.4% of the variation in the chance of being overweight. When assessing the BMI of English children, Pallan et al.14 also found a small amount of variance attributed to schools (0.9–4.2%); among the analyzed predictors, the number of sports activities offered were significant, as well as participation in interscholastic competitions. However, such evidence has focused on the effect of programs offered at schools, so that other aspects of the school context, such as surroundings, size, and infrastructures, have not been systematically considered in studies with children.
Therefore, the present study evaluated the association of individual characteristics and of the school context with the BMI variation of Portuguese children, using the multilevel approach.
MethodsSampleThe sample consisted of 1641 children (847 boys) aged 6–10 years, from 63 public and private schools in the North (Maia, n=20) and Central regions (Vouzela, n=18; Albergaria-a-Velha, n=25) of Portugal. The selection of the number of schools and children was based on the suggestions of the Maas & Hox simulation study.17 The choice of regions was made by convenience, but the schools were randomly selected. All children attending the first four years of elementary school were invited to participate in the study, and the enrollment rate was approximately 60%. The research procedures were approved by the Ethics Committee of Faculdade de Desporto of Universidade do Porto, as well as by the school principals. The informed consent form was signed by the parents/legal guardians of all individuals included in the study.
Children's variablesAnthropometricsHeight was measured with a portable stadiometer with a precision of 0.1cm (Seritex®, Holtain, NJ, USA), and the body mass with a portable scale (Seca, Optima 760, CA, USA) with an accuracy of 0.1kg. For the measurements, participants were barefoot and wearing light clothing. All procedures were performed according to the standardization described by Lohman et al.18 BMI was calculated in the usual manner (mass (kg)/height (m2)), and children were classified as having normal weight, overweight or obese based on the suggestion of Cole et al.19
Physical activityPA was estimated using the Godin & Shephard questionnaire,20 administered by trained researchers as a direct interview to sets of four to five children who answered the questions individually. The questionnaire required the children to report the number of times a week in which they were involved at least 15min of light (3 METs), moderate (5 METs), or vigorous (9 METs) activities. A total weekly PA (tPA) score, described in an arbitrary unit,20 was derived by multiplying the frequency reported for each category of PA intensity by the respective value in METs, followed by the sum of the obtained products: tPA=(3×number of times performing mild PAs)+(5×number of times performing moderate PAs)+(9×number of times performing vigorous PAs).20 There is information about the questionnaire validity,21 as well as its reliability when used with Portuguese children.5,22
Physical fitnessThe health-related PF was evaluated using the FitnessGram test protocols23:
- 1.
1-mile run/walk (cardiorespiratory fitness): running or walking one mile (1609m) in the shortest possible time (result in minutes);
- 2.
Curl-up (abdominal strength and resistance): perform the greatest number of abdominal crunches (result in number of repetitions);
- 3.
Push-up (strength and resistance of the upper limbs): perform the greatest number of arm flexions/extensions (raising and lowering the body; result in number of repetitions);
- 4.
Trunk lift (strength and flexibility of trunk extensors): from a ventral decubitus position, perform the maximum extension of the trunk in relation to the ground (result in centimeters).
Information about the school context was obtained from the principals of each school, based on a questionnaire developed through experts’ consensus (researchers and Physical Education teachers), and referred to the following domains: (1) environment (rural, urban, and semi-urban), based on the centrality of the schools in relation to the surrounding urban space (city or town), rurality (countryside), or in an intermediate space as indicated by the socio-geographical structure of each region defined by the autarchies; (2) school size (number of students); (3) presence of recreational time; (4) available space for recreation (10–29m2, 30–49m2, and >50m2); (5) characteristics of the space available for recreation (with or without obstacles, i.e., presence of trees, columns, plant beds, and others); (6) existence of a sports court; (7) existence of Physical Education classes.
Information quality controlInformation quality control was carried out in three stages: (1) training of the assessment team to apply the measures and tests by the main investigator; (2) re-testing of random samples of children in the pilot study and during the research; (3) calculation of the technical error of measurement (TEM) for anthropometric measurements and reliability estimates using the intraclass correlation coefficient (R) for tPA and for the PF tests. The TEM was 0.2cm for height and 0.1kg for body mass. The intraclass correlation coefficients were as follows: tPA, 0.80≤R≤0.91; 1-mile walk/run, 0.84≤R≤0.92; curl-up, 0.92≤R≤0.99; push-up, 0.86≤R≤0.92; trunk lift, 0.88≤R≤0.95.
Data analysisThe descriptive analysis (mean, standard deviation, percentages), as well as the analysis of the differences between genders (Student's t and Chi-square tests) were performed using SPSS (IBM SPSS Statistics for Windows, Version 21.0, Armonk, NY, USA). The multilevel analysis was performed using the software HLM (Scientific Software International, Version 7.0, IL, USA), and the simultaneous parameter estimation of the several models was performed based on the maximum likelihood method. Considering the BMI as a dependent variable, the predictors age, PA, PF, and school size (number of students) were centered on the respective means. Then, the variables were separated into two levels: the first with children's variables and the second, with the school context variables.
Three models were constructed in increasing order of complexity, and deviance was used as a global adjustment measure. The first model (M0) was constructed to calculate the intraclass correlation coefficient (ρ) and estimate how much of the total variance in BMI was associated with school contexts. The children's predictors were inserted in model 1 (M1), as well as the city of residence (transformed into dummy; Albergaria-a-Velha was the reference). The school predictors were added to the last model (M2) (the environment variable was transformed into dummy, considering the “rural” environment as reference). As the inclusion of some school variables in the analyses did not improve the quality of the model, it was decided not to include them into the final model.
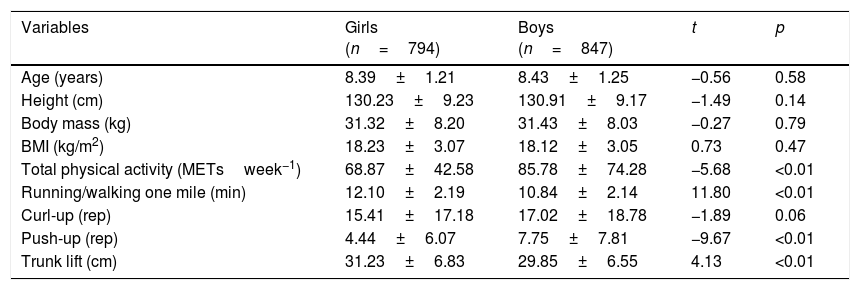
ResultsOn average, there were no statistically significant differences regarding age and anthropometric variables of boys and girls (Table 1). However, the boys had, on average, higher levels of PA and better performance in the PF tests, except in the trunk lift, where the girls performed better (p<0.05). The proportion of children classified as having normal weight was higher among boys, but no significant differences were found for the overweight and obesity categories (p>0.05).
Descriptive data (mean±SD and frequency distribution) of the variables at the children's level.
| Variables | Girls (n=794) | Boys (n=847) | t | p |
|---|---|---|---|---|
| Age (years) | 8.39±1.21 | 8.43±1.25 | −0.56 | 0.58 |
| Height (cm) | 130.23±9.23 | 130.91±9.17 | −1.49 | 0.14 |
| Body mass (kg) | 31.32±8.20 | 31.43±8.03 | −0.27 | 0.79 |
| BMI (kg/m2) | 18.23±3.07 | 18.12±3.05 | 0.73 | 0.47 |
| Total physical activity (METsweek−1) | 68.87±42.58 | 85.78±74.28 | −5.68 | <0.01 |
| Running/walking one mile (min) | 12.10±2.19 | 10.84±2.14 | 11.80 | <0.01 |
| Curl-up (rep) | 15.41±17.18 | 17.02±18.78 | −1.89 | 0.06 |
| Push-up (rep) | 4.44±6.07 | 7.75±7.81 | −9.67 | <0.01 |
| Trunk lift (cm) | 31.23±6.83 | 29.85±6.55 | 4.13 | <0.01 |
| Frequencies (%) | χ2 | p | ||
|---|---|---|---|---|
| Normal weight | 60.08 | 66.59 | 7.27 | <0.01 |
| Overweight | 26.83 | 20.90 | 3.32 | 0.07 |
| Obesity | 13.09 | 12.51 | 0.02 | 0.89 |
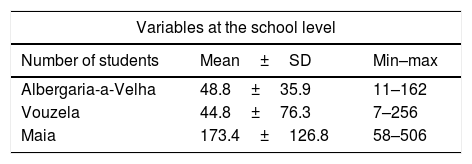
The information about the school level is shown in Table 2. The schools had between seven and 506 students, and the schools in the city of Maia had the highest number of students. Most schools were in rural areas (60.0%), had Physical Education classes (61.9%), and multisport courts (58.7%). All of them had time for recreation; approximately 60% had ample spaces for recreation, and ∼49% of schools have obstacles.
Descriptive data of variables at school level.
| Variables at the school level | ||
|---|---|---|
| Number of students | Mean±SD | Min–max |
| Albergaria-a-Velha | 48.8±35.9 | 11–162 |
| Vouzela | 44.8±76.3 | 7–256 |
| Maia | 173.4±126.8 | 58–506 |
| Information | Category | % |
|---|---|---|
| Environment | Rural | 65.0 |
| Mixed | 17.5 | |
| Urban | 17.5 | |
| Presence of recess | No | 0.0 |
| Yes | 100.0 | |
| Space available for recreation | 10–29m2 | 7.9 |
| 30–49m2 | 31.8 | |
| Larger than 50m2 | 60.3 | |
| Characteristics of recreational space | With obstacle | 49.2 |
| No obstacles | 50.8 | |
| Existence of a sports court | No | 41.3 |
| Yes | 58.7 | |
| Physical Education classes | No | 38.1 |
| Yes | 61.9 | |
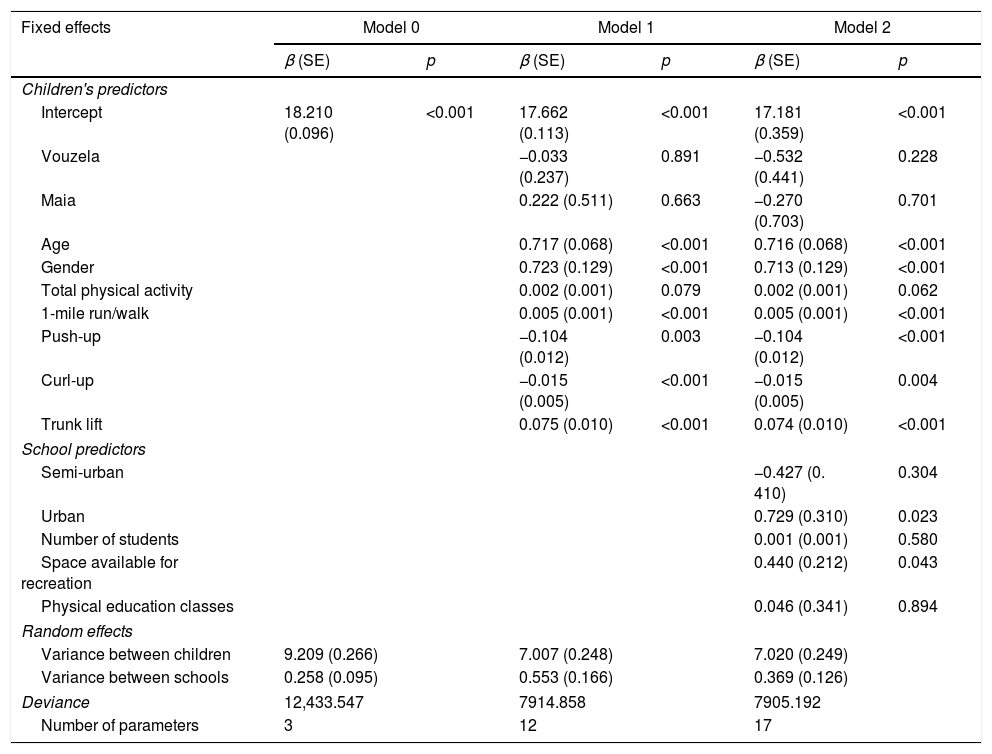
The results of the multilevel analysis are shown in Table 3. Based on the M0, the value of ρ was calculated as follows: ρ=0.258/(0.258+9.209)=0.027; i.e., 2.7% of the total variance in children's BMI is explained by differences in school contexts, whereas the remaining 97.3% are explained by individual predictors. The intercept in this model refers to the mean BMI of all children (18.21kg/m2).
Parameter estimates of the three models.
| Fixed effects | Model 0 | Model 1 | Model 2 | |||
|---|---|---|---|---|---|---|
| β (SE) | p | β (SE) | p | β (SE) | p | |
| Children's predictors | ||||||
| Intercept | 18.210 (0.096) | <0.001 | 17.662 (0.113) | <0.001 | 17.181 (0.359) | <0.001 |
| Vouzela | −0.033 (0.237) | 0.891 | −0.532 (0.441) | 0.228 | ||
| Maia | 0.222 (0.511) | 0.663 | −0.270 (0.703) | 0.701 | ||
| Age | 0.717 (0.068) | <0.001 | 0.716 (0.068) | <0.001 | ||
| Gender | 0.723 (0.129) | <0.001 | 0.713 (0.129) | <0.001 | ||
| Total physical activity | 0.002 (0.001) | 0.079 | 0.002 (0.001) | 0.062 | ||
| 1-mile run/walk | 0.005 (0.001) | <0.001 | 0.005 (0.001) | <0.001 | ||
| Push-up | −0.104 (0.012) | 0.003 | −0.104 (0.012) | <0.001 | ||
| Curl-up | −0.015 (0.005) | <0.001 | −0.015 (0.005) | 0.004 | ||
| Trunk lift | 0.075 (0.010) | <0.001 | 0.074 (0.010) | <0.001 | ||
| School predictors | ||||||
| Semi-urban | −0.427 (0. 410) | 0.304 | ||||
| Urban | 0.729 (0.310) | 0.023 | ||||
| Number of students | 0.001 (0.001) | 0.580 | ||||
| Space available for recreation | 0.440 (0.212) | 0.043 | ||||
| Physical education classes | 0.046 (0.341) | 0.894 | ||||
| Random effects | ||||||
| Variance between children | 9.209 (0.266) | 7.007 (0.248) | 7.020 (0.249) | |||
| Variance between schools | 0.258 (0.095) | 0.553 (0.166) | 0.369 (0.126) | |||
| Deviance | 12,433.547 | 7914.858 | 7905.192 | |||
| Number of parameters | 3 | 12 | 17 | |||
SE, standard error.
In the M1 results, the mean BMI of the girls is 17.66kg/m2, when all the predictors are centered (i.e., an 8.4-year old child, with 77.6 PA points, performs 16 and six repetitions in the curl-up and push-up tests, respectively, with 30.5cm in the trunk lift, and completes the 1-mile walk/run in 11.4min). Boys had higher BMI than girls (β=0.723, p<0.001) and their level increases with age (β=0.717, p<0.001).
Children with better performance in the curl-up (β=−0.015, p<0.001) and push-up (β=−0.104, p<0.001) tests had lower BMI; however, the lower the cardiorespiratory fitness 1-mile run/walk test (β=0.005, p<0.001) and the greater the flexibility in the trunk lift (β=0.075, p<0.001), the higher the BMI. There were no significant associations between the city where the children lived or the levels of PA with BMI. As expected, M1 fits better than M0 (reduction in deviance: χ2=4518.69; p<0.001). Moreover, the variables inserted in M1 explain 70.2% of 97.3% of the BMI variance attributed to individual predictors.
With the inclusion of school predictors, girls’ mean BMI is now 17.18kg/m2 but, in addition to the individual information reported in the previous model, this mean girl that studies in a rural school with an average of approximately 87 students, has available space for recreation between 10 and 29m2, and has Physical Education classes. Of the predictors of the school context, only the environment where the school was located and the space available for recreation were statistically significant, i.e., children in the urban area (β=0.729, p=0.023) and those with the largest recreation space (β=0.440, p=0.043) tended to have a higher BMI. The fit of this model is better than that of the previous model (reduction in deviance: χ2=7905.19; p=0.046).
DiscussionAs expected and verified in percentile charts,24 older children have, on average, a higher BMI, because they are taller and heavier. Although no difference between boys and girls was observed, on average, regarding BMI and the prevalence of overweight and obesity, the proportion of boys classified as having normal weight was higher. However, other studies have shown a higher BMI for boys.25,26 Studies with Portuguese children also showed a higher BMI in boys when compared with girls,5,25 but the prevalence of overweight and obesity has not changed since the year 2000 for both genders.5
When analyzing the sequential association of characteristics of children and the school context on BMI using multilevel modeling, the present study identified a significant association between different components of PF and BMI in children; however, the direction was not always the same. Similar results have been reported in the literature regarding the association between PF and BMI, especially for cardiorespiratory fitness,8 with evidence of an inverse association. That is, children with lower levels of cardiorespiratory fitness tend to have higher BMI (which may be associated with overweight), when compared to their peers with better cardiorespiratory fitness. However, the association between BMI and PF appears to be bidirectional, also suggesting that BMI may be a relevant predictor of children's PF. Moreover, a high BMI can affect movement efficiency, especially in tasks that require body transposition into space, and/or the elevation or propulsion of the body mass,27 thus reflecting on PF levels.
For the trunk lift test, however, there appears to be no clear association with BMI in the literature, since the available data between test performance and BMI did not show any significant effects.9 However, such results differ from those found in the present study; i.e., children with higher BMI tend to perform better at the trunk lift. There is no justification for this result; therefore, the influence of trunk lift performance on BMI needs to be investigated in future studies, especially with longitudinal design.
Studies on the association between PA and BMI levels have reported divergent results. On the one hand, the existence of an inverse association is suggested, i.e., children with lower levels of PA tend to have higher BMI or a greater chance of being overweight/obese4,22; on the other hand, some studies deny the existence of such association.6,7 The results of the present study did not disclose a significant association between BMI and PA in the assessed children. It is likely that, at this stage of childhood, BMI is not significantly influenced by children's PA levels, since most of their time is spent in mild or moderate activities that may have a reduced impact on BMI.28 Nonetheless, children tends to be naturally active, often engaging in playful activities (structured or otherwise), whenever they are encouraged and when opportunities are created for them to do so, regardless of their BMI values.
The school environment has been suggested as one of the most favorable contexts for overweight prevention in young individuals, given the time children spend at school during the first two decades of life.11 Nevertheless, the literature has shown a reduced effect of school characteristics on BMI variation in children.5,13,14 The present results corroborate previous studies that attributed a small but significant effect of the school context variability on BMI. It is very likely that, in the case of the present study, this fact was due to the sampling randomness in each school, as well as the possible similarity regarding the infrastructure.
Of the variables analyzed in the school context, it was observed that children in urban schools have a slightly higher BMI than those in rural schools. Similarly, the larger the space available for recreation, the higher the children's BMI. Although there is no information about the dietary habits of the assessed children, it is possible that the differences in BMI are related to the fact that rural children are more exposed to a healthy diet.29 Regarding recreational space, it is probable that having more space does not necessarily mean a greater tendency to practice PA, acting as a protective agent against childhood overweight.13
Possibly, more “attractive” spaces with equipment and/or “obstacles” (natural or built), which stimulate the increase of the PF and PA levels, are more effective in the combat against overweight than the availability of wider spaces.12 Moreover, it is possible that schools with larger recreational spaces are those located in urban zones, where children are more exposed to an obesogenic environment, with negative effects on BMI. It is probable that the result found is due to an interaction between the environment where the school is located and its infrastructure.
The present study has some limitations: (a) its cross-sectional design, which prevents attributing causality to the association between variables; (b) the sample was selected from schools in central and northern Portugal, which limits the generalization of results; however, it is noteworthy that the prevalence of overweight, as well as the levels of PA and performance at the PF tests, did not differ from other studies carried out with Portuguese children at the same age group22,30; (c) the use of a questionnaire to assess PA, mainly due to the difficulty children have remembering and quantifying their daily/weekly activities; however, the questionnaire used has shown moderate-to-high reliability in Portuguese children22,30; (d) despite the importance of unhealthy habits of consuming nutritionally-dense foods for the BMI values of children and young individuals, it was not possible to obtain any information on food consumption. However, it is important to note that the acquisition of such information is a complex task, in addition to becoming difficult when dealing with a sample of 1641 children.
The study also has strengths: (a) the sample size and the number of schools assessed; (b) the use of standardized and reliable methods; (c) the use of multilevel modeling to assess the combined effect of the characteristics at the individual level and the school context on the children's BMI.
In conclusion, the school context has a reduced role in explaining BMI variability in children compared to their individual characteristics. More specifically, older children and/or those with lower levels of PF, boys, and those who study in schools located in urban areas, with larger spaces for recreation, have a higher BMI. Given their relevance, this information should be carefully considered by parents, teachers, and health professionals when planning and developing more effective strategies to control BMI in childhood.
Conflicts of interestThe authors declare no conflicts of interest.
Please cite this article as: Henrique RS, Gomes TN, Tani G, Maia JA. Association between body mass index and individual characteristics and the school context: a multilevel study with Portuguese children. J Pediatr (Rio J). 2018;94:313–9.


