
Reliably prediction models for coronary artery abnormalities (CAA) in children aged >5 years with Kawasaki disease (KD) are still lacking. This study aimed to develop a nomogram model for predicting CAA at 4 to 8 weeks of illness in children with KD older than 5 years.
MethodsA total of 644 eligible children were randomly assigned to a training cohort (n = 450) and a validation cohort (n = 194). The least absolute shrinkage and selection operator (LASSO) analysis was used for optimal predictors selection, and multivariate logistic regression was used to develop a nomogram model based on the selected predictors. Area under the receiver operating characteristic curve (AUC), calibration curves, Hosmer-Lemeshow test, Brier score, and decision curve analysis (DCA) were used to assess model performance.
ResultsNeutrophil to lymphocyte ratio, intravenous immunoglobulin resistance, and maximum baseline z-score ≥ 2.5 were identified by LASSO as significant predictors. The model incorporating these variables showed good discrimination and calibration capacities in both training and validation cohorts. The AUC of the training cohort and validation cohort were 0.854 and 0.850, respectively. The DCA confirmed the clinical usefulness of the nomogram model.
ConclusionsA novel nomogram model was established to accurately assess the risk of CAA at 4–8 weeks of onset among KD children older than 5 years, which may aid clinical decision-making.
Kawasaki disease (KD) is a systemic vasculitis of unknown etiology that causes coronary artery abnormalities (CAA) and has evolved as a major cause of acquired heart disease in children and adolescents.1 During the acute phase of KD, necrotizing arteritis associated with neutrophilic infiltrations develops, gradually destroying the coronary artery intima, media, and some portions of the adventitia, leading to ectasia of the vessel and aneurysm formation.2 KD affects mainly, but not exclusively, children under 5 years old, and approximately 13.2 % of KD patients were children 5 years of age or older.3 Notably, children over 5 years of age are reported to have a higher risk of developing CAA in KD than younger children under age 5 years.4–6 Although most children with KD have excellent clinical outcomes after receiving intravenous immunoglobulin (IVIG) therapy within the first 10 days of illness, the rate of CAA remains higher in older KD children.6-8 Therefore, accurate prediction for CAA in older children with KD is necessary, which may assist clinicians in making better decisions.
Previous studies have characterized and identified putative predictors for CAA development in KD, including demographic, clinical, and laboratory characteristics.9-11 However, the vast majority of subjects in existing scoring systems are children under 5 years of age. In addition, older children with KD have different clinical and laboratory characteristics from younger children.12-14 An accurate predictive model for CAA of children aged>5 with KD is still lacking.
Herein, the authors developed a nomogram model to predict CAA at 4 to 8 weeks of illness in children with KD older than 5 years, which may have potential clinical application value.
MethodsStudy design and patientsThe authors retrospectively evaluated the data of KD children aged > 5 admitted to the hospital between January 2018 and December 2022. KD was diagnosed according to the American Heart Association criteria.2 Patients meeting the following criteria were excluded: (1) with a prior episode of KD; (2) received IVIG treatment before admission; (3) without initial IVIG therapy; (4) lacking echocardiographic data at baseline or 4–8 weeks after illness onset.
Coronary artery dimensions from the proximal right coronary artery (RCA), left main coronary artery, and left anterior descending (LAD) artery were adjusted for body surface area (z-scores).15 Coronary z-scores were calculated at baseline and 4–8 weeks after onset. Baseline echocardiograms were obtained before IVIG administration or shortly after initial IVIG treatment (within 48 h). The maximum z-score at baseline was defined as the larger z-score of the proximal RCA and proximal LAD artery. CAA was defined as a z-score ≥ 2.5 in the proximal RCA and/or proximal LAD artery. For multiple echocardiograms obtained at 4–8 weeks, the maximum z-score was used.
Further, according to the maximum z-score, patients were divided into five z-score subgroups: < 2.0, 2.0–2.5, 2.5–5.0, 5.0–10.0, and ≥ 10.0. Subsequently, based on the maximum z-score subgroups at baseline and 4–8 weeks after illness, coronary outcomes were classified into three categories: (1) improved: the maximum z-score subgroup decreased at 4–8 weeks compared with baseline; (2) unchanged: the maximum z-score subgroup remained at the same, and (3) progressed: the maximum z-score subgroup increased at 4–8 weeks.
All KD children were initially treated with a single infusion of IVIG (2 g/kg) and oral aspirin (30–50 mg/kg/day), and the dose of aspirin was decreased to 3–5 mg/kg/day after defervescence and continued for 8 weeks. IVIG resistance was defined as recrudescent or persistent fever (≥ 38 °C) greater than 36 h but less than 7 days after completion of the initial IVIG infusion. For KD children with IVIG resistance, a second dose of IVIG was administered alone or with corticosteroid.
The study was approved by the Ethics Committee of the Children's Hospital of Chongqing Medical University and complied with the Declaration of Helsinki.
Data collectionThe authors collected the following information from the hospital's electronic medical record system: (1) demographic information: age and gender; (2) clinical characteristics: response to IVIG therapy, days of hospital visit after onset, days of fever before IVIG, clinical presentations, and the prevalence of incomplete KD; and (3) laboratory tests results obtained pre-IVIG therapy: white blood cell count, red blood cell count, platelet count, hemoglobin, red blood cell distribution width, mean corpuscular volume, platelet distribution width, mean platelet volume, mean corpuscular hemoglobin, mean corpuscular hemoglobin concentration, neutrophil percentage, lymphocyte percentage, mononuclear percentage, eosinophil percentage, C-reactive protein, procalcitonin, erythrocyte sedimentation rate, albumin, total bilirubin, direct bilirubin, alanine transaminase, aspartate aminotransferase gamma-glutamyl transpeptidase, alkaline phosphatase, lactic dehydrogenase, serum urea, serum potassium, and serum sodium. NLR, PLR, SII, and PNI were calculated as follows: NLR = neutrophil/lymphocyte, PLR = platelet/lymphocyte, SII = platelet*neutrophil/lymphocyte, and PNI = albumin (g/L) +5* lymphocyte (109/L).
Feature predictor selection and model developmentPatients were randomly divided into a training cohort and a validation cohort at the ratio of 7:3. Considering the comparatively limited number of events in the training cohort relative to the number of variables, the least absolute shrinkage and selection operator (LASSO) was utilized to select the predictors. The coefficients of the variables were compressed along with the λ changes, and the suitable λ for the LASSO regularization algorithm was determined using cross-validation. Restricted cubic splines (RCS) were used to test potential nonlinear associations between the continuous predictors and outcomes, and nonlinear continuous predictors were converted into categorical predictors. Collinearity between predictors was assessed based on the variance inflation factor (VIF). The multivariate logistic regression model was used to establish a nomogram model.
Model performanceThe performance of the model was assessed by discrimination, calibration, and clinical utility. The discrimination of the model was determined by the area under the receiver operating characteristic curve (AUC), which ranges from 0.5 (no discrimination) to 1 (perfect discrimination). The calibration of the model was assessed by the visual calibration plot, Hosmer-Lemeshow test, and Brier score. The clinical utility of the model was evaluated by the decision curve analysis (DCA) by calculating the net benefits at different threshold probabilities. These tests were all performed both in the training cohort and validation cohort.
Comparison with other scoring systemsTo compare the performance of the model with the other three risk scores used for all ages of KD, these scoring systems were applied to the data of this study, and the AUCs of these scoring systems were compared with the AUC of the present model.
Statistical analysisAll statistical analysis was performed with R (R Core Team, version 4.2.3). Multiple imputation was used for the missing data with less than 10 % missing proportion. Details of missing values and interpolation methods can be found in Supplementary Table 1. Continuous variables were presented as mean ± standard deviation (SD) in the case of a normal distribution and median with an interquartile range (IQR) in the case of a non-normal distribution. Categorical variables were presented as numbers and percentages. Continuous variables between groups were compared by the independent t-tests or Mann–Whitney U tests according to the distribution of the variables. Categorical variables between groups were compared by the chi-square tests or Fisher exact tests. Post hoc power analysis was performed to compute statistical power based on the sample size in the training and validation cohorts. All statistical analyses were two-tailed, and a P value < 0.05 was considered statistically significant.
ResultsCharacteristics of patientsA total of 860 KD children aged> 5 years were admitted to the Children's Hospital of Chongqing Medical University during the study period. A total of 216 patients were excluded, of whom 75 had a prior history of KD, 20 received IVIG treatment before admission, 48 without initial IVIG therapy, and 73 lacked echocardiographic data at baseline or 4–8 weeks after illness onset. In the end, 450 patients were enrolled in the training cohort and 194 patients in the validation cohort (Supplementary Figure 1).
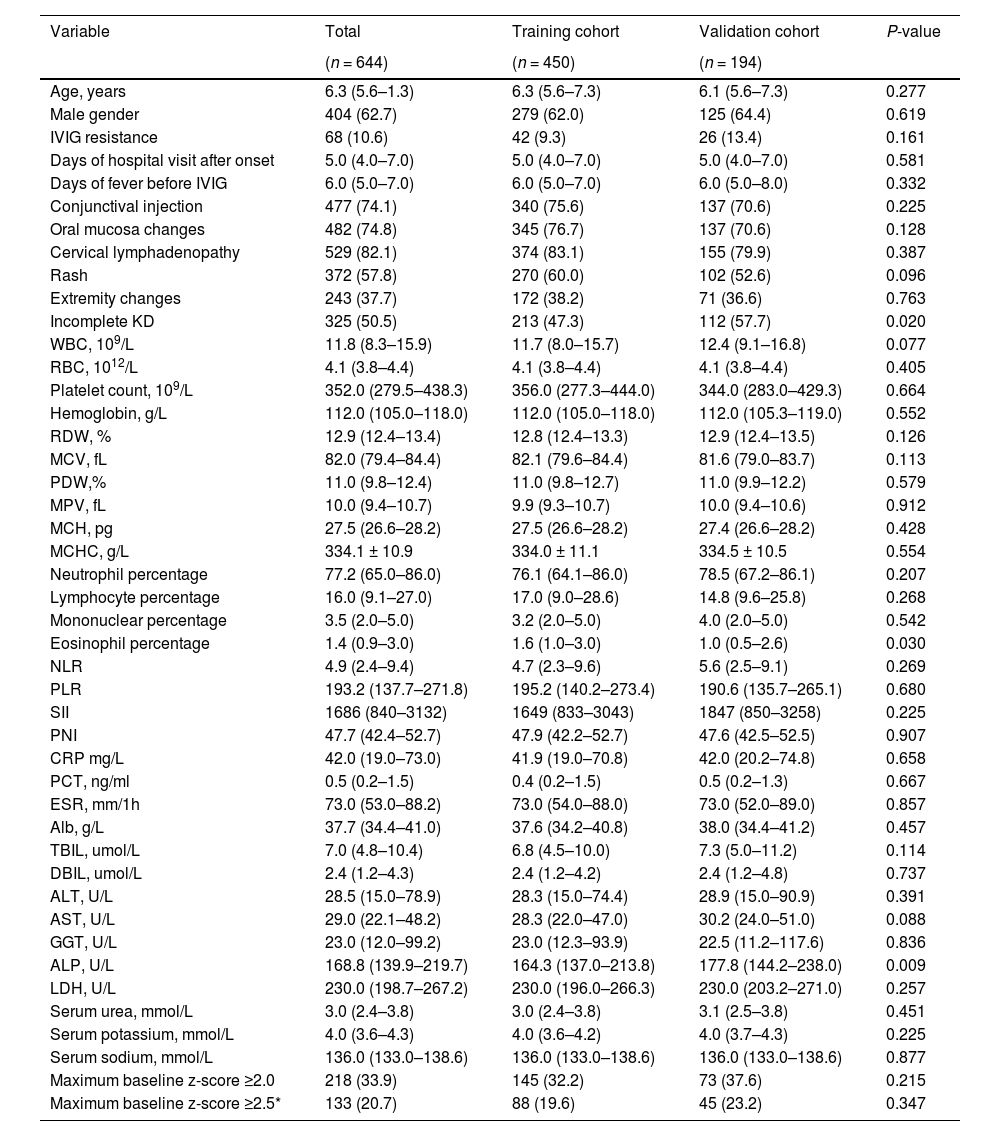
In the training cohort, 279 patients (62.0 %) were male, the median (IQR) age was 6.3 (5.6–7.3) years, 102 patients (22.7 %) were diagnosed with CAA, and 42 patients (9.3 %) were identified with IVIG resistance. In the validation cohort, 125 patients (64.4 %) were male, the median (IQR) age was 6.1 (5.6–7.3) years, 43 patients (22.2 %) were diagnosed with CAA, and 26 patients (13.4 %) were identified with IVIG resistance. The baseline characteristics were not significantly different between the training and validation cohorts except for incomplete KD, eosinophil percentage, and alkaline phosphatase. For patients with a maximum baseline z-score ≥ 2.5, the median (IQR) maximum baseline z-scores were 3.0 (2.7–3.6) and 3.2 (2.7–3.5) in the training and validation cohorts, respectively, P = 0.539. Details are shown in Table 1 and Supplementary Table 2.
Demographic and clinical characteristics of patients in the training and validation cohorts.
Continuous variables are reported as median (interquartile range) OR mean±SD; categorical variables, as frequencies (proportions).
IVIG, Intravenous Immunoglobulins; WBC, white blood cell count; RBC, red blood cell count; RDW, red blood cell distribution width; MCV, mean corpuscular volume; PDW, platelet distribution width; MPV, mean platelet volume; MCH, mean corpuscular hemoglobin; MCHC, mean corpuscular hemoglobin concentration; NLR, neutrophil-to-lymphocyte ratio; PLR, platelet-to-lymphocyte ratio; SII, systemic immune-inflammation index; PNI, prognostic nutritional index; CRP, C-reactive protein; PCT, procalcitonin; ESR, erythrocyte sedimentation rate; Alb, albumin; TBIL, total bilirubin; DBIL, direct bilirubin; ALT, alanine transaminase; AST, aspartate aminotransferase; GGT, gamma-glutamyl transpeptidase; ALP, alkaline phosphatase; LDH, lactic dehydrogenase. *For patients with a maximum baseline z-score ≥2.5, the median (interquartile range) maximum baseline z-scores were 3.0 (2.7–3.6) and 3.2 (2.7–3.5) in the training and validation cohorts, respectively, P = 0.539.
Regarding coronary outcomes, 64 (14.2 %)/28 (14.4 %) patients had improved outcomes, 318 (70.7 %)/135 (69.6 %) patients had unchanged outcomes, and 68 (15.1 %)/31 (16.0 %) patients had progressed outcomes in the training cohort and validation cohort, respectively. Of all maximum z-score subgroups, the highest improvement rate was observed in the 2.0–2.5 subgroups (66.7 % in the training cohort and 46.4 % in the validation cohort), whereas patients in the 2.5–5.0, 5.0–10.0, and ≥ 10.0 subgroups were less likely to improve (29.5 %, 33.3 %, 0 % in the training cohort; 37.5 %, 0 %, 0 % in the validation cohort, respectively) (Supplementary Table 3).
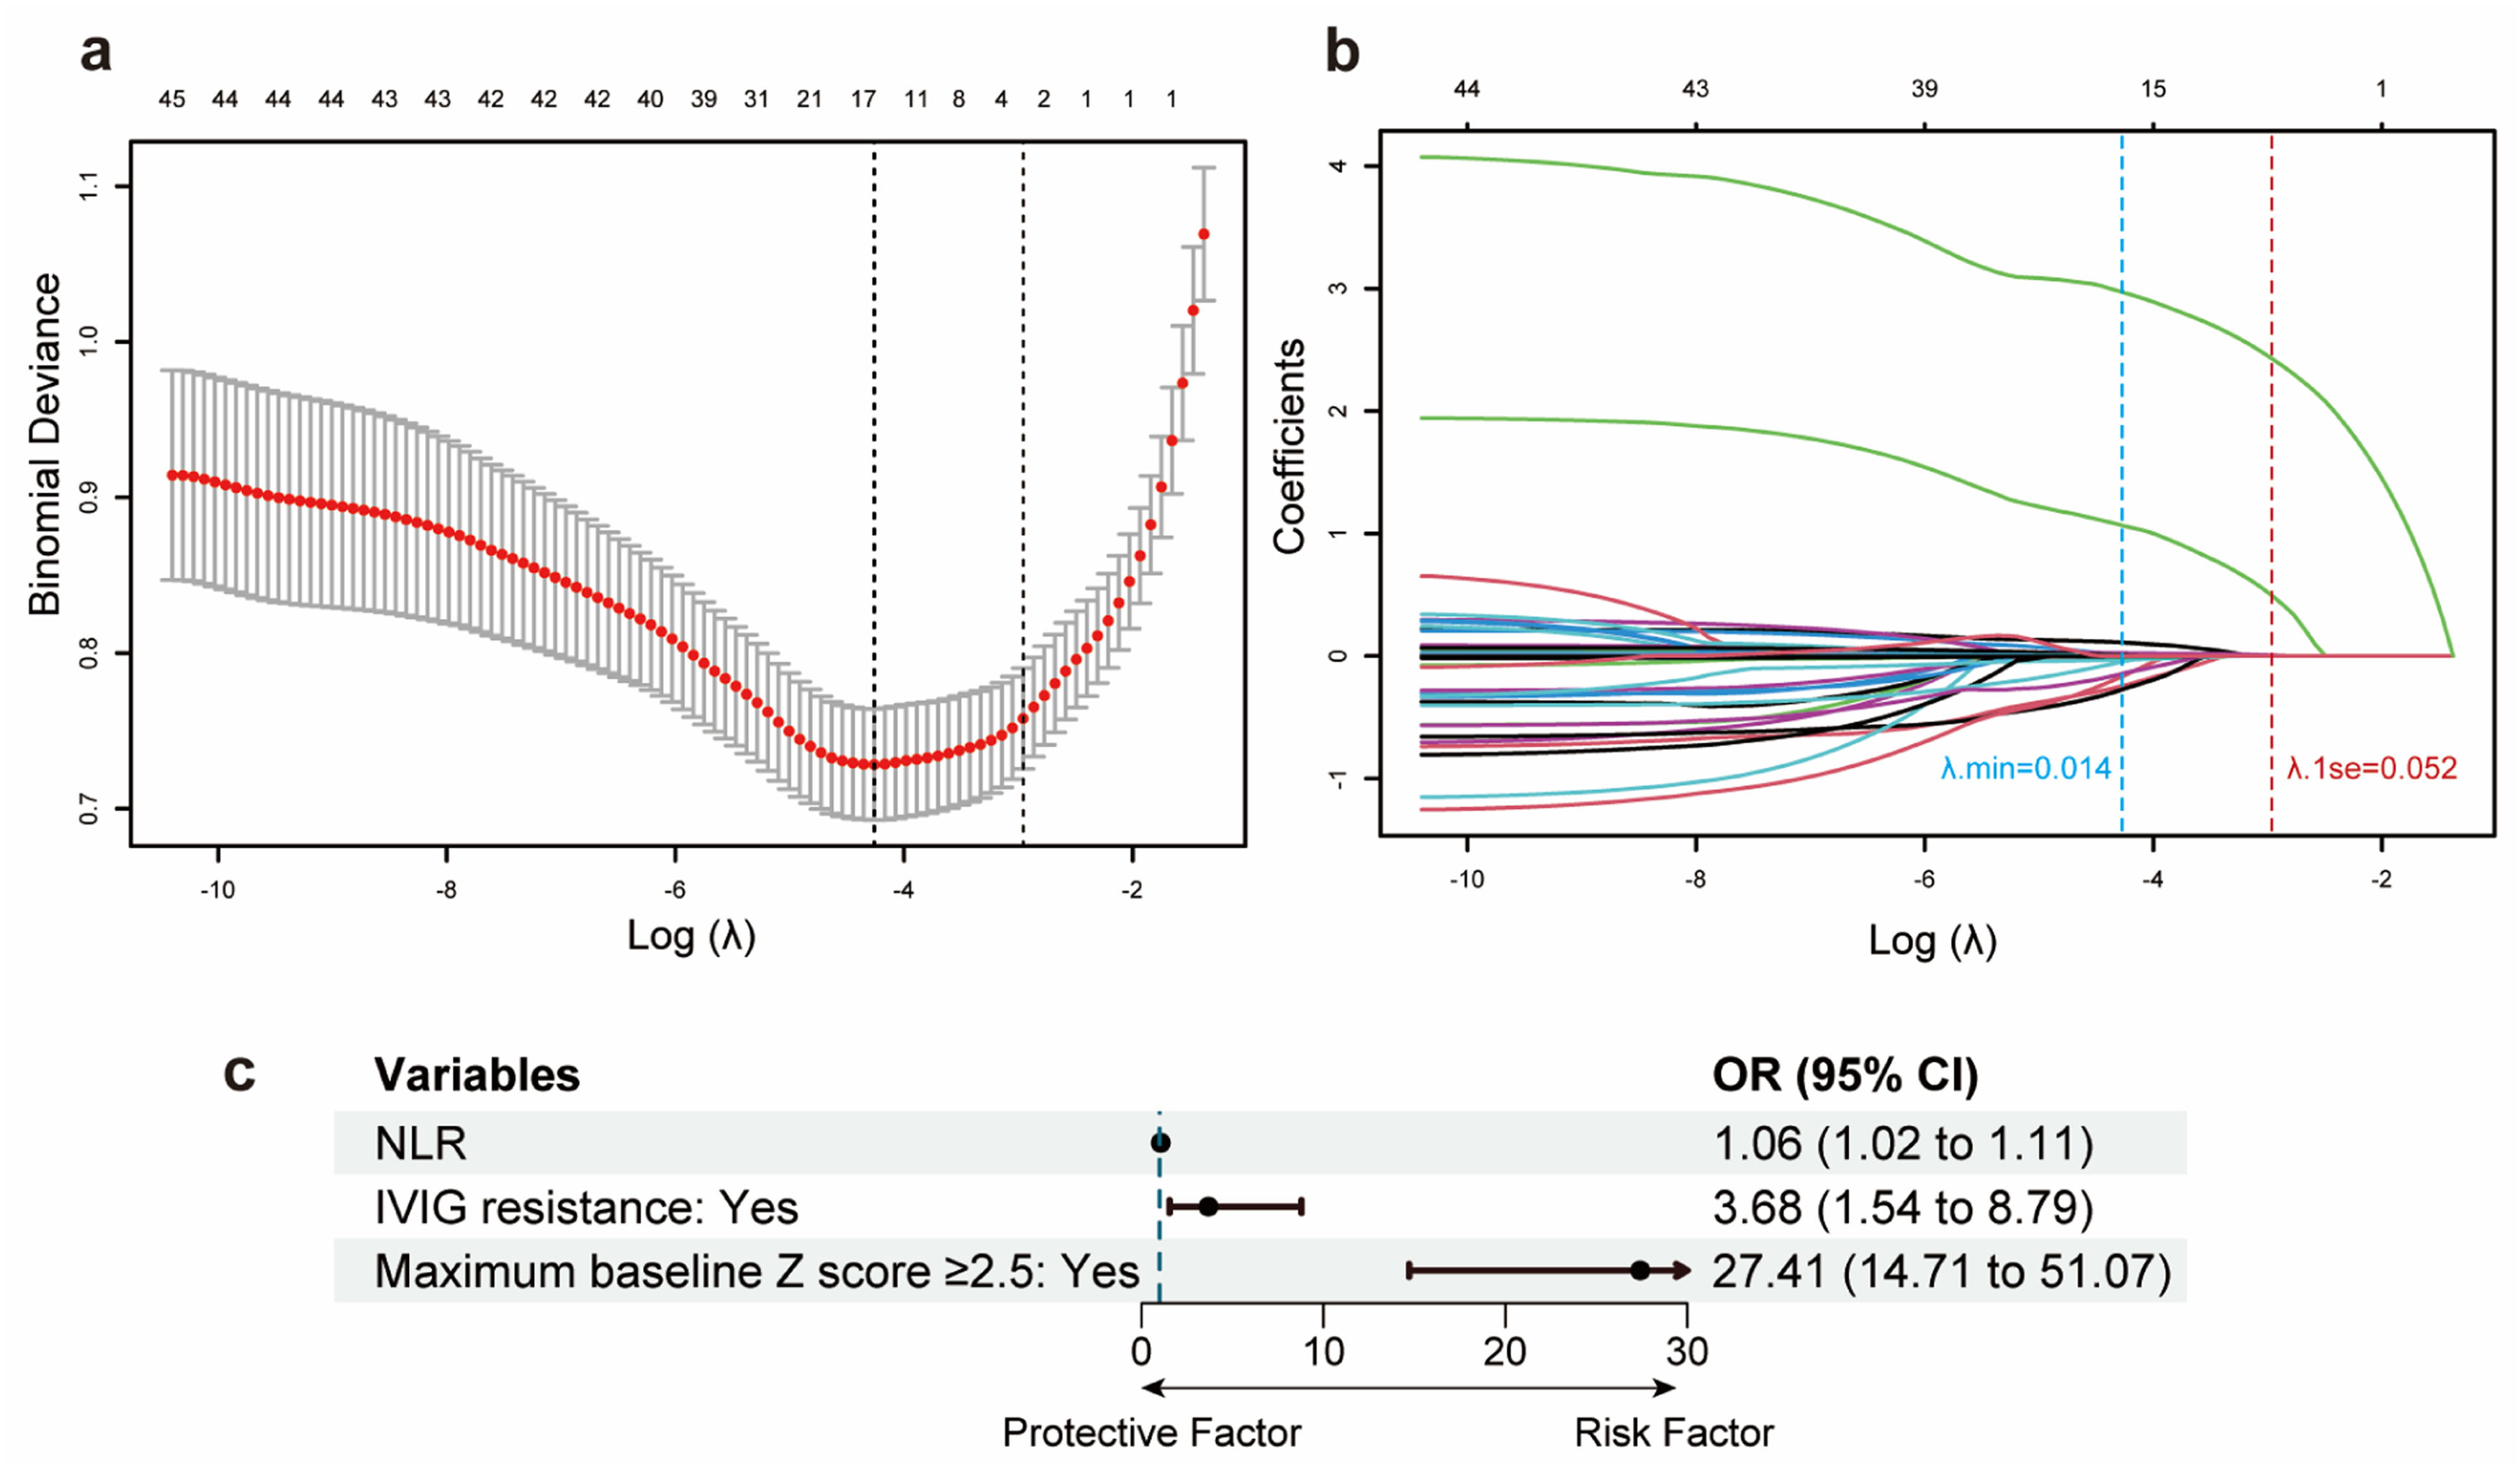
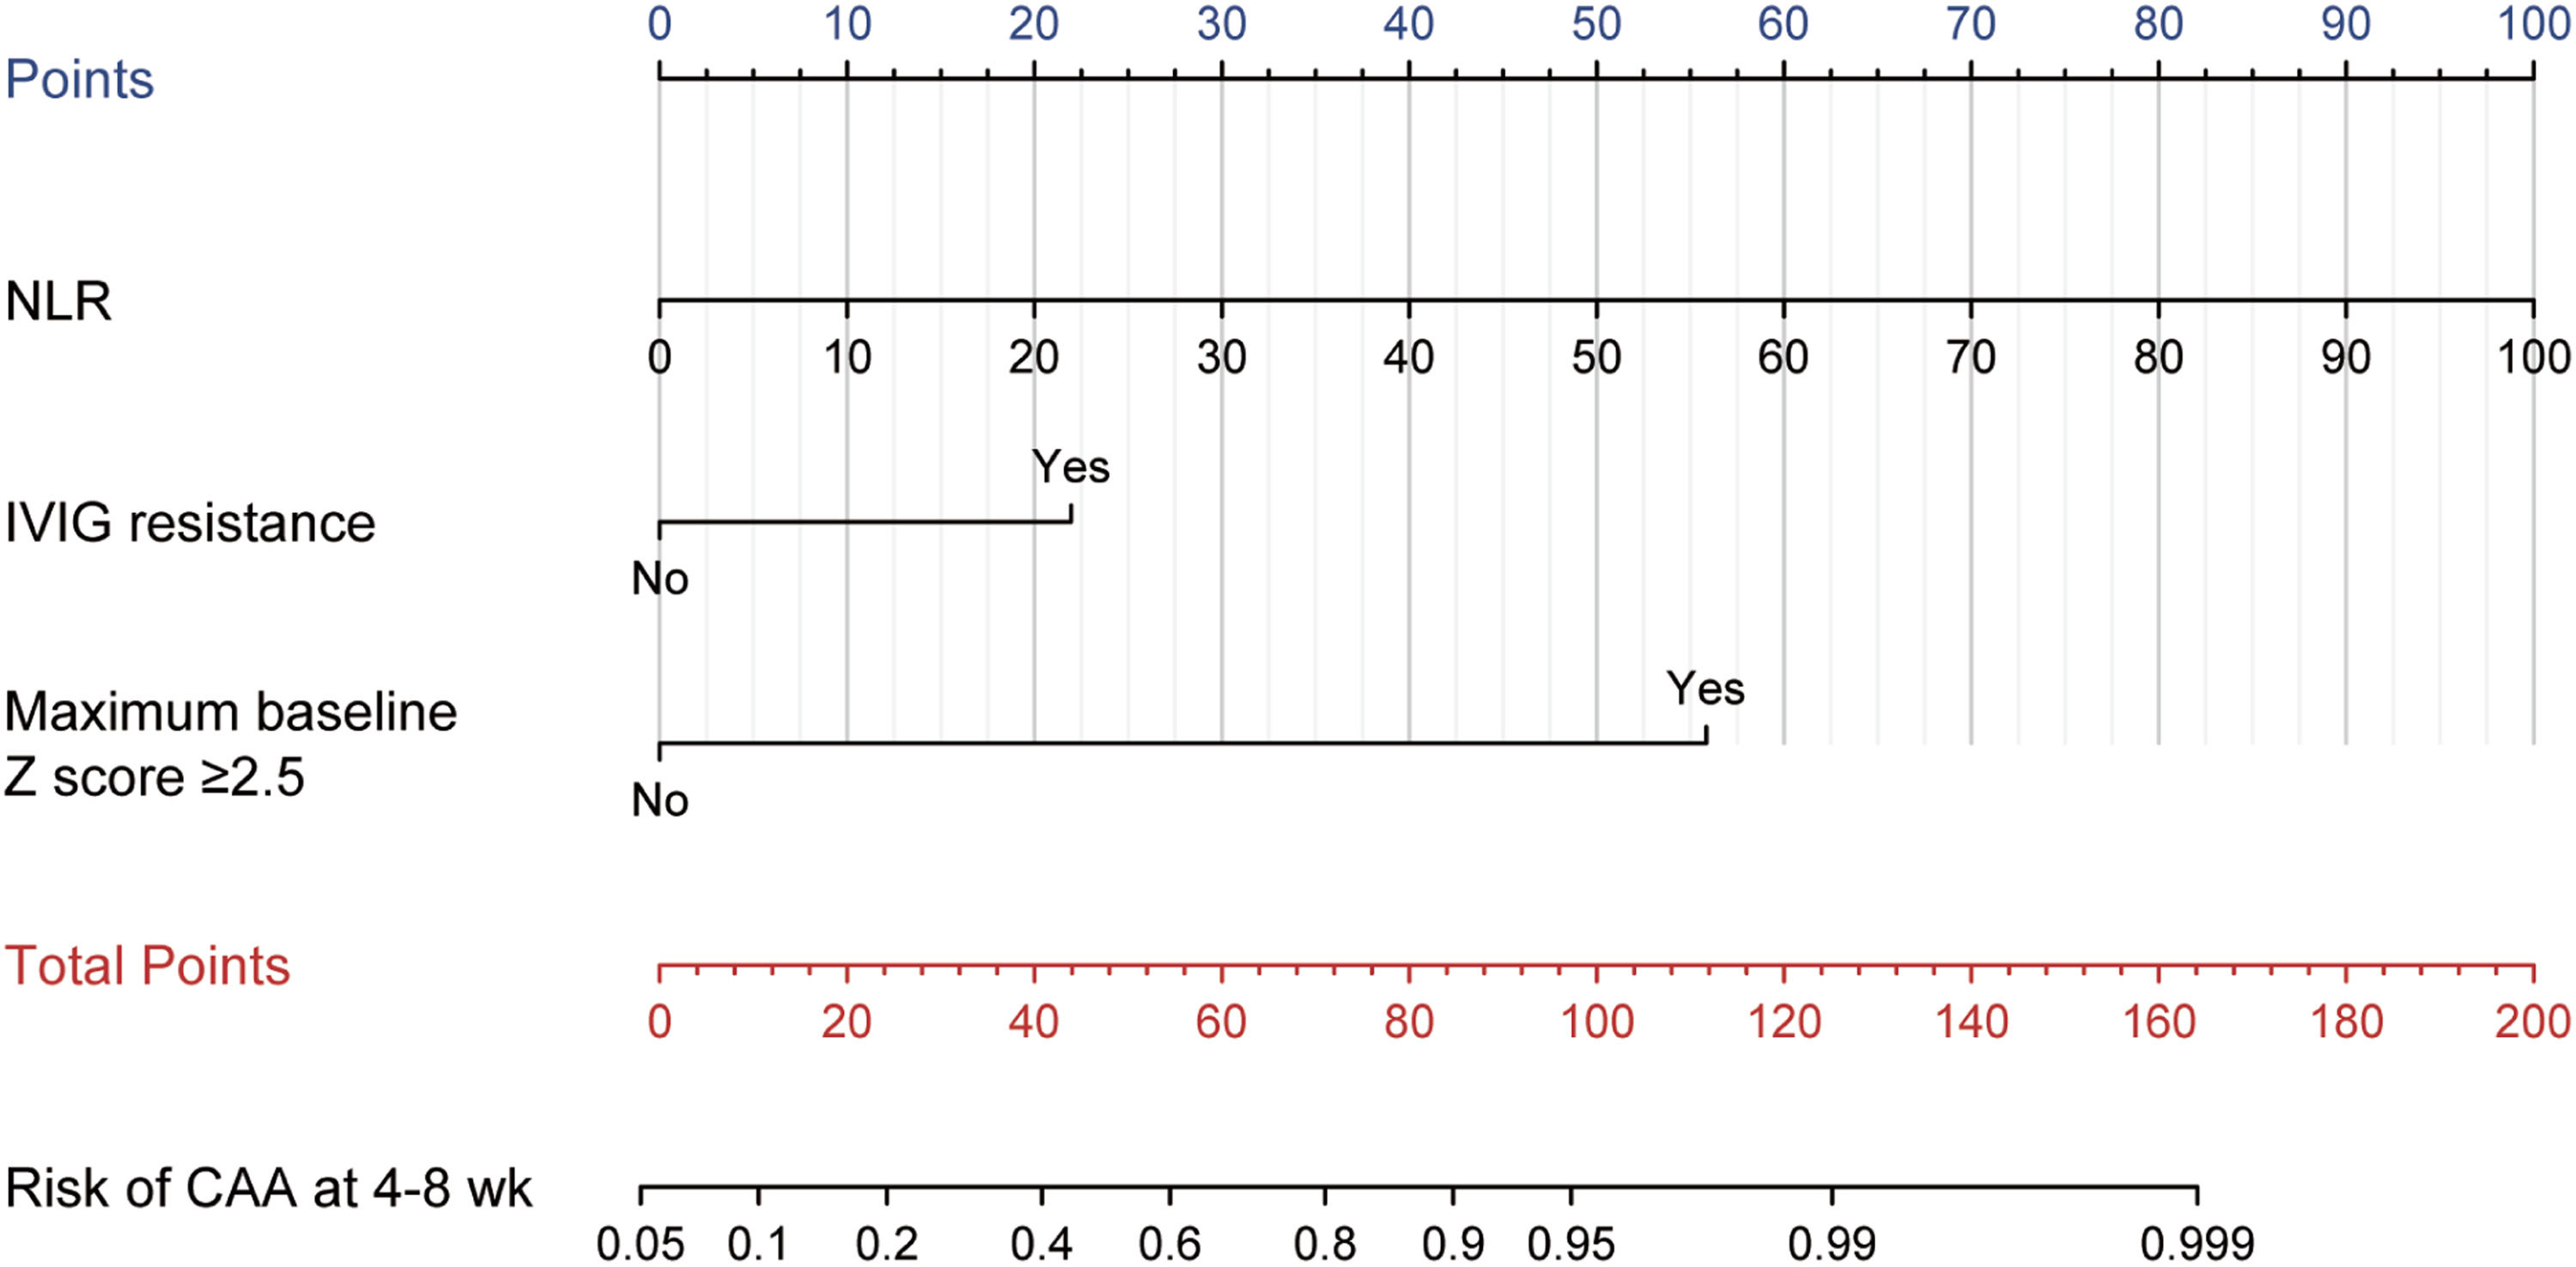
Feature predictor selection and model developmentAfter the LASSO algorithm, 45 variables were reduced to 3 significant predictors with non-zero coefficients based on the training cohort (Figure 1a and 1b). The RCS showed a linear relationship between continuous NLR and CAA risk: the higher the NLR, the greater the risk of CAA (Supplementary Figure 2). The final predictors included in the model were NLR, IVIG resistance (yes vs no), and maximum baseline z-score ≥ 2.5 (yes vs no). The OR and 95 % confidence interval (CI) of the predictors above are presented in Figure 1c. The above 3 predictors were finally integrated into the nomogram model (Figure 2). None of these 3 variables violated the VIF criteria in the model.
 The optimal parameters (λ) selection by LASSO. The left and right dotted vertical lines represent the optimal λ values using the minimum error criterion (λmin) and one standard error (1se) of the minimum criterion. The log (λ1se) of −2.958 and λ1se of 0.052 were considered optimal. (b) A LASSO coefficient profile of all feature variables against the log (λ) sequence. The blue and red dotted vertical lines indicate the log(λmin) and log(λ1se). Three predictors with non-zero coefficients were identified based on the log (λ1se) value. (c) Forest plot of odds ratios (ORs) for predictors included in the prediction model. CI, confidence interval.")
Feature predictors selection and forest plot of predictors. (a) The optimal parameters (λ) selection by LASSO. The left and right dotted vertical lines represent the optimal λ values using the minimum error criterion (λmin) and one standard error (1se) of the minimum criterion. The log (λ1se) of −2.958 and λ1se of 0.052 were considered optimal. (b) A LASSO coefficient profile of all feature variables against the log (λ) sequence. The blue and red dotted vertical lines indicate the log(λmin) and log(λ1se). Three predictors with non-zero coefficients were identified based on the log (λ1se) value. (c) Forest plot of odds ratios (ORs) for predictors included in the prediction model. CI, confidence interval.

Model for predicting CAA at 4–8 weeks after onset in KD children aged over 5. The points of each feature were added to obtain the total points, and a vertical line was drawn on the total points to obtain the corresponding "Risk of CAA at 4–8 weeks." CAA, coronary artery abnormalities; KD, Kawasaki disease; NLR, neutrophil-to-lymphocyte ratio; IVIG, intravenous immunoglobulin.
The AUC of the training cohort and the validation cohort were 0.854 (95 % CI 0.818–0.885) and 0.850 (95 % CI 0.792–0.897) (Figure 3a and 3b), respectively, which showed that the predictive nomogram has good discrimination. The calibration curves of the training cohort and the validation cohort showed that the predicted value of the nomogram is consistent with the observed value (Figure 3c and 3d). The P-value examined by the Hosmer-Lemeshow test of the training cohort, and the validation cohort were 0.219 and 0.362, respectively, indicating not statistically significant, illustrating no difference between actual and predicted probability. Similar results were obtained for the Brier scores in the training and validation cohorts, with a Brier score of 0.104 in the training cohort and 0.109 in the validation cohort. Post hoc power analysis revealed that the statistical power value was 0.99 for both the training cohort (450 patients) and the validation cohort (194 patients).
, calibration curve (c), and decision curve analysis (e) of the training cohort. Receiver operating characteristic curve (b), calibration curve (d), and decision curve analysis (f) of the validation cohort. AUC, area under the receiver operating characteristic curve.")
Performance of the nomogram model. Receiver operating characteristic curve (a), calibration curve (c), and decision curve analysis (e) of the training cohort. Receiver operating characteristic curve (b), calibration curve (d), and decision curve analysis (f) of the validation cohort. AUC, area under the receiver operating characteristic curve.
The DCA for the nomogram model in the training and validation cohorts is shown in Figure 3e and 3f. The DCA in the present study showed that the nomogram of the CAA at 4–8 weeks model was more effective than all-patient intervention or no intervention if the threshold probability ranged from 6 % to 91 % in the training cohort, and from 6 % to 72 % in the validation cohort. In general, the DCA manifested that the nomogram model was feasible and could make valuable and useful judgments.
All results indicated that the nomogram prediction model established by the included predictors could precisely and steadily evaluate the risk of CAA at 4–8 weeks after onset in children over 5 years with KD.
Comparison with other scoring systemsThree previously reported risk scores based on the KD population of all ages (mostly under 5 years old) were applied to this data, and AUC, sensitivity, specificity, and accuracy were calculated in the training cohort. As the results showed, the present model outperforms these three risk scores (Supplementary Table 4). The nomogram model had a sensitivity of 70.6 % and a specificity of 92.0 %, while the sensitivity of three other scoring systems ranged from 26.8 % to 53.9 %, and the specificity ranged from 63.5 % to 87.1 %. The AUC of the nomogram model was 0.854, which was higher than that of Kobayashi (0.625), Egami (0.590), and Formosa (0.606) score.
Website of nomogram modelThe authors built a web-based user-friendly calculator with only 3 input variables (https://5yearskdcaa.shinyapps.io/DynNomapp/) to facilitate the use of the nomogram model for clinicians.
DiscussionThe present study developed and validated a web-based nomogram model for CAA development prediction in children over 5 with KD. The proposed model included NLR, IVIG resistance, and maximum baseline z-score ≥ 2.5, showing excellent calibration and discrimination. As far as the authors know, this is the first nomogram model that can predict the risk of CAA at 4–8 weeks after onset for KD children older than 5 years. This visualization model and website enable medical staff to predict the CAA risk at 4–8 weeks of KD children > 5 years old, which may help individualized risk assessment and clinical decision-making and management.
It is well-known that the sequelae of CAA could contribute to adverse cardiovascular events in adulthood.16,17 After 4–8 weeks of onset, the size of CAA stabilizes or begins to shrink, and the long-term management strategies replace the acute management guidelines.2,18 Additionally, the risk of the development of CAA and the clinical and laboratory features differ between younger and older children with KD.8,14 Older children (over 5 years of age) have a higher incidence of CAA and a lower rate of CAA regression than younger children.6,19 Thus, making clinical decisions for KD children aged > 5 based on the probability of CAA at 4–8 weeks may be effective.
In the acute phase of KD, increased neutrophil counts in peripheral blood and neutrophilic necrotizing arteritis at the pathological level are observed.20 The higher NLR value means more intense neutrophil activation, which is considered to reflect the heavier inflammatory response of KD.21 Initial inflammatory activity is suspected as one cause of CAA development so far.22 Several studies have regarded NLR as one of the main risk factors of CAA sequelae.22,23 The value of NLR was reported to be positively correlated with age and increased significantly after 4 years of age.24 In the present study, the value of NLR was 4.9 (IQR, 2.4–9.4), and NLR was a significant predictor of CAA at 4–8 weeks of illness in KD children older than 5 years.
Many studies, with the vast majority of participants under 5 years of age, have shown that children with KD who are resistant to initial IVIG therapy are at increased risk of developing CAA.25–27 Similarly, the present study suggested this pattern also occurs in KD children who are all > 5 years old. IVIG resistance, as an objective predictor for CAA at 4–8 weeks in KD children aged over 5, was included in the nomogram model. Although IVIG resistance and CAA have been the research hotspot for many years, the mechanism by which IVIG resistance increases the incidence of CAA is still unclear, possibly because the etiology of KD and the precise mechanism of IVIG treatment of KD remain incompletely understood.28
Maximum baseline z-score ≥ 2.5 was shown to be the most important predictor of later development of CAA in KD children over 5 years old in this study. Son et al. found that the maximum baseline z-score ≥2.0 in children with KD demonstrated high predictive utility for CAA at 4–8 weeks of illness in a North American population.18 Narayan et al. reported that maximum baseline z-score ≥ 2.5 was the most important prognostic factor to predict CAA during follow-up in a Latin American population.29 The initial decreased shear stress and disturbed blood flow pattern are responsible for the CAA sequelae.30 These results underscore the importance of early echocardiography in KD management.
There are various established scoring systems designed to predict CAA to date. In this study, the authors assessed the performance of the nomogram model and three other risk-scoring systems (including Kobayashi,9 Egami,10 and Formosa11) in predicting CAA development in KD children aged over 5 years. The authors found that the nomogram model provided better results in AUC, sensitivity, specificity, and accuracy than the three other scoring systems, indicating a better accuracy and reliability of the present nomogram model. Consider that these three risk scores were mainly based on children under 5 years old, while this model was based on children over 5 years old. Therefore, the superiority of the present model is mainly responsible for the age difference of the subjects. For KD children aged >5, the rate of CAA at 4–8 weeks of illness can be obtained by entering corresponding clinical and laboratory characteristics according to the nomogram.
In the other extreme age range of KD, < 6 months or < 12 months, the risk of CAA is also higher than in the usual age range.8 Focusing on age-related differences in clinical and laboratory features of KD can help in early diagnosis and treatment, reducing the risk of CAA. Definitively, the association between patient age and CAA development warrants further investigation.
Several limitations of the present study should be acknowledged. First, this is a single-center retrospective study, so further multicenter prospective study is needed to validate this model externally. Second, missing data for covariates may result in some degree of bias. Nevertheless, the proportion of missing data among all variables was less than 10 %, and multiple imputations were used to mitigate the risk of bias.
ConclusionsThe authors established a simple-to-use dynamic nomogram model using NLR, IVIG resistance, and maximum baseline z-score ≥ 2.5. After verifying the performance of the nomogram model using various methods, the nomogram model displayed high accuracy and reliability in predicting the risk of CAA development in KD children over 5 years old. The established nomogram model might facilitate clinical decision-making in the implementation of treatment and follow-up strategies.


